
Published: September 1st, 2022
Filecoin (FIL) bulls showed a huge interest in this instrument from mid-June to July and shot higher by 90% in a couple of days. Moreover, the buying momentum from the critical support level came with a massive volume change, indicating institutions’ presence in the market.
However, the price rebounded from the fresh monthly high, where any bullish price action from the existing order block would be a decent buying opportunity.
Filecoin offers a peer-to-peer network within a distributed file storage system where people can rent out unused hard drive spaces. The project initiated its operation in 2017 by raising $205 million from the ICO and is planned to launch in 2019. However, the mainnet was pushed back to block number 148,888, which pushed it to delay the launch in mid-October 2020.
The total market cap of FIL is $1,572,815,495, which pushed it to remain in the top 50 coins from the Coinmarketcap list. The total coin circulation is 271,805,246.00 FIL, with no information on the maximum supply.
Let’s see the future price direction of Filecoin (FIL) from the FIL/USDT technical analysis:
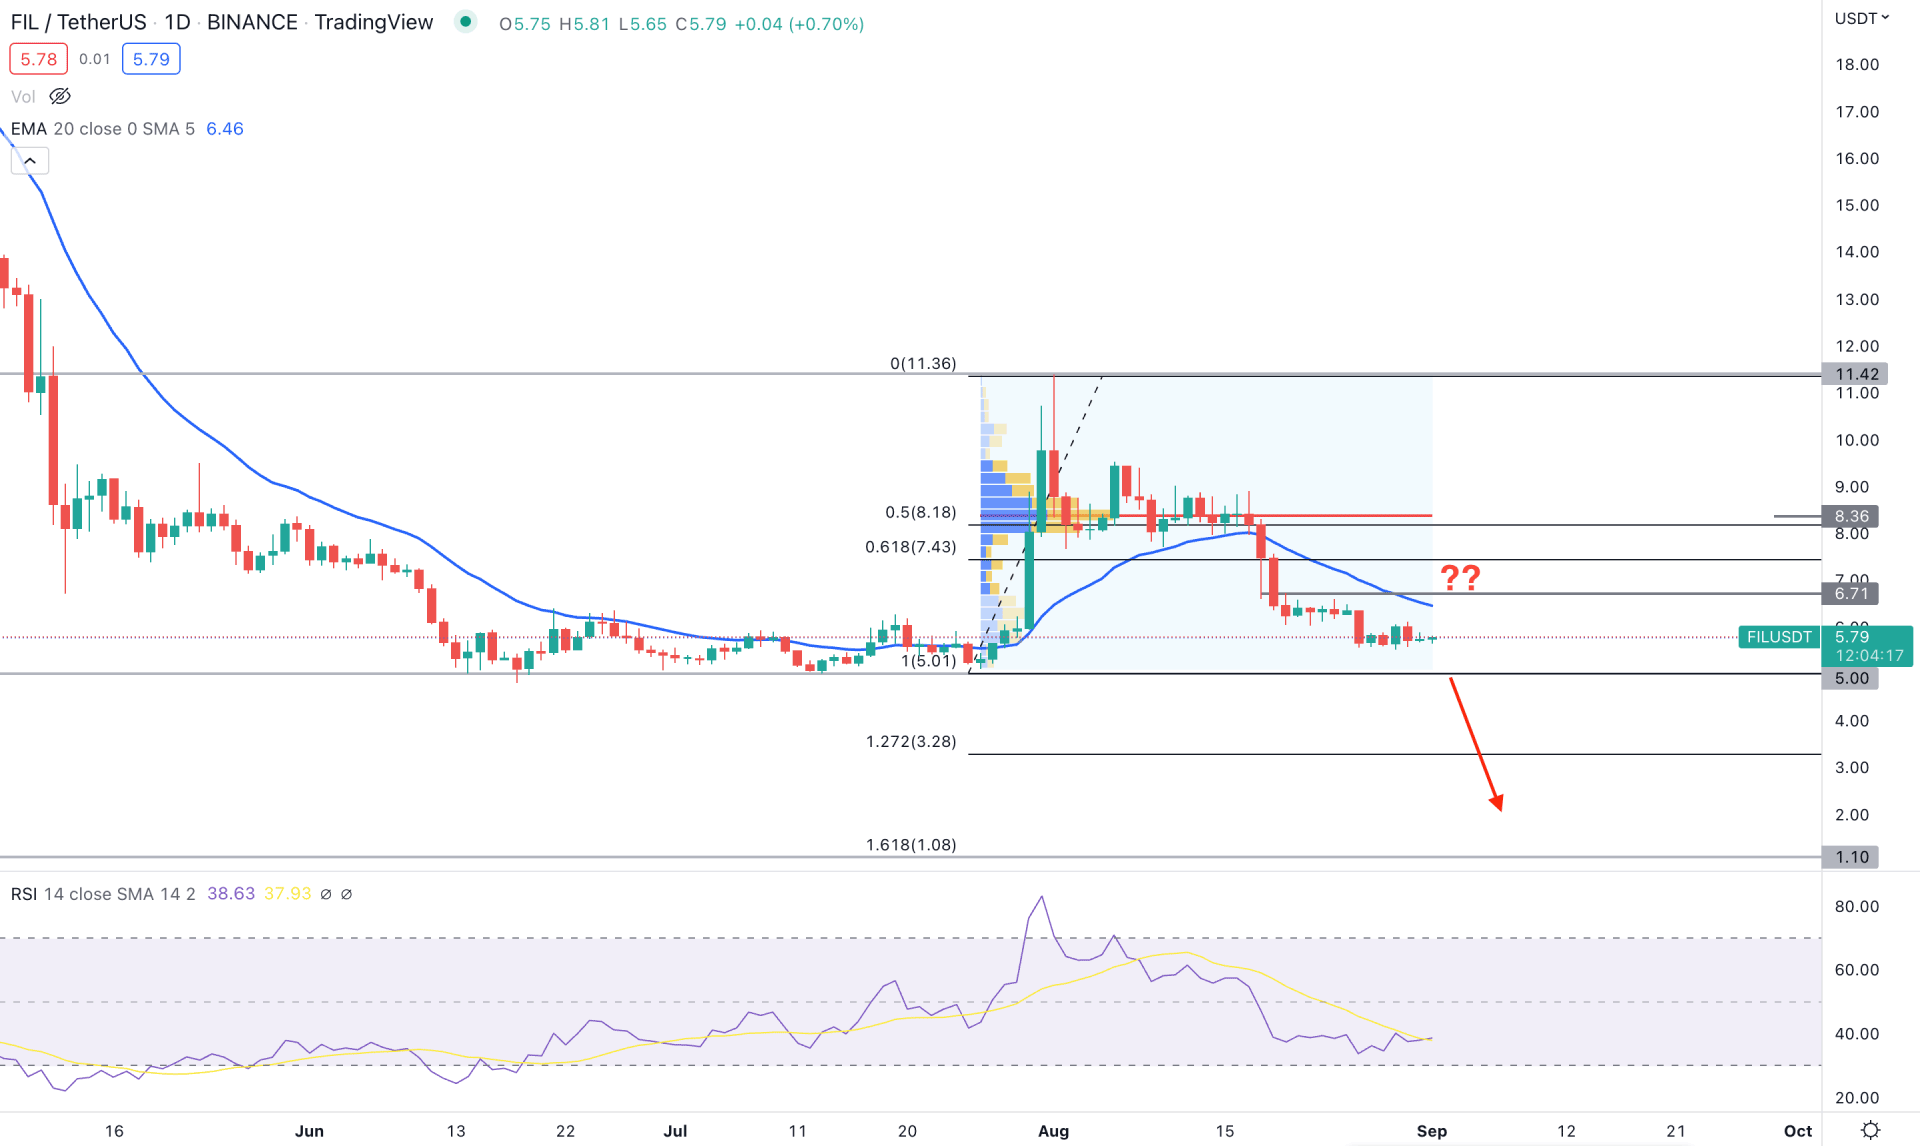
The bullish momentum in the FIL/USDT daily chart came with massive buying pressure from the 5.00 key support level. Bulls became stronger in July-August and made a sharp 122% gain with impulsive pressure.
As a result, the bulls made a strong break-of-structure by making a fresh swing high at the 11.42 level, which made the 6.02 to 5.00 zone a valid demand zone. Therefore, any further bullish price action in the existing demand zone would be a decent buying opportunity for this pair.
According to the volume structure, the highest trading volume from 11.42 swing high to 5.00 swing low is at the 8.36 level. The volume level clearly shows sellers' interest in bulls. Therefore, as the current bearish pressure from the 11.42 swing high is stronger than the bullish price action from 5.00, bears may regain momentum at any time to extend the loss.
The Relative Strength Index came down, visiting the overbought 70 level and yet to reach the 30.00 level. Therefore, the daily price defines two scenarios where the primary aim is to find a daily bearish candle below the 5.00 level before aiming for the 1.10 level, which is a 161.8% Fibonacci Extension level from 5.00 low to 11.42 high.
On the other hand, multiple confirmations are needed to go long in this pair- a strong bullish rejection from the 5.00 to 6.00 zone, a bullish daily candle above the dynamic 20 EMA, and an increase in volume.
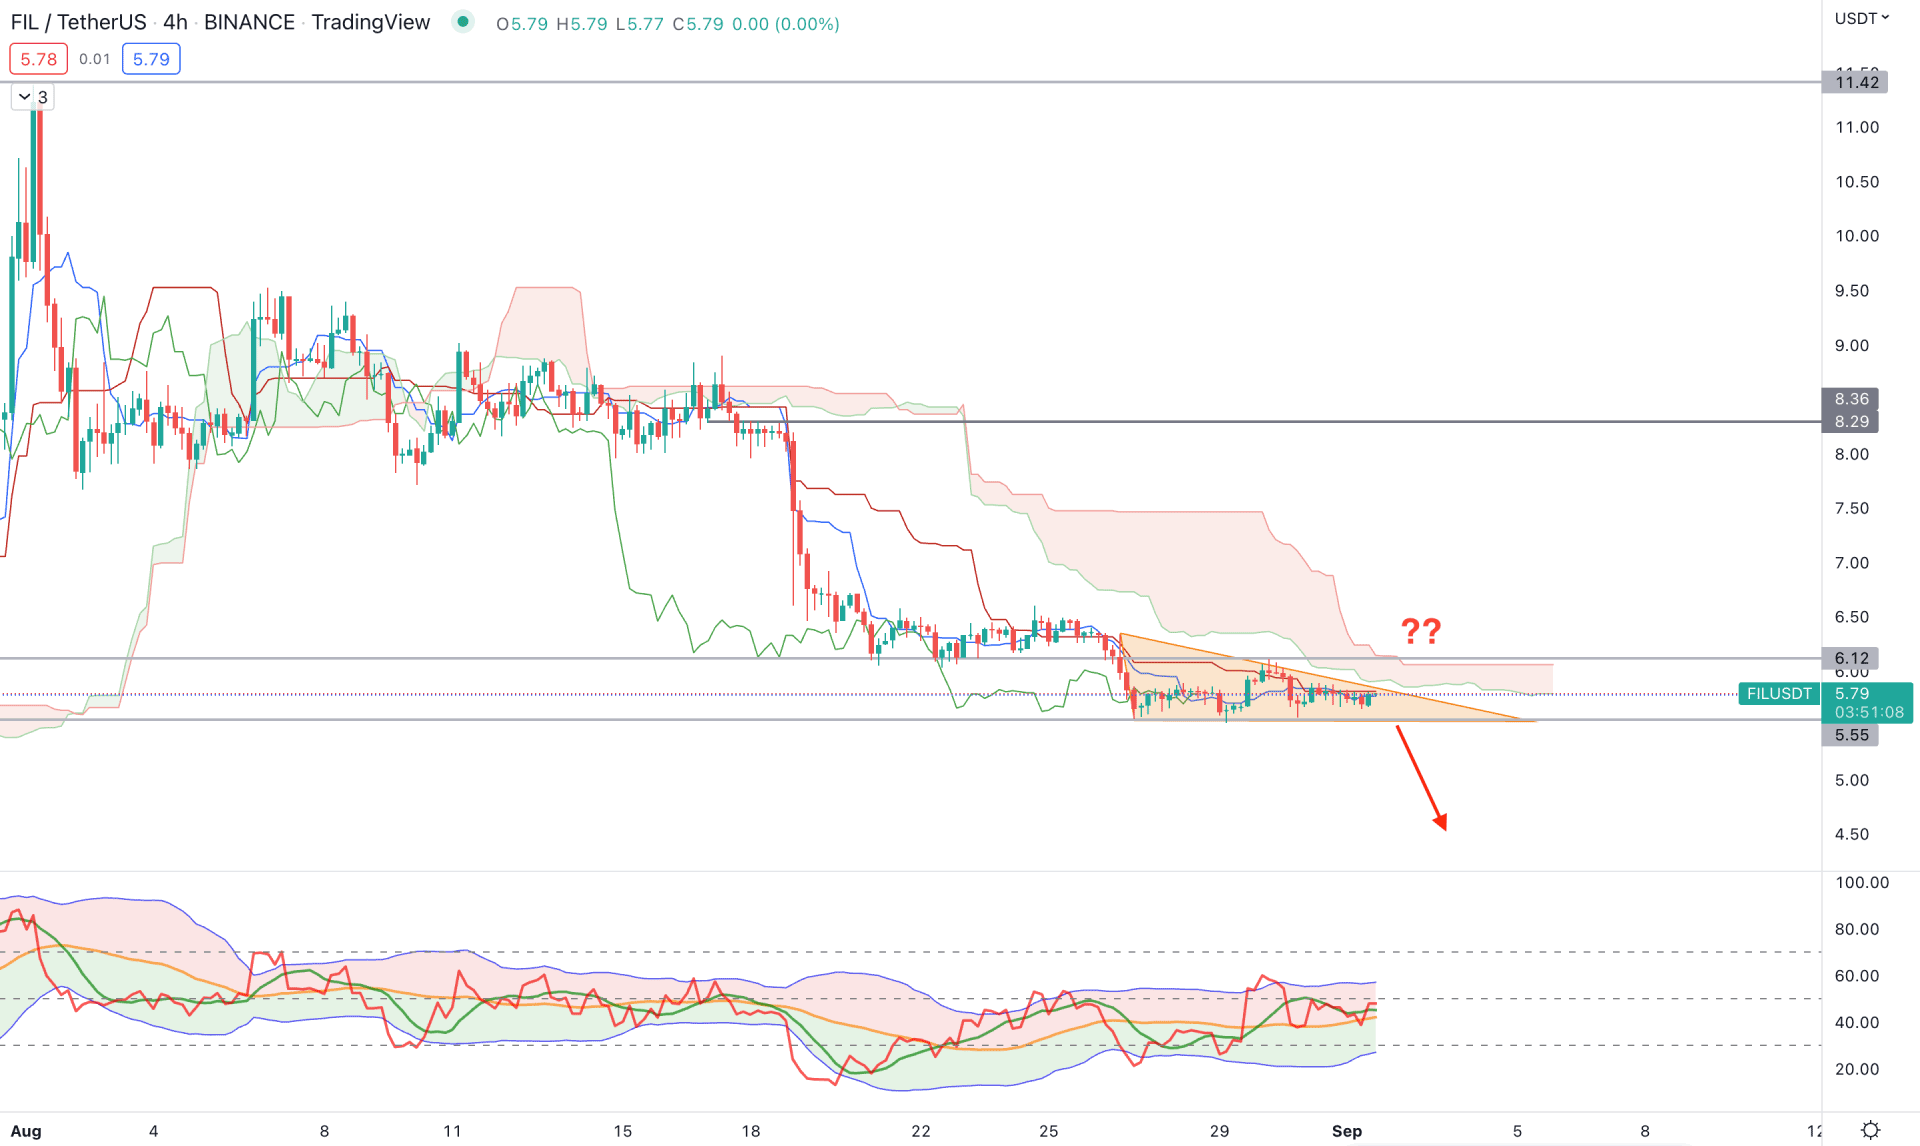
In the H4 chart, FIL/USDT trades below the Ichimoku Kumo Cloud with a stable bearish momentum. The price breakdown from the cloud support in mid-August with an impulsive pressure and extended the momentum with no buyers interest.
In the future cloud, the Senkou Span A and B are flat, indicating a corrective momentum, where a breakout is needed to extend the selling pressure below 5.55 support level.
The indicator window shows the TDI level above the 50% level, which needs to come down below the 40% area to validate the selling pressure. Moreover, the dynamic Tenkan Sen and Kijun Sen are closer to the price, working as immediate resistance.
Based on the H4 price action, a new bearish H4 candle below the 5.55 level would open the short opportunity toward the 4.00 target level. On the other hand, a bullish recovery with a candle close above the 6.12 level might open a long opportunity towards the 8.29 level.
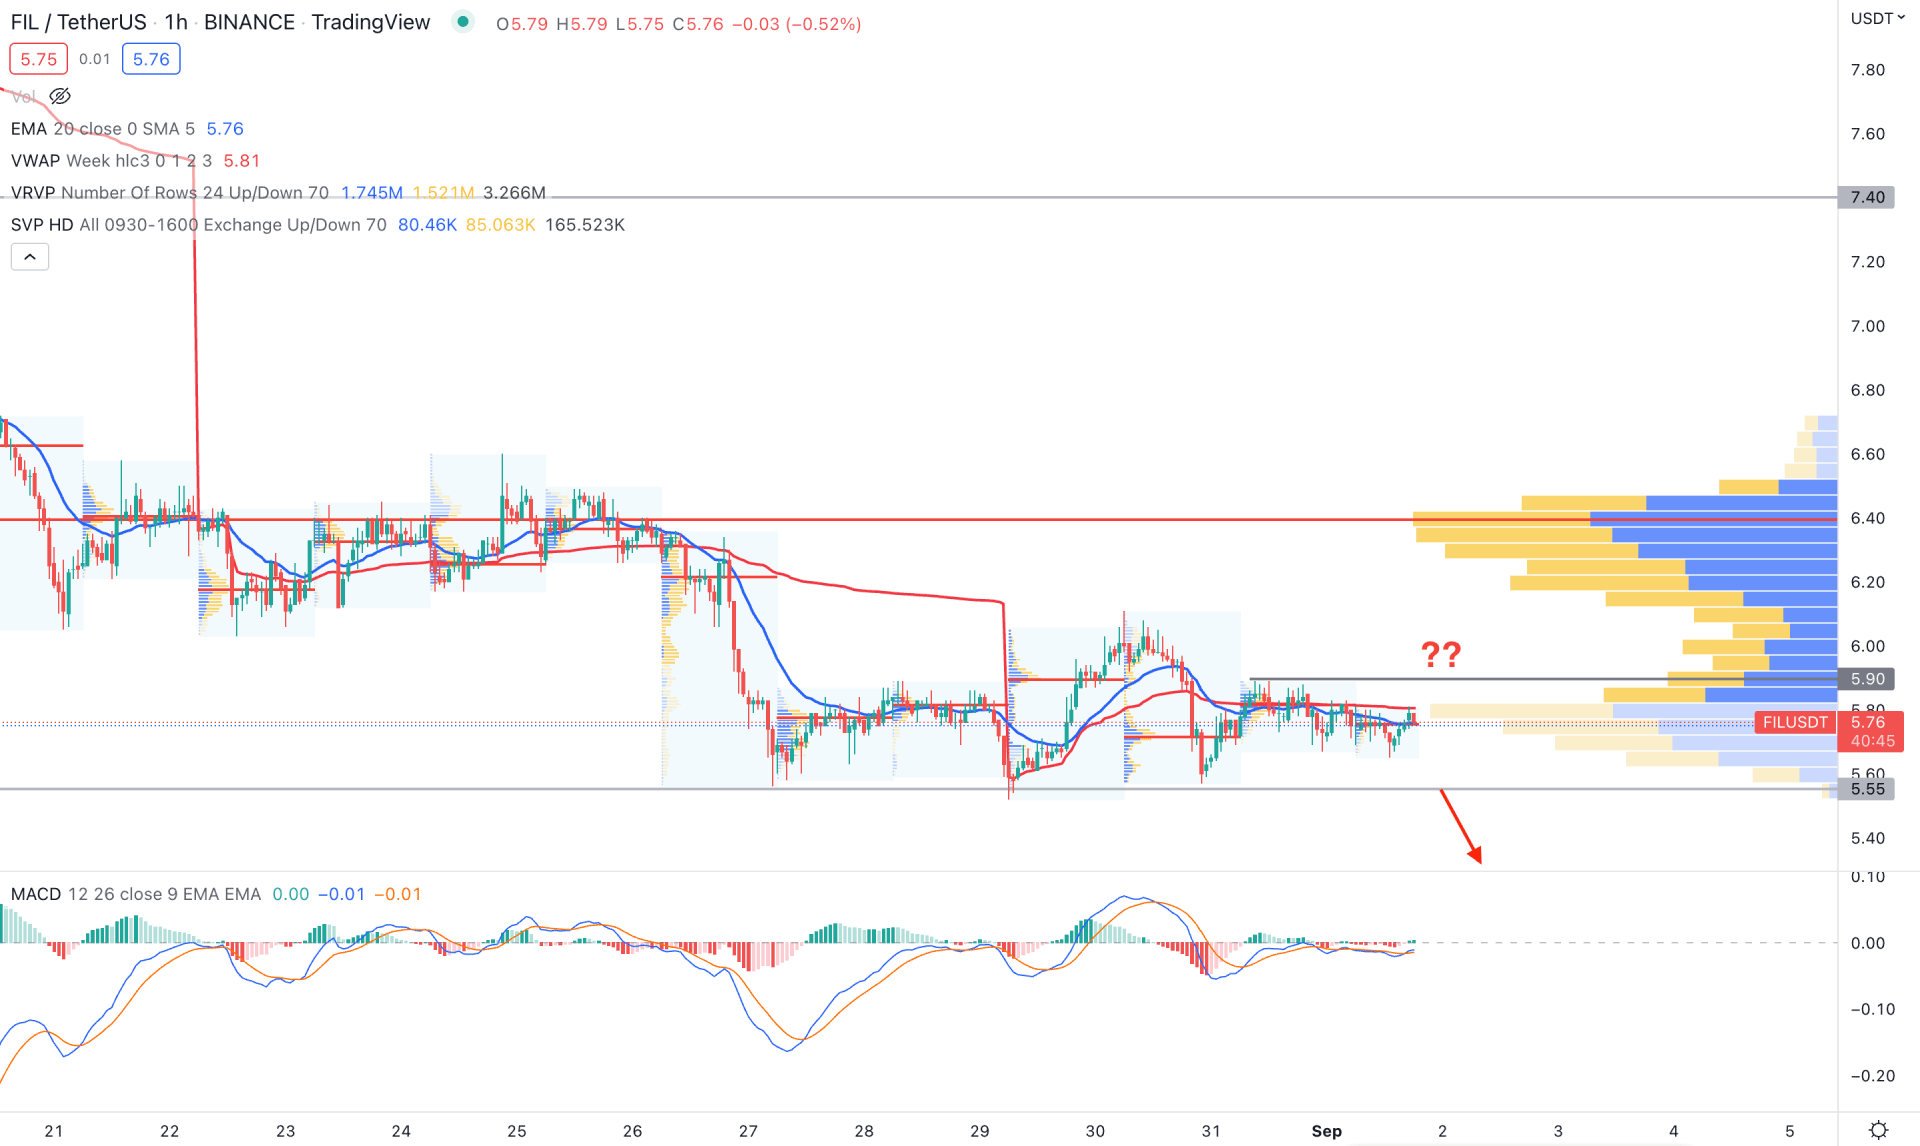
In the FIL/USDT 1-hour chart, the broader market context is volatile, where the most recent 30 candle indicates a corrective momentum.
Based on the visible range volume, the highest volume level since 21 August is at 6.40 level, a way above the current price. Moreover, the dynamic 20 EMA and weekly VWAP work as immediate resistance below the static 5.90 level.
The MACD Histogram is extremely corrective at the neutral zone, while the MACD EMAs are below the zero line. In that case, bears have a higher possibility of gaining momentum, where a new H1 candle below the 5.55 level would open a short opportunity towards the 4.00 level. On the other hand, a bullish break above the 5.90 level would increase the possibility of testing the 6.40 level before reaching the 7.40 key resistance level.
Based on the current multi-timeframe analysis, FIL/USDT is more likely to extend the selling pressure, where a bearish daily close below the 5.00 level would open a bearish opportunity.


