

Published: September 15th, 2026
For the first time since May, Filecoin (FIL) surpassed $1 after breaking out of a monthly range. However, the price failed to sustain the gain and rebounded lower with a pump-and-dump structure.
By concentrating on one of Filecoin's most well-known problems, the latest Solstice proposal might have given this new trend some legitimacy. This was the obstacle in the DataCaps approval procedure.
The Solstice update would link block reward payments directly to confirmed transactional payments. This suggests that the FIL economic model and actual network usage would be directly correlated.
With roughly 1,337 daily open addresses and a $3.1 million DeFi TVL, current FVM activity is still quite low.
This implies that rather than robust utilization today, the rise represents an investment in future growth. The outlook is strengthened by the solstice, but FIL's breakout will require increased network activity.
After reaching $1.0299 before declining to $0.9685, FIL's breakthrough is currently challenging the psychological $1 barrier. With open interest rising to about $284 million, the move has drawn new derivatives positioning.
Additionally, futures volume was about ten times spot activity, suggesting leverage is a key driver. This strength increases the possibility of more severe swings if traders start taking profits, but it may also help FIL clear $1.
Let's see the full analysis from the FIL/USDT technical outlook:
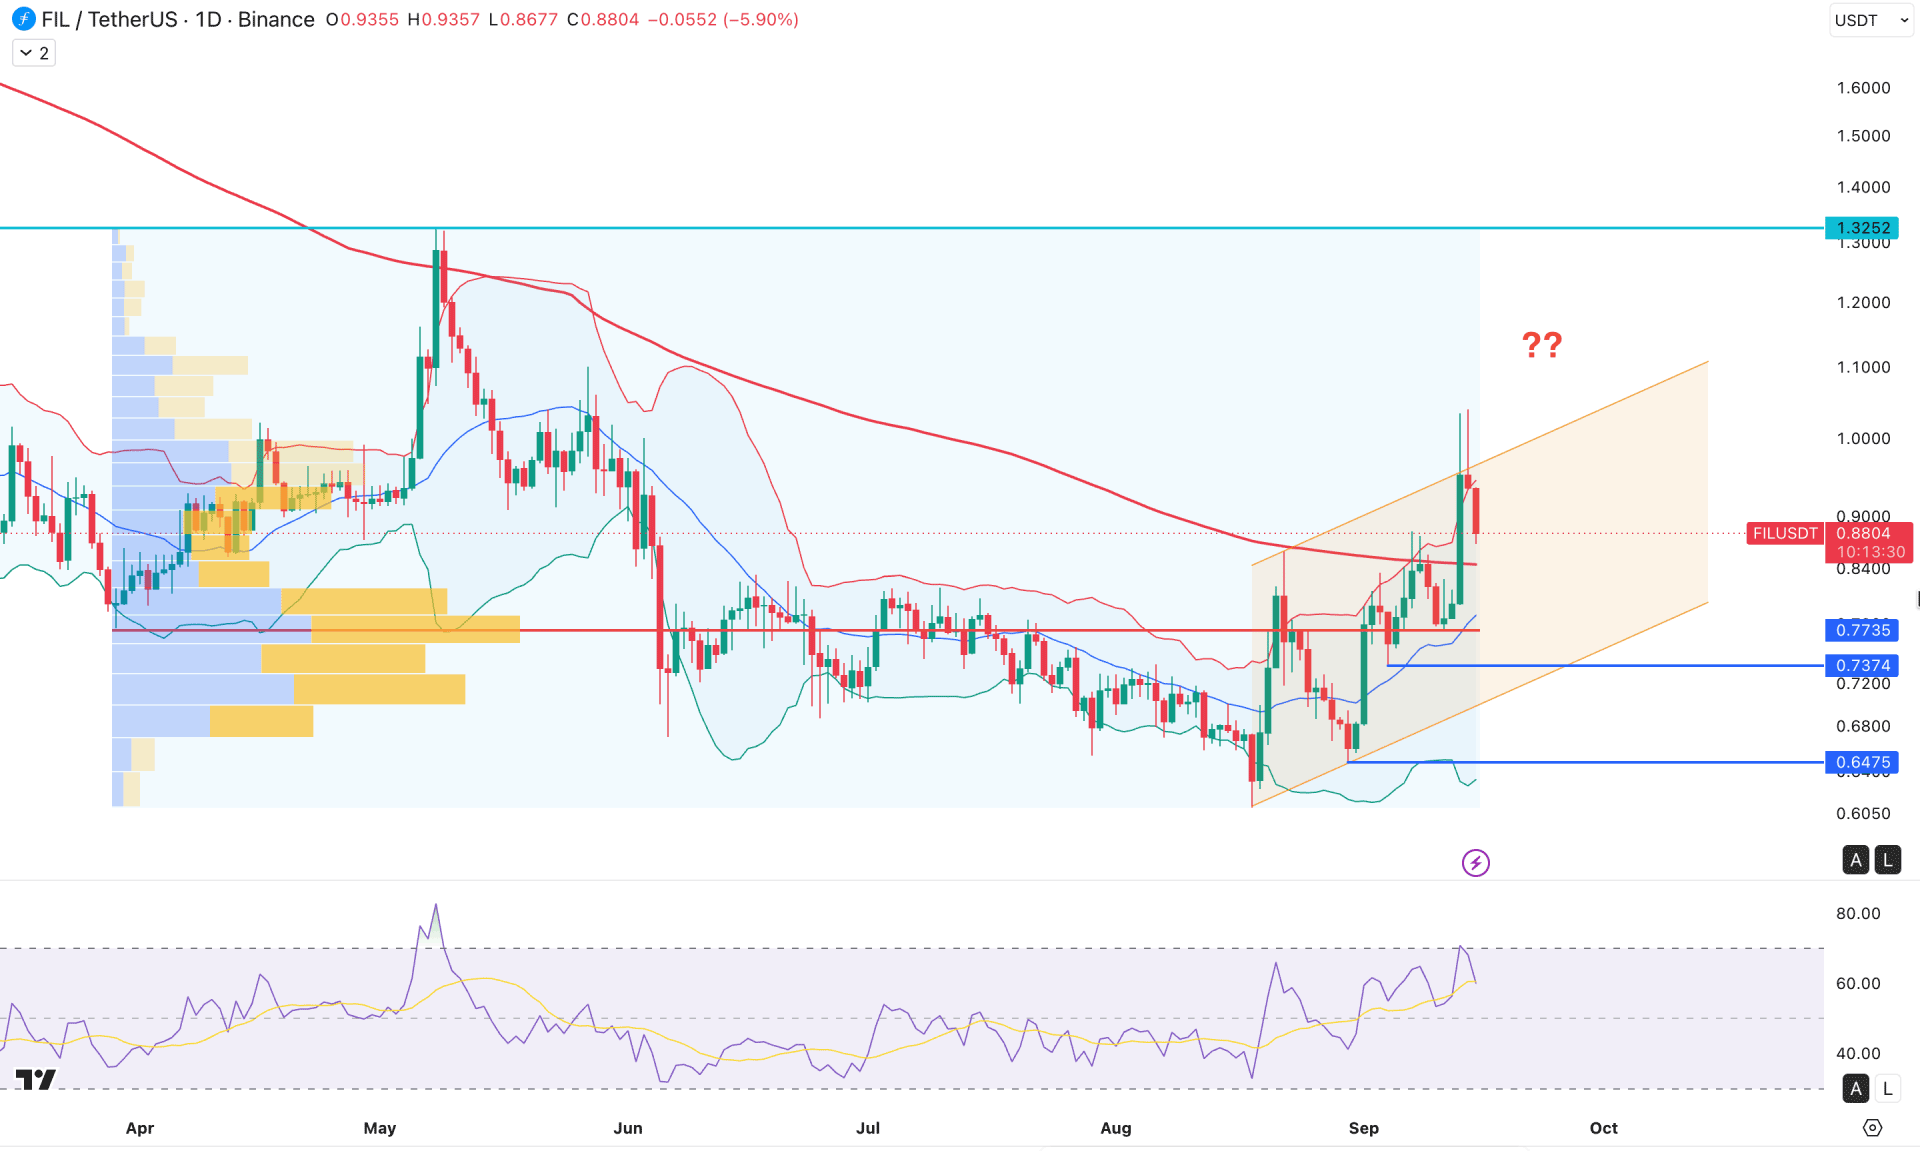
On the FIL/USDT daily chart, recent momentum shows a strong bullish reaction after forming a swing low below the July 2026 low. Price rebounded and showed impulsive bullish pressure before creating consecutive higher highs. This signals a valid trend reversal and warrants closer attention before considering a bullish rebound.
On the higher timeframe, the overall structure is bearish, while the current monthly candle shows strong buy-side liquidity from the June 2026 high. Ongoing bullish pressure came with two consecutive gravestone doji candle formations on the monthly timeframe, signaling indecision. Primarily, failure to hold the price above the June 2026 high is a challenging factor for buyers. The weekly timeframe shows a corrective bearish structure after consecutive bullish closes, signaling a likely downside correction.
Looking at the volume structure, market momentum remains bullish, as the most active level since April 2026 sits at 0.7735, below the current price and near the existing swing low. Primarily, a bullish breakout structure is visible from the high-volume line, signaling buying pressure that needs validation from the nearby order block.
In the main price chart, a strong bullish daily candle is present above the 200-day Simple Moving Average, signaling a measured bullish rebound. However, it is the first time the price has moved below the 200 SMA in the last six months, which is significant when considering a trend reversal.
In the main price chart, price moved beyond the upper Bollinger Band, signaling an extreme bullish condition, but failed to hold momentum above it. As a result, an immediate rebound is visible, while immediate support is marked at the 0.7735 high-volume line.
In the indicator window, the Relative Strength Index tested the 70.00 overbought level before rebounding. Currently, the RSI is hovering between 50.00 and 70.00, signaling a corrective bullish structure.
Based on the daily market structure, the recent bullish breakout above the 200 SMA is the primary sign of possible bullish strength continuation, but it needs more confirmation from near-term price action. As price faces selling pressure from the upper Bollinger Band, it is likely to extend downside pressure and test the 0.7374 support level in the coming days.
On the bullish side, the 0.7735 to 0.6475 area is a crucial bullish zone to watch. A valid bullish reaction from this area, along with a recovery above the 200 SMA, could validate a long opportunity targeting the 1.3252 resistance level. Moreover, a break of this key swing high could take prices beyond the 2.4296 area.
On the other hand, immediate selling pressure is visible from an ascending channel formation. A failure to hold the channel support, with bearish impulsive continuation below the 0.6475 level, could push price even lower, below the 0.6000 area.
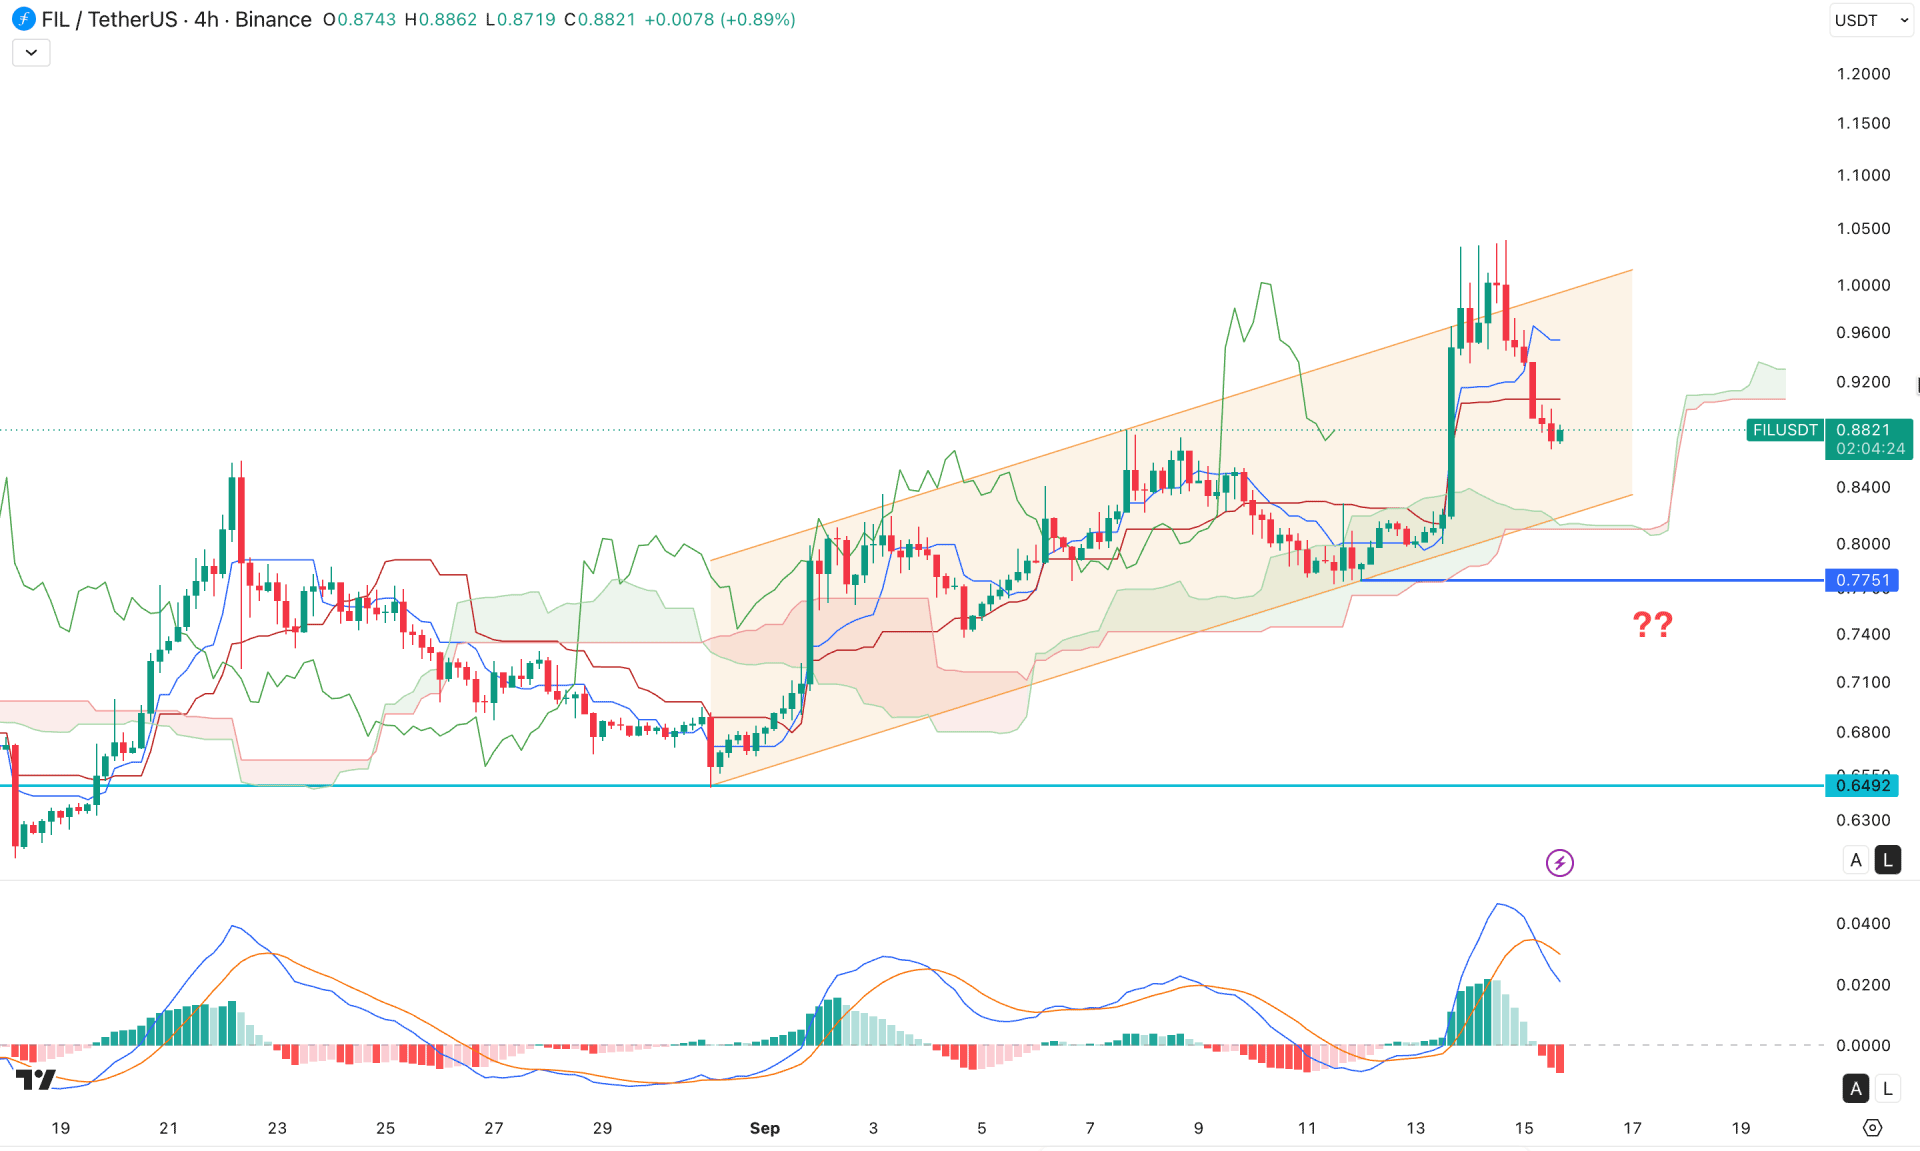
On the four-hour timeframe, FIL/USDT is trading within an ascending channel pattern, while recent price action has become volatile after moving beyond the channel resistance. This signals an extreme bullish condition, with a considerable correction pending.
In the Ichimoku Cloud structure, the Kumo Cloud is not thick enough to support a bullish continuation. The future cloud moved sideways, where both lines are running parallel. The dynamic lines are also above the current price, with multiple bearish candles trading below these lines.
In the secondary indicator window, the MACD signal line has formed a bearish crossover, along with multiple red histogram formations.
Based on this structure, corrective momentum is present, and the price is likely to test the cloud support before forming a bullish signal. On the bearish side, watch immediate support at 0.7751, which may be tested before a bullish rebound. If price fails to hold momentum at 0.7751, the next support level to watch is the 0.6492 area.
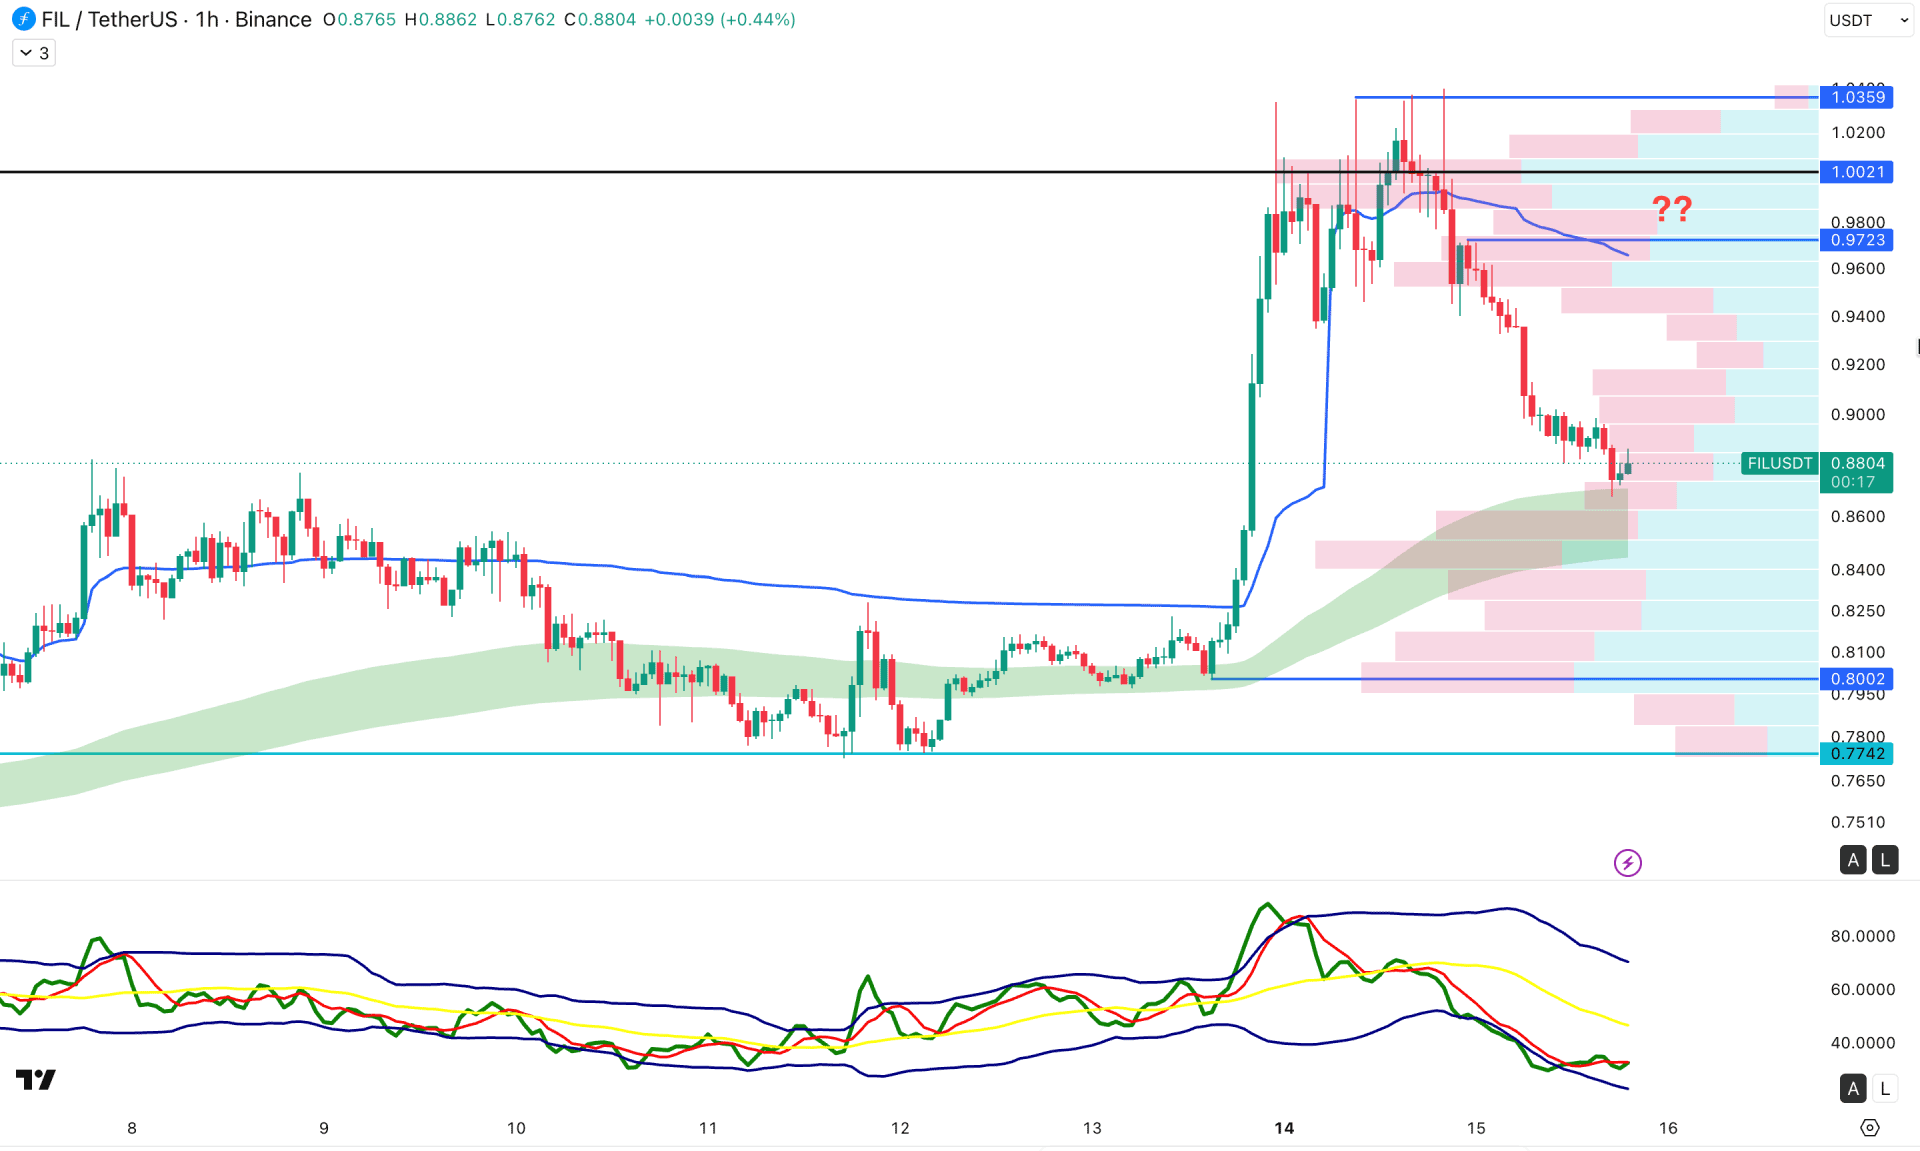
On the FIL/USDT H1 chart, current market momentum is bearish, with a clear pump-and-dump structure. Price became volatile after creating an intraday peak at the 1.0000 psychological level, then moved sideways. As a result, consecutive downside pressure is visible below the weekly VWAP line, while the high-volume line is marked at 1.0021.
The Traders Dynamic Index shows corrective pressure, while the recent lines have peaked and moved sideways.
Based on this market structure, the current bearish pressure is likely to find a barrier from the EMA wave. However, with no sign of a bullish rebound, price is likely to break below the EMA wave and find support at the 0.8002 swing-low level.
On the bullish side, recovery above the weekly VWAP level could increase the bullish possibility, with a new swing-high formation above the 1.0359 level.
Based on the overall market structure, FIL/USDT is trading within a pump-and-dump structure, with multiple bearish candles after a new swing high. The market remains bearish, with room to move lower. As a result, a break below the 200 SMA could be a high-probability short opportunity, targeting the near-term daily swing low.


