
Published: December 22nd, 2022
The Cambridge-based artificial intelligence lab Fetch.ai has a native token FET. The price of FET has gained almost a third after the lab released the Fetch.ai wallet latest upgrade.
Fetch.ai became the first official AI Partner of the men’s and women’s teams for West Ham United Football Club in March 2022. The club plays in the English Premier League. Fetch.ai combines AI and machine learning (ML) capabilities with blockchain technology.
Fetch.ai said that the mainnet wallet “is quick and easy to set up,” as well as “intuitive to use, and ultra-secure.”
It also enables a messaging feature, allowing contacts to converse with each other “from inside the wallet”. “These messages are end-to-end encrypted, so only you and the person you are communicating with can read the message,” Fetch.ai said.
Additionally, the wallet uses the inter-blockchain communication (IBC) protocol, allowing users to transfer tokens to other accounts natively.
The mainnet wallet also supports other Cosmos-based networks, such as Juno Network and Osmosis.
The recent upside pressure in this token grabbed broader investors' attention but it is worth checking the buying possibility from the technical point.
Let’s see the future price of Fetch.ai (FET) from the FET/USDT technical analysis:
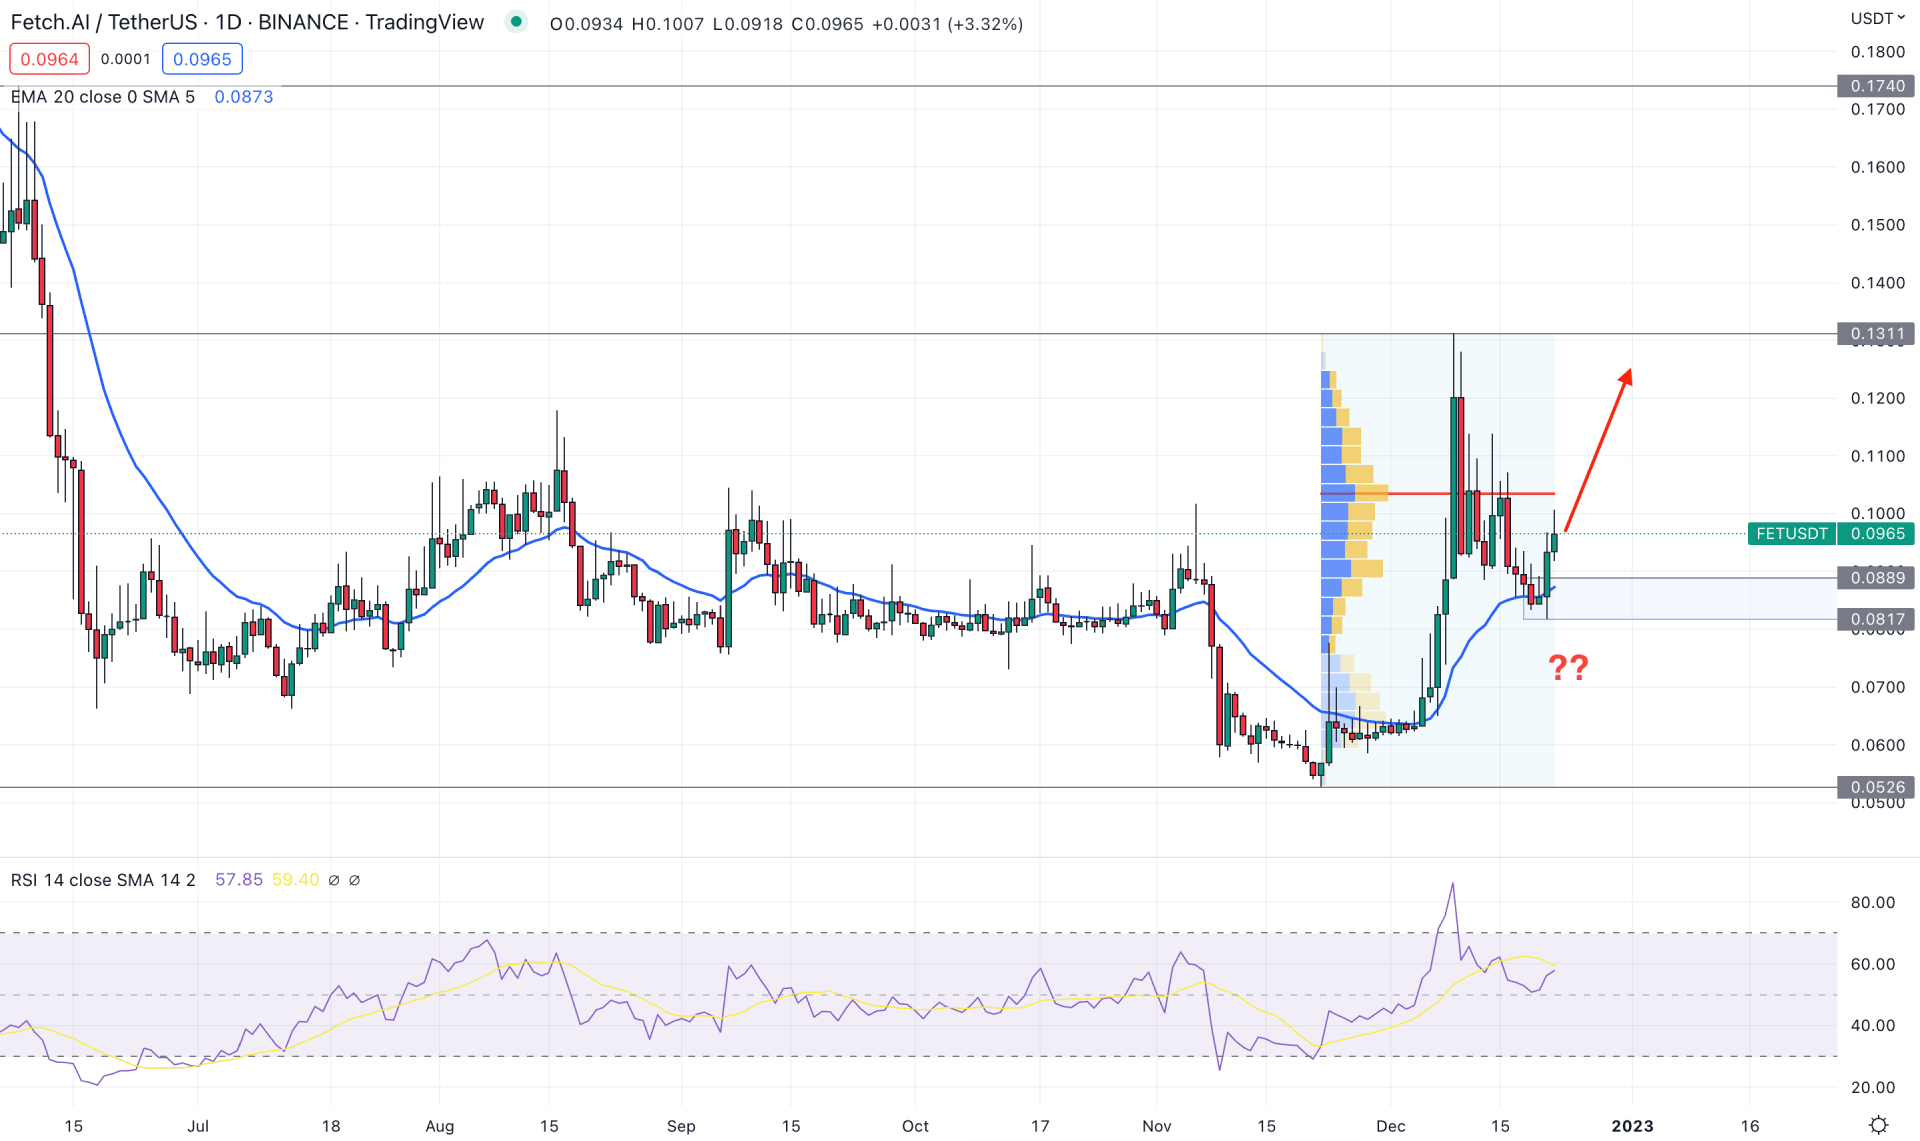
In the daily chart, the current trading range for FET is from 0.1331 top to 0.0526 low. As the current price trades at the 50% area of this zone, investors should wait for a strong confirmation before joining the bullish/bearish opportunity.
If we read the price from left to right, the selling pressure is clearly visible as the price is moving down from the yearly opening. However, the bullish recovery from the 0.0700 psychological level with a formation of the valid bottom at the 0.0526 level is a sign that bulls have joined the market. In that case, the bullish trend continuation opportunity is available once there is enough evidence that strong buying pressure is supporting the price.
Based on the high volume level from November low to December high, the most active level was spotted at the 0.1034 level, which is above the current price. Therefore, it is a sign that the existing bullish momentum from the November low is questioned by a high volume selling pressure, where more clues are needed to see before opening a long position.
The current price is facing support from the 0.0889 to 0.0817 zone from where a bullish rejection with a daily candle close appeared. Therefore, as long as the price is holding this zone, the primary outlook of this pair would be bullish. The dynamic 20 EMA is also working as a support, where the RSI shows buying pressure from the neutral 50% level.
Based on this structure, the buying possibility is not solid and investors should wait for a daily candle close above the 0.1040 level to find a safe buying possibility. In that case, the upside possibility is solid towards the 0.1600 psychological level.
The alternative approach is to wait for the price to come below the 0.0800 level with a daily close, which can drag the price down towards the 0.0526 level.
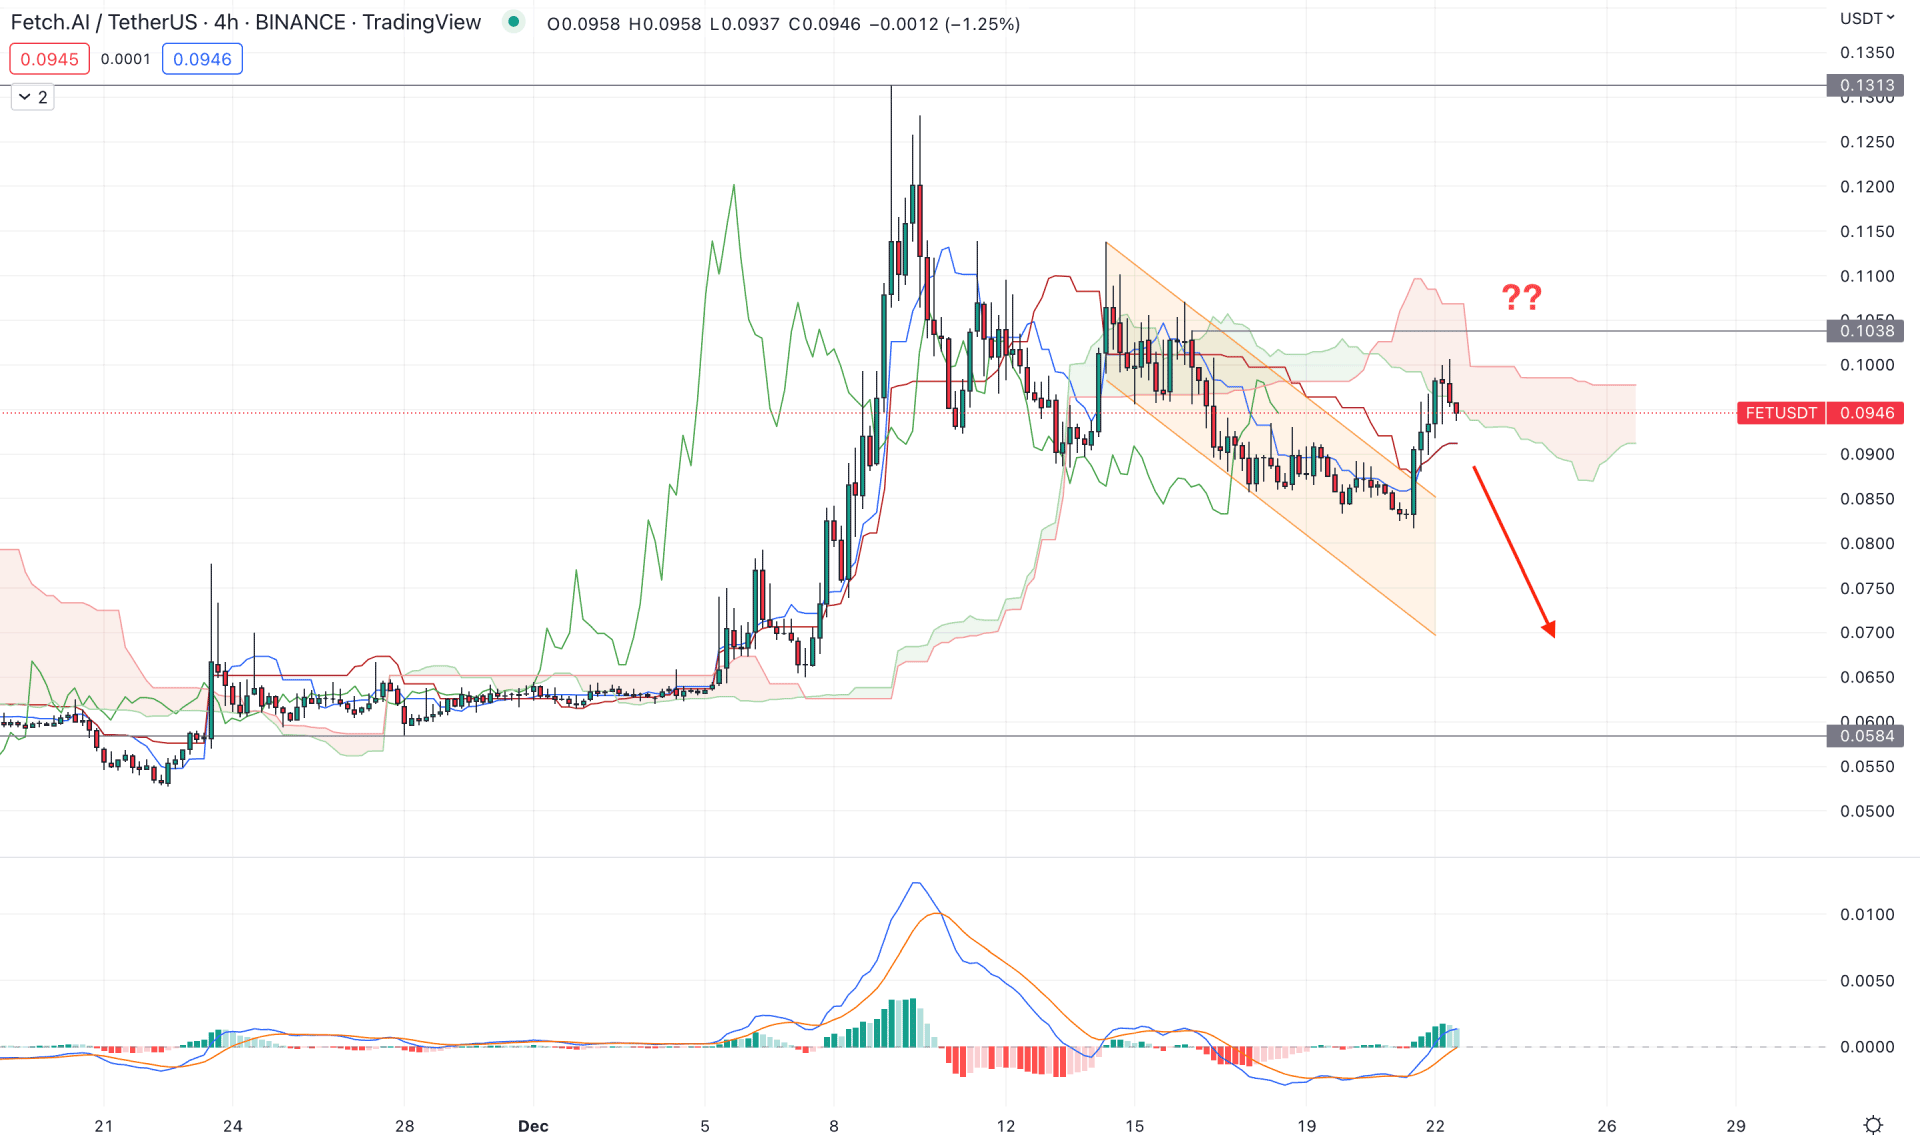
In the H4 timeframe, the FET/USDT price formed a bullish channel breakout with impulsive pressure but the location of the channel is not supportive to buyers.
In the future cloud, the Senkou Span A is aiming higher, while the Senkou Span B is still above the A. It is a sign that short-term buying pressure is visible in the FET/USDT price but the medium-term outlook is still bearish.
The indicator window shows buying pressure as the current MACD Histogram is above the neutral line while the dynamic Tenkan Sen and Kijun Sen are below the current price.
Based on this structure, the safest option is to wait for a bearish H4 candle below the dynamic Kijun Sen and open a short position, targeting the 0.0584 level.
On the other hand, bulls should wait for the price to move beyond the 0.1038 level and form a daily close before validating the buying opportunity, towards the 0.1313 key resistance level.
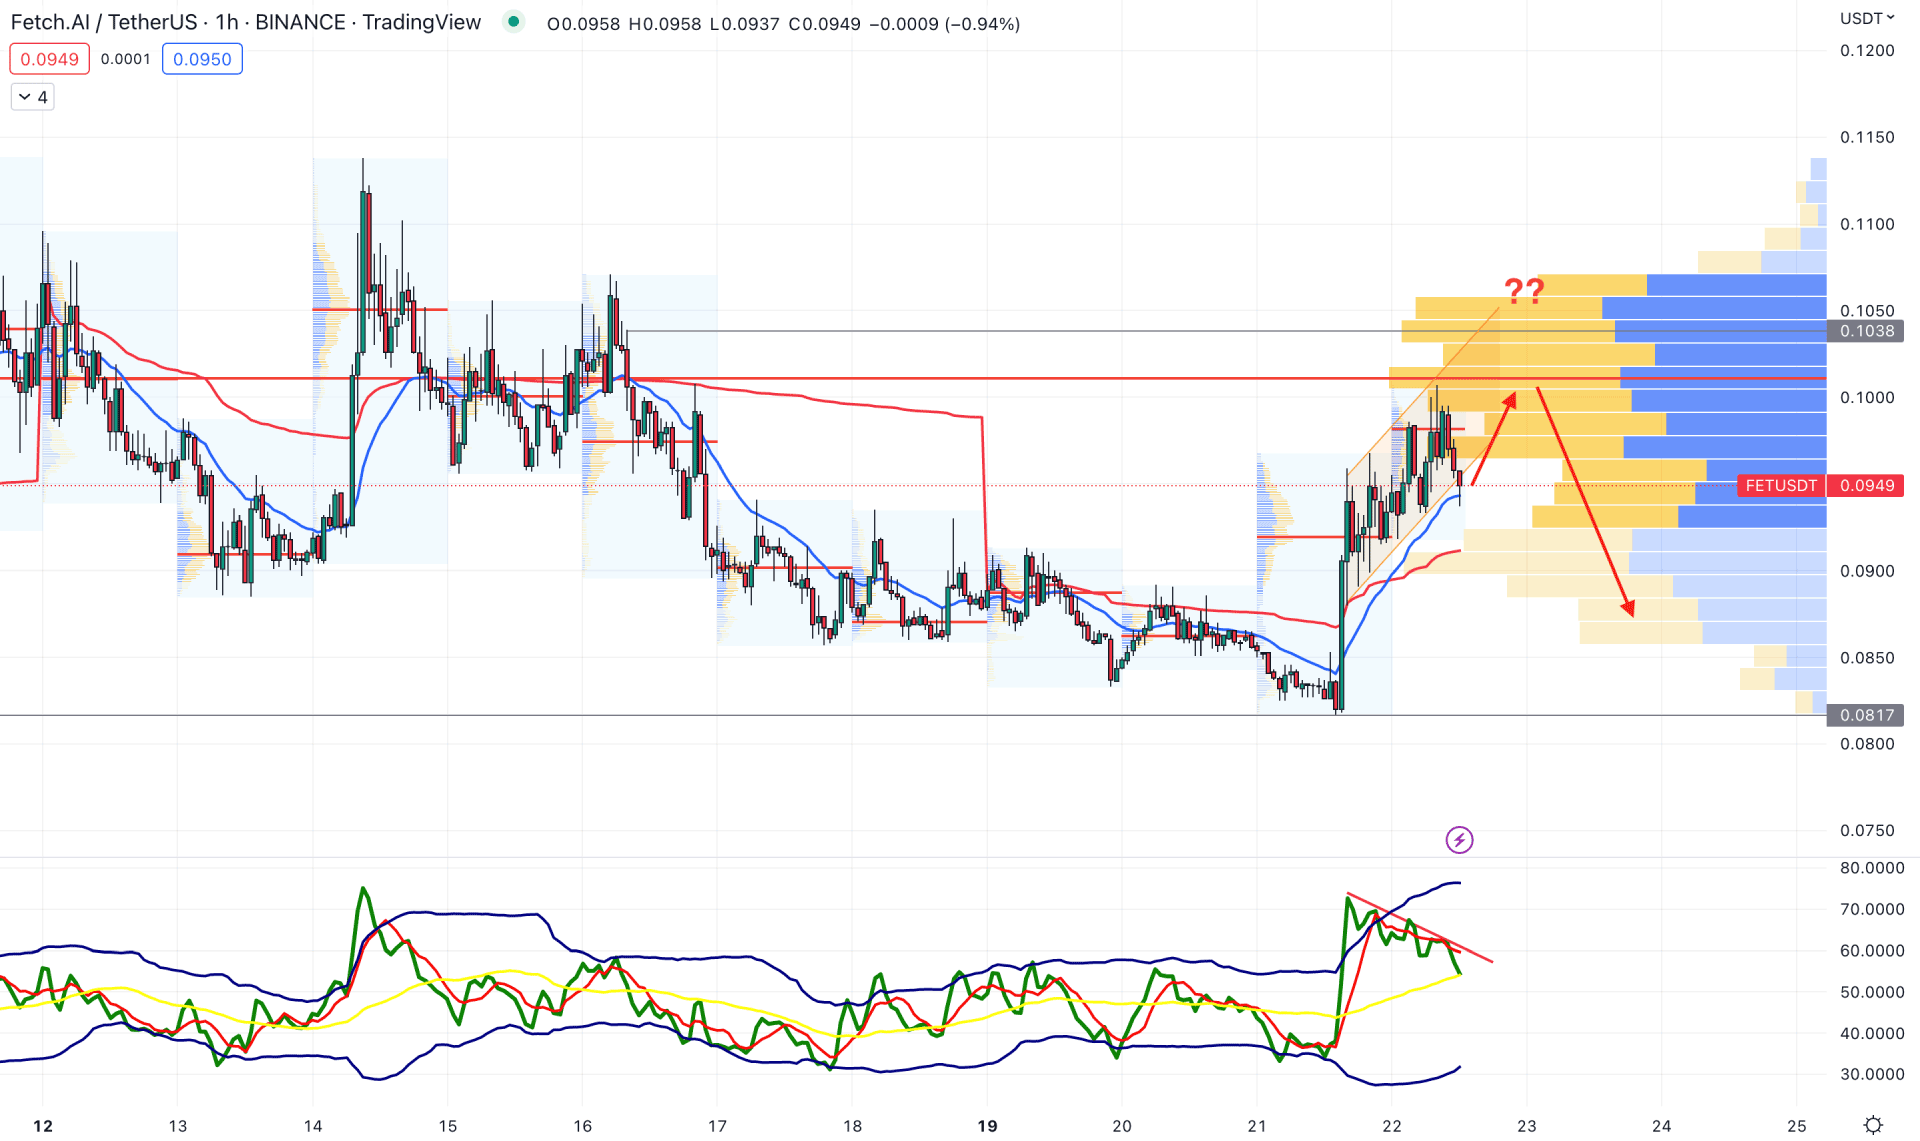
In the hourly chart, the current price is trading within a corrective price action where the visible range high volume level is at 0.1011 level. Moreover, there is a potential divergence with the Traders Dynamic Index, which could increase the selling pressure in the market.
The dynamic 20 EMA is below the price and working as a support level, while the weekly VWAP is backing the buying pressure.
The H1 price action is still corrective whereas another upside pressure towards the 0.1000 level is pending. Any bearish rejection from the 0.1000 to 0.1020 area could offer a short opportunity for the coming hours. On the other hand, a bullish breakout with an H4 close above the 0.1020 level is needed to aim for the 0.2000 area.
As per the current market context, bullish pressure needs a valid breakout with support from volume in the daily price. As the current price is corrective and trading below the major high volume level, sellers have a higher possibility of lowering the price in the coming days.


