
Published: July 17th, 2024
The AI crypto sector is expanding rapidly, as governments and institutions intend to allocate billions to the industry's technological advancement and expansion. The Saudi Government intends to be the largest beneficiary of AI advancements, contributing over $135 billion by 2030, while Pantera Capital has announced a $200 million investment in the AI sector.
During a bearish market, investors might expect a potential comeback of Fetch.ai (FET), a prominent emerging AI crypto.
Phase 1 of the token merger for Fetch.ai (FET), rebranded as Artificial Superintelligence Alliance (FET), successfully concluded a positive month. Despite minor price increases, the merger has failed to generate substantial capital inflows, which limited the gain compared to its peers.
Once the merger is finalized, experts anticipate that the AI crypto will exhibit exceptional performance, enhancing stability and transparency. As new large-scale investors enter the market, a price break above 1.8 is highly anticipated.
Let's see the further aspect of this coin from the FET/USDT technical analysis:
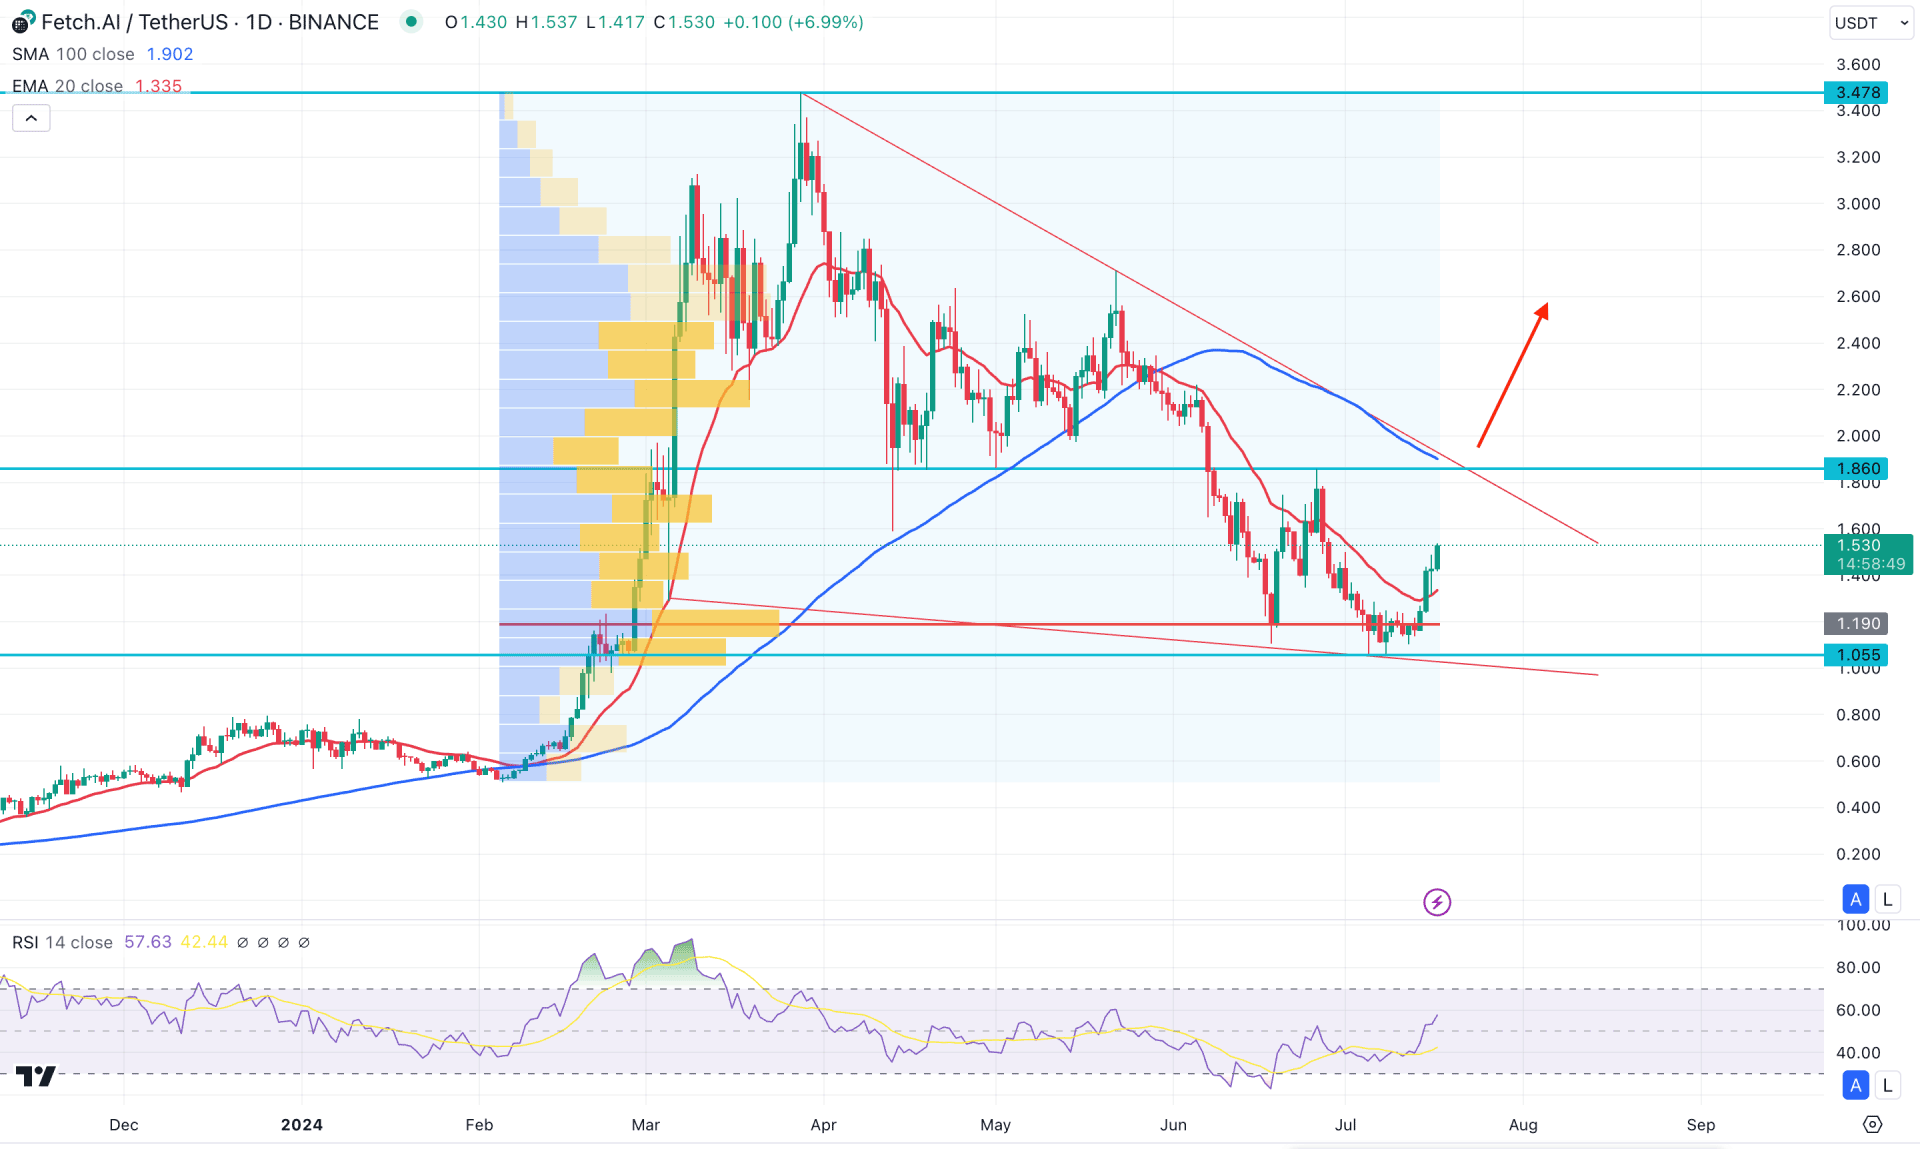
In the daily chart of FET/USDT, the bullish wave from February 2024 low showed an impulsive pressure and reached the peak at 3.478 level. However, the price went sideways after creating the top and moved below the 50% Fibonacci Retracement zone.
In the most recent chart, the price failed to move below the February 2024 low and became volatile at the 1.055 support level. As the current price is trading higher from the crucial support line, we may expect the buying pressure to extend. Also, the most high volume level since February 2024 is at 1.190 level, which is below the current price. Primarily, we may expect that bulls are potent as long as the high volume line remains steady below the current price.
In the main price chart, the 100-day Simple Moving Average is above the current price, suggesting ongoing selling pressure on a long-term basis. However, a minor bullish surge is present above the 20-day Exponential Moving Average, which might work as a primary bullish signal.
In the indicator window, the Relative Strength Index (RSI) moved above the 50.00 neutral point, suggesting a bullish reversal in the main chart. Also, the upward pressure in the main price chart could extend until the RSI reached the 70.00 overbought zone.
Based on the daily outlook of FET/USDT, the recent buying pressure from the symmetrical triangle bottom is likely to extend the upward pressure and find resistance at the 1.860 static level. Moreover, a successful break above the 1.860 resistance level with a stable market above the symmetrical triangle resistance could validate the long-term bullish opportunity, targeting the 3.478 level.
On the other hand, a failure to maintain the bullish momentum above the 20-day EMA with an immediate downside pressure could open a short opportunity, targeting the 0.600 psychological level.
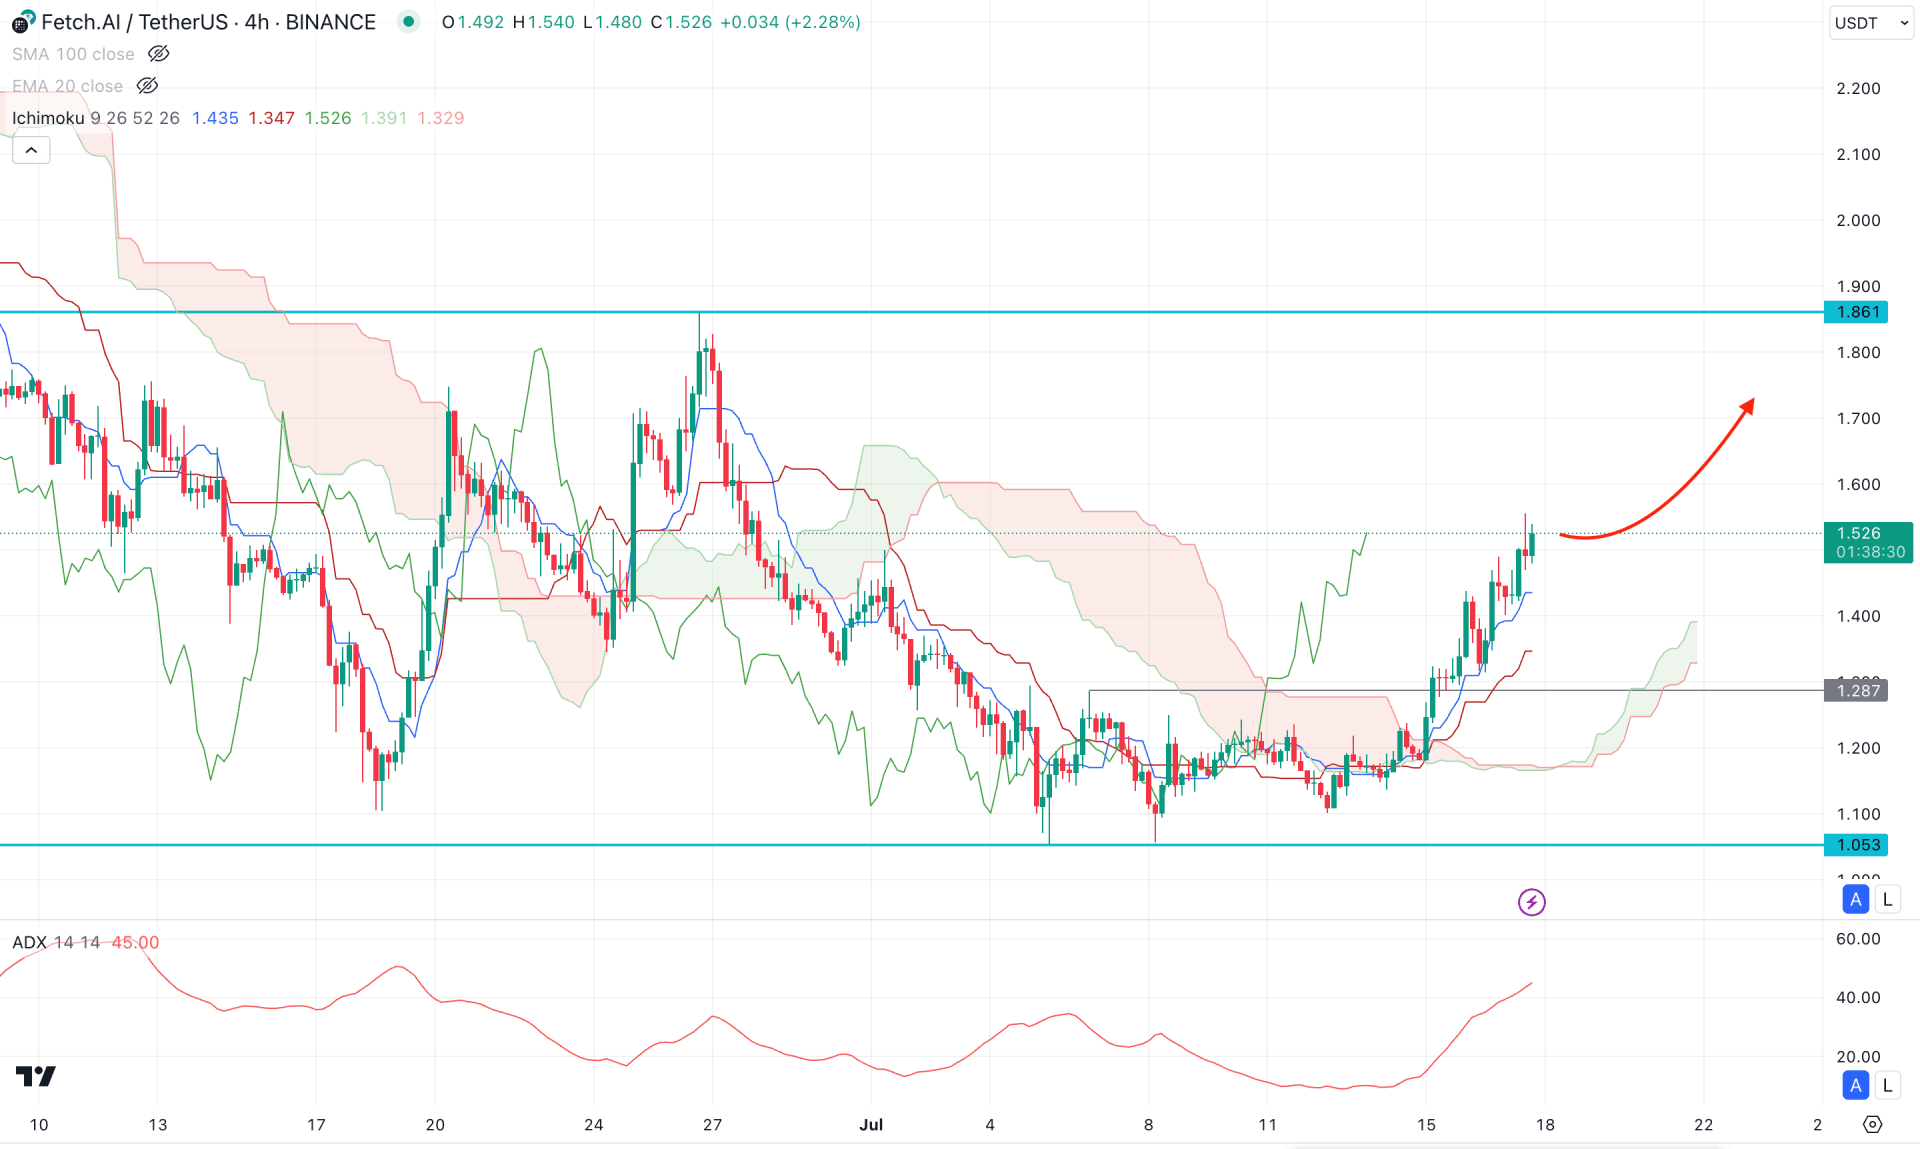
In the H4 timeframe, a potential bullish rebound is visible from the 1.053 support level, which took the price above the dynamic Ichimoku Cloud zone. Moreover, the future cloud shows a potential bullish continuation as Senkou Span A and B aimed higher.
The indicator window shows a similar outlook, where a stable trend is visible from the ADX line, which is above the 40.00 zone. Primarily, we may expect the upward pressure to continue and complete the U-shape recovery as long as the ADX remains above the 20.00 satisfactory zone.
A successful form of the U-shape recovery with a valid breakout could open a long-term bullish signal, targeting the 3.000 area.
On the other hand, a minor downside correction is possible toward the dynamic Kijun Sen level, but a break below the 1.278 low might lower the price below the 1.053 support line.
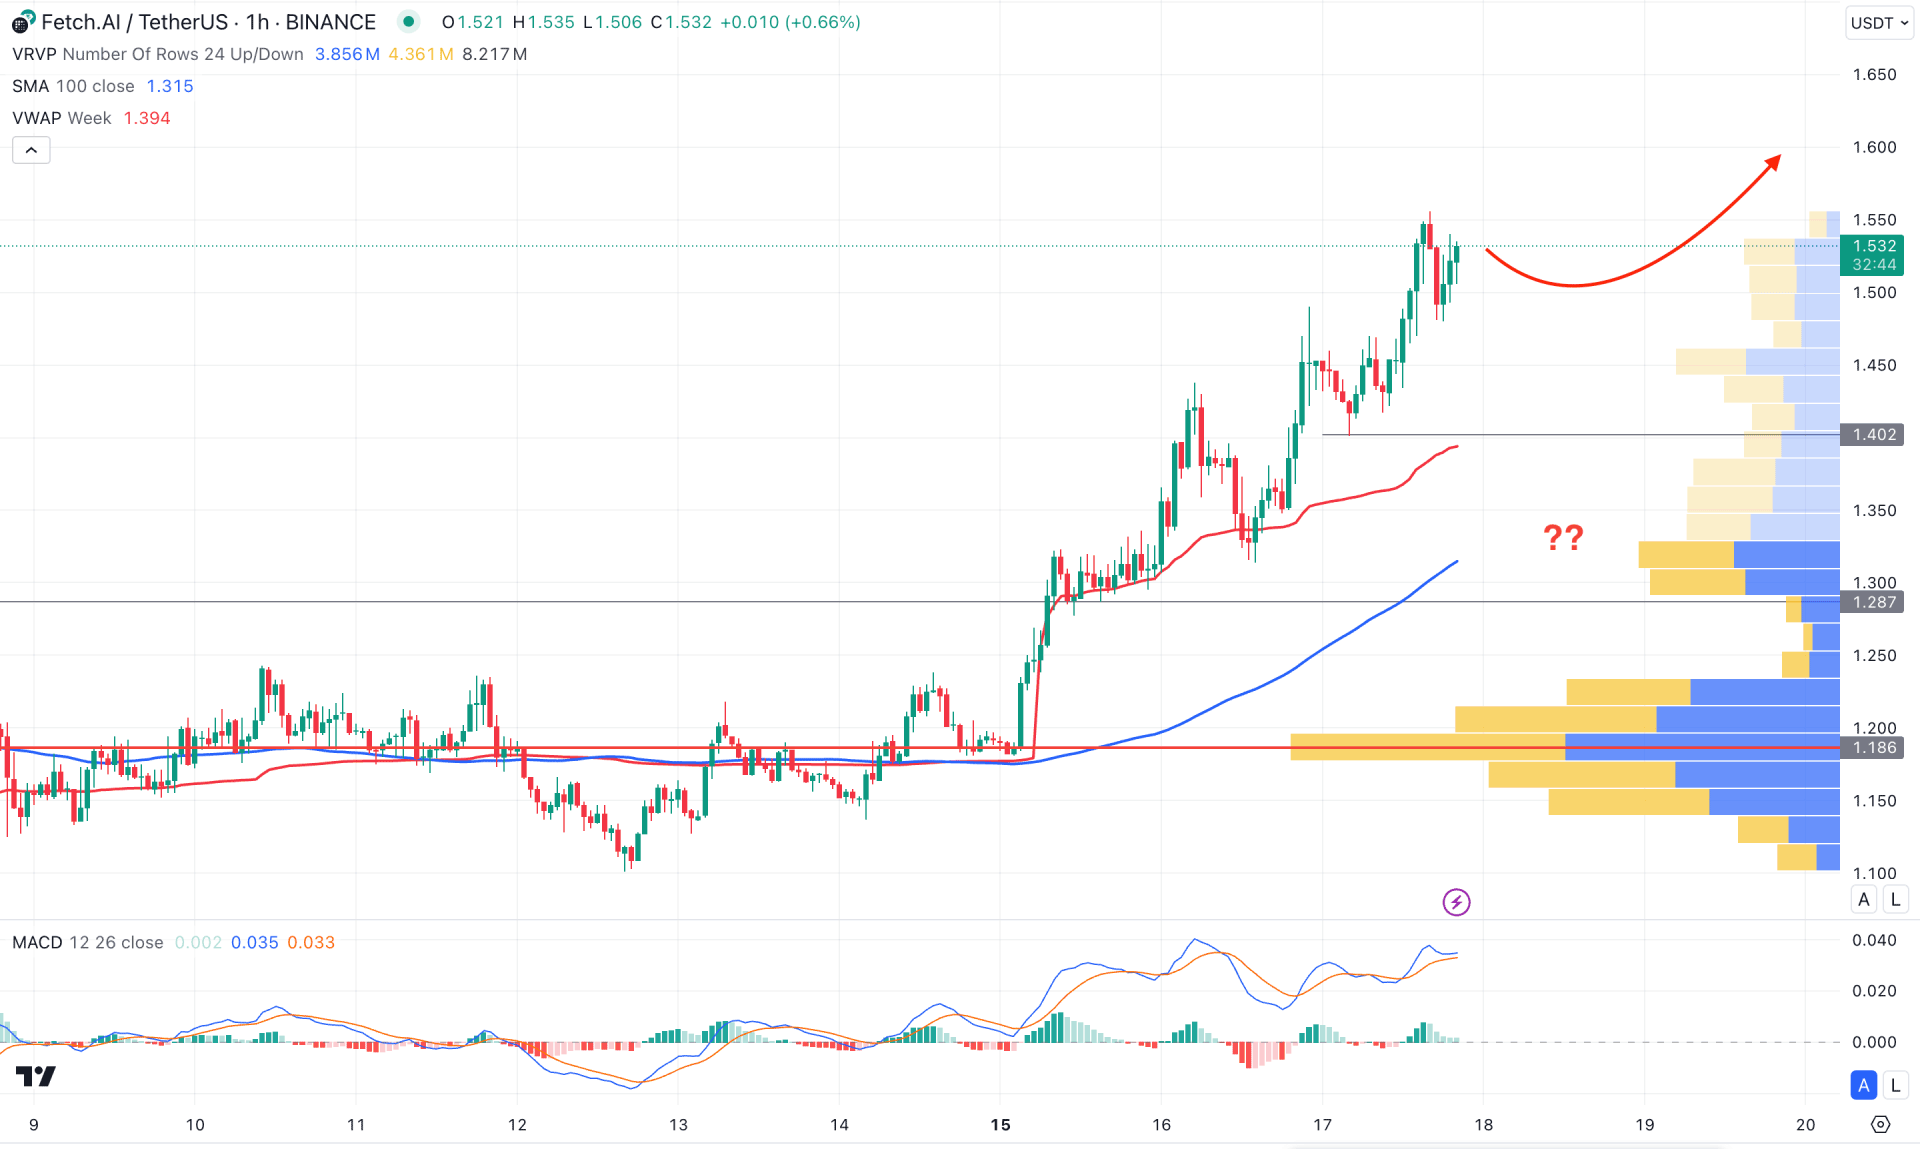
In the hourly chart of FET/USDT, an ongoing bullish continuation is clear, where the recent price trades above the dynamic 100 Simple Moving Average line. Moreover, the visible range high volume line is below the current price, aimed higher, which could signal additional buying pressure.
In the MACD Indicator, the signal line reached the overbought zone, suggesting a potential top formation in the main price.
Based on this outlook, a sufficient downside correction is pending in the main chart, which might lower the price toward the weekly VWAP support level. However, any rebound from the 1.402 to 1.287 zone could resume the existing trend at any time.
Based on the current outlook, FET/USDT is more likely to extend the buying pressure after validating the symmetrical triangle breakout. As the ongoing corrective pressure is within the pattern, we may expect a minor upward surge and test the trendline resistance.


