
Published: March 19th, 2025
Following market close on March 20, FedEx Corporation FDX is scheduled to release its fiscal 2025 third-quarter results, which ended on February 28, 2025.
Over the last 60 days, the analyst's Consensus Estimate for third-quarter fiscal year 2025 profits has decreased 1.7% and is now set at $4.66 per share. However, compared to the real from the previous year, the consensus mark indicates a 20.7% increase. Third-quarter consecutive 2025 revenues are expected to reach $21.88 billion, up 0.8% from the actual for the same period last year.
Due to the post-COVID stabilization of volume and cost trends, FDX is still having difficulties. Especially in Asia and Europe, consumer morale and economic prospects are still being negatively impacted by geopolitical unpredictability and rising inflation. The decline in package volumes probably affected FedEx's earnings in the quarter, which will be reported later.
Demand-induced quantity decline is probably what affected the results of FDX's main section, the Express business. We predict that Express unit revenues will increase by 0.6% over fiscal 2024 third-quarter actuals.
Under the DRIVE company-wide strategy, FedEx is reorganizing its costs in light of the post-COVID business modifications. FDX's cost-cutting initiatives probably helped the company's financial results during the relevant quarter.
These cost-cutting measures include staff reductions, aircraft parking, and frequency reductions. FDX's efforts to keep costs under control despite the ongoing revenue downturn are impressive. We predict that third-quarter fiscal 2025 salary and benefit costs will be 0.8% lower than actual third-quarter fiscal 2024 costs. It is anticipated that modified operating costs in the upcoming quarter will decrease by 0.1% from actuals from the previous year.
Over the last three months, FDX's stock has dropped 11.1% while the industry has decreased 6.5%. Additionally, FDX's pricing record is worse than that of competitor UPS and another industry participant, Air Transport Services ATSG.
Let's see the further outlook of this stock from the FDX technical analysis:
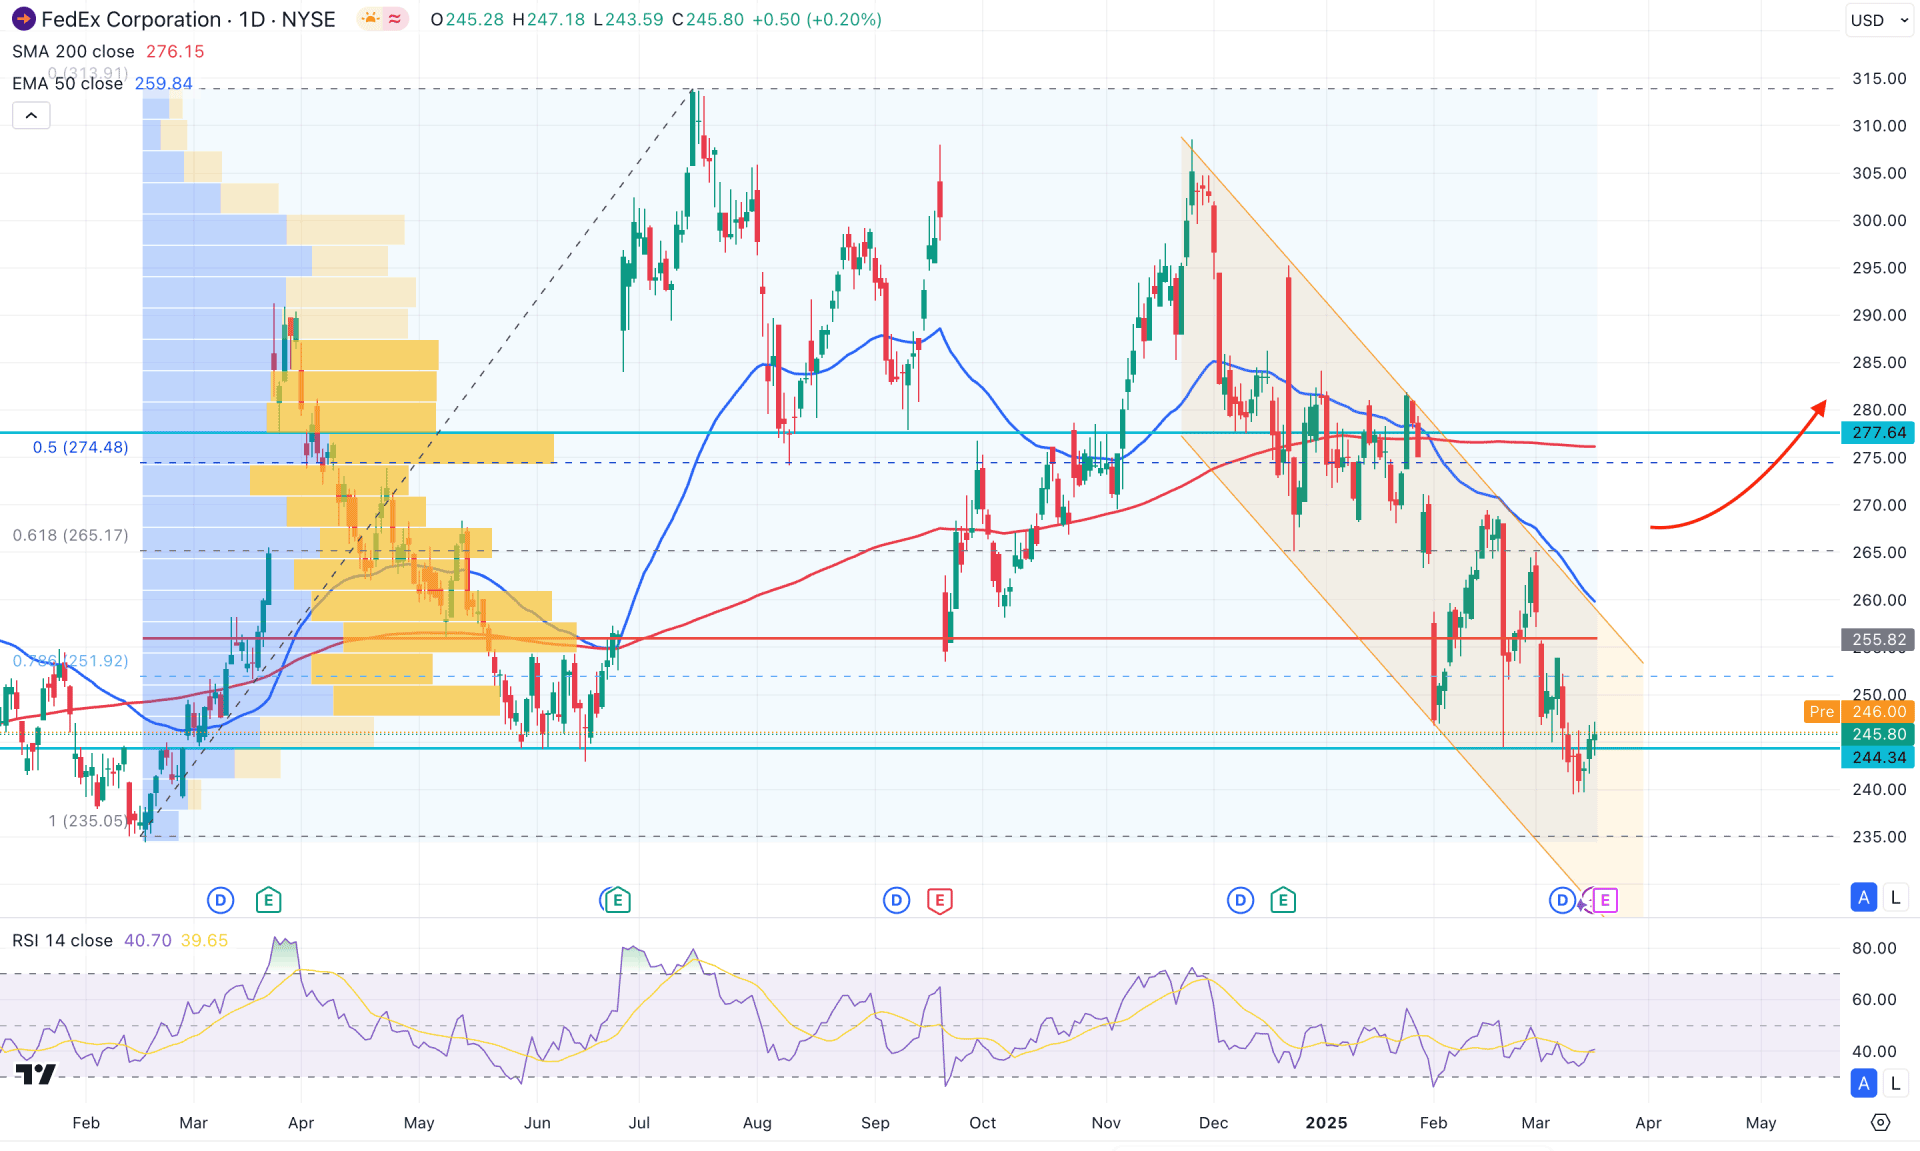
In the daily chart of FedEx stock, a considerable correction is seen after reaching the crucial supply zone created in 2021. As the price reaches the 2025 low, we may expect a bullish recovery after forming a decent reversal on the daily chart.
In the higher timeframe, the monthly chart is trading bearish after showing indecision in February 2025. Still, the price is trading below the February 2025 low with no sign of recovery. In the weekly timeframe, the price tests the crucial weekly support as multiple horizontal levels act as bullish pressure. In this case, a bullish recovery needs validation from the higher timeframe, at least through a clear reversal on the weekly chart with a candle close above the 252.69 level.
In the volume structure, the most active level since March 2024 is at the 255.82 level, which is 3.98% above the current price. Moreover, the price is trading bearish within a descending channel. In this case, a bullish recovery above the high line is likely to occur, which may initiate a trend reversal.
Although the higher timeframe price action is bearish, the price is trading at a crucial discounted zone. If we draw a Fibonacci retracement line from the 235.05 low to the 313.91 high, we will see the 50% level at 274.48. As the current price is hovering below the 50% Fibonacci retracement level, we may expect a bullish recovery after solid price action.
On the other hand, the 200-day Simple Moving Average has crossed below the 50-day Exponential Moving Average, signaling a bearish death cross pattern. As both dynamic lines have a gap with the current price, we may expect a bullish recovery as a mean reversion.
Based on the daily market outlook, the Relative Strength Index is sideways near the 30.00 area, indicating potential bullish sentiment. On the bullish side, a valid bullish reversal recovery above the 255.82 high-volume line with a daily candle above the 50-day Exponential Moving Average would validate the channel breakout, aiming for the 300.00 psychological level.
On the other hand, overcoming the 200-day Simple Moving Average could be a strong bearish signal for this stock. In that case, any valid downside pressure from the 277.64 to the 260.00 area with a daily candle below the 250.00 level could resume the bearish trend, aiming for the 200.00 psychological level.
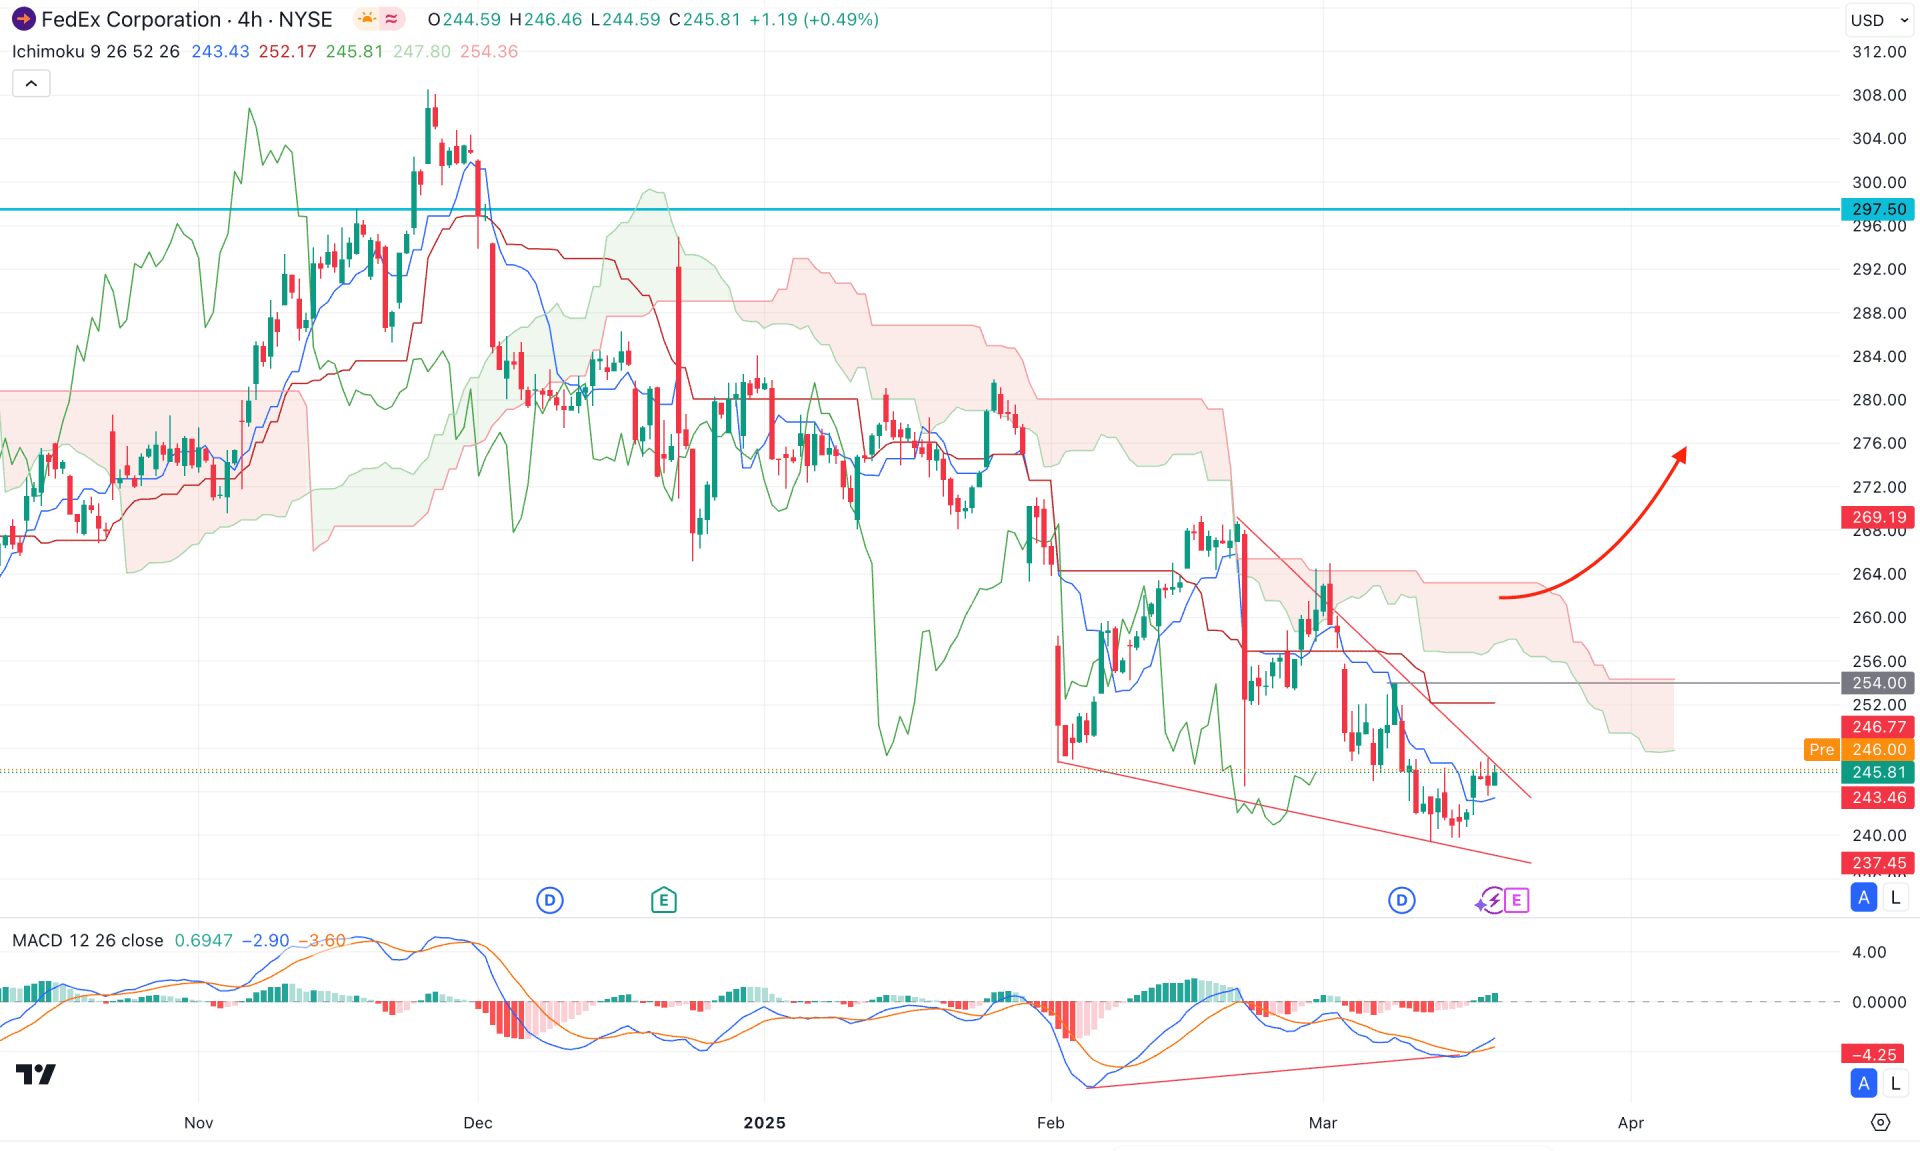
In the four-hour timeframe, the ongoing bearish pressure is visible as the price continues moving lower below the Kumo cloud level. However, the most recent price action shows a flat pattern in the future cloud, followed by a divergence in the MACD signal line. This is a sign of a potential bottom formation but needs validation from proper price action.
Currently, the price is trading between two dynamic lines, indicating indecision. As the resistance is being tested, investors should monitor how the price reacts before anticipating future movement. Primarily, a bullish reversal with valid consolidation above the 254.00 resistance level could present a short-term opportunity, aiming for the 280.00 area.
However, overcoming the cloud resistance is crucial before validating the bullish trend. In that case, a potential bearish reversal from the 254.00 to the 264.00 zone, with a daily candle close below this key level, could resume the existing trend towards the 230.00 area.
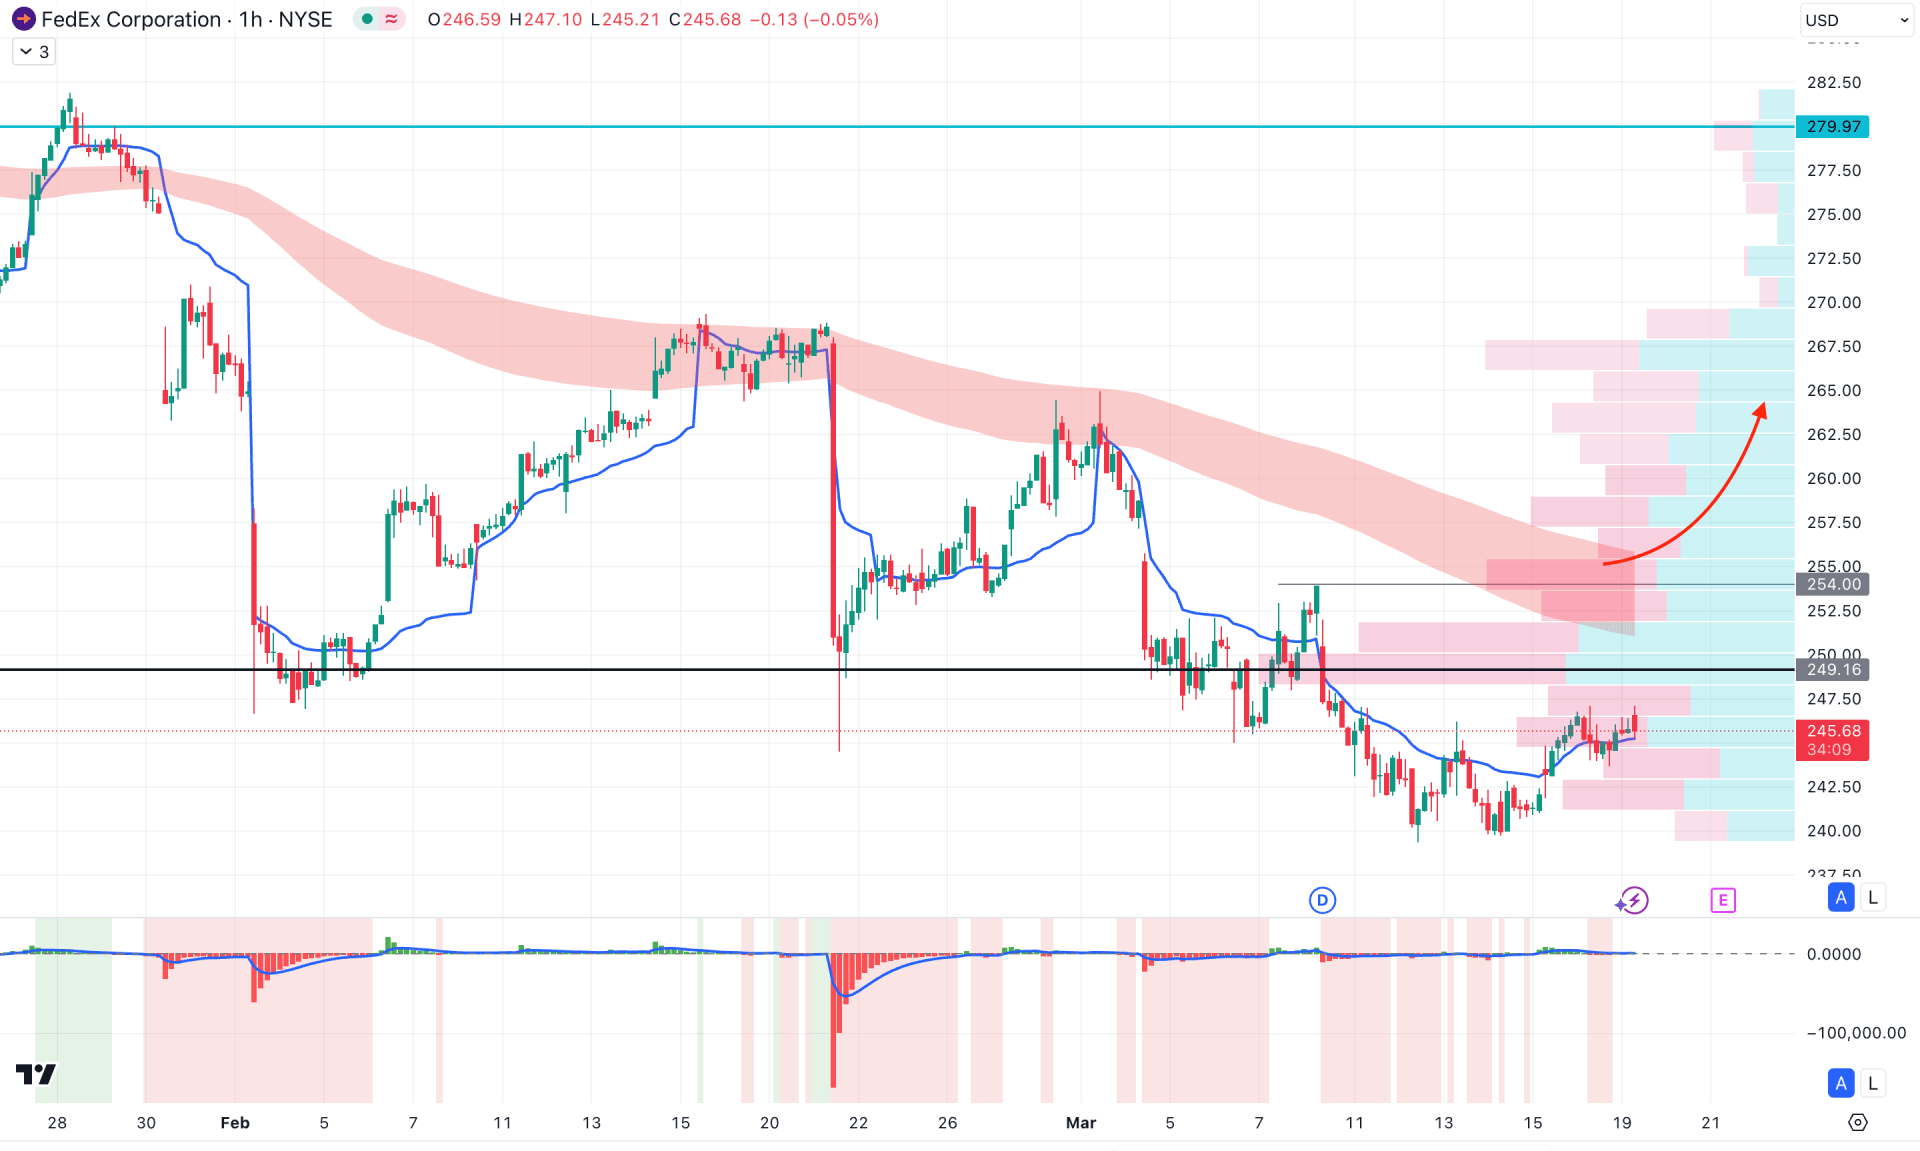
In the hourly time frame, the current price shows ongoing bearish pressure, with the visible range of high volume lines closer to the current price. The recent price action is trading sideways, which signals potential recovery. This sideways market momentum could be a good sign for a reversal after forming a trendline breakout.
On the other hand, the market volume is slower at the current price area, signalling a possible transformation. In this case, a sideways market with bearish pressure towards the 254.00 area could signal potential bearish pressure after a bearish hourly candle closes below the weekly VWAP line. The alternative approach is to look for counter-bullish pressure with a stable market above the 254.00 level, which may increase the likelihood of a bullish move above the 279.59 level.
Based on the current multi-timeframe analysis, FedEx stock has a higher possibility of continuing to rise, following the major market trend, once the price pattern is validated by a breakout. In the near term, investors might see it as a short-term opportunity to open a short position, but a possible bullish breakout from the current level could invalidate this and follow the major market trend at any time.


