
Published: September 16th, 2025
As per analysts, FedEx could provide around $21.2 billion and $22.2 billion in sales for the first quarter, with an average projection of $21.7 billion. This indicates a 0.4% increase in revenue from the previous year. It is anticipated that earnings per share will range from $3.50 to $3.86, with an average of $3.64, signifying a 1.2% increase.
FedEx has a checkered record when it comes to exceeding analyst forecasts. The company has missed forecasts four times in the last twelve quarters, including twice in the last four. The company has failed sales projections nine times out of twelve quarters, but it has missed expectations twice in the four most recent quarters and exceeded them in the last two.
While the top end of the scale expects sustained resilience in US domestic sales trends, the impact on US domestic consumer demand should be monitored. The projection includes a $170 million obstacle from international trade policies and a $120 million challenge from the end of the United States Postal Service contract.
Let's see the upcoming price direction from the FDX multi-timeframe analysis:
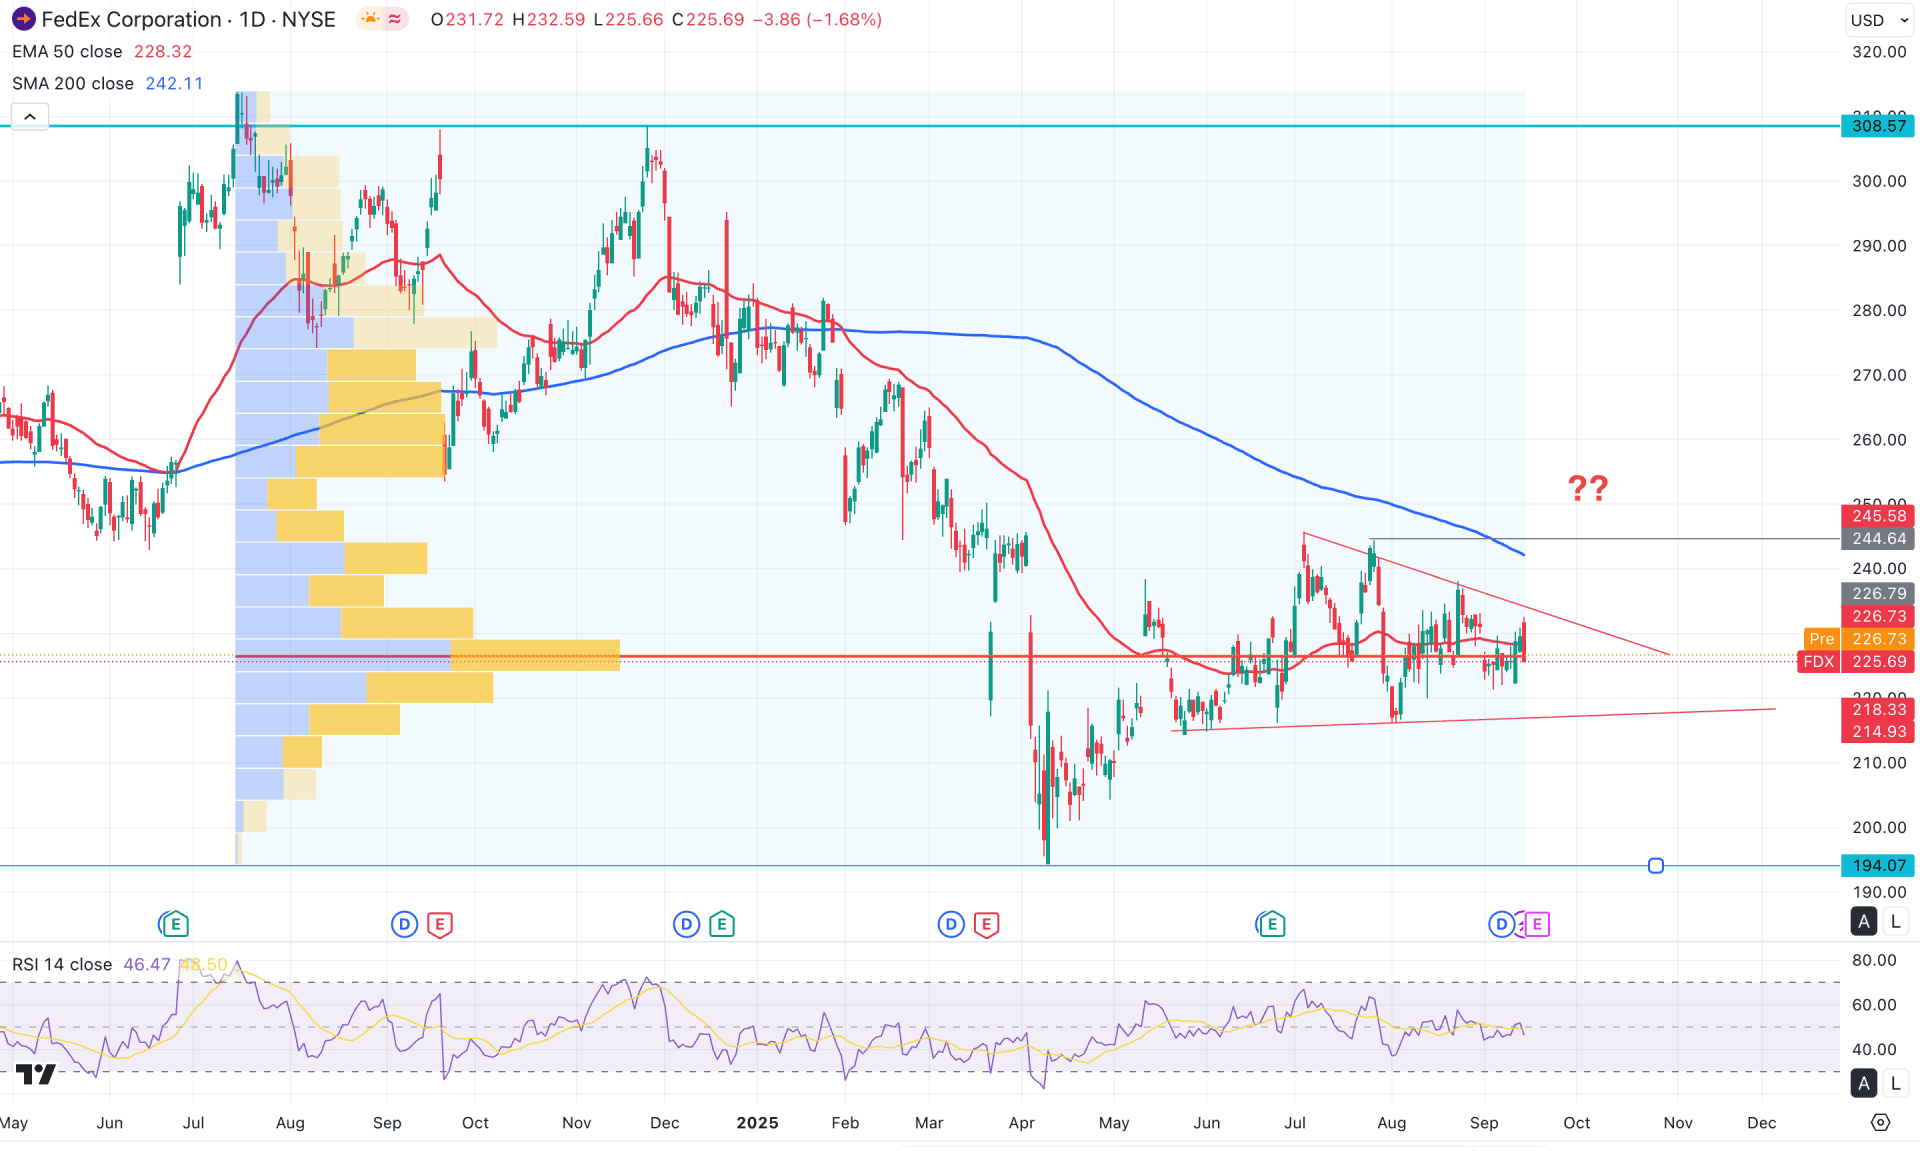
On the daily chart of FedEx stock, the price is trading sideways within a symmetrical triangle after a massive rally from 308.57 to 219.47. As the price shows no significant buying pressure and remains in the discounted zone, a downward continuation is primarily expected.
Although the near-term direction is sideways, the major market trend remains bullish, as the monthly candle suggests a continuation pattern supported by a trendline initiated in 2020. However, the last six months have shown sideways movement following a sharp bearish drop in April 2025. As long as the price trades within April's candle body, the downside momentum may extend.
The weekly timeframe shows a similar structure, with no significant buying pressure visible. The most recent price action faces weekly trendline resistance, followed by the 200-week simple moving average, signalling a potential bearish pre-breakout structure.
On the daily chart, the volume structure indicates an accumulation phase, with the highest activity level since July 2024 near the current price. A breakout above this high-volume area, supported by valid price action, could trigger a strong trending opportunity.
Currently, the 200-day SMA acts as the major resistance above the symmetrical triangle, while price movement remains slow. Meanwhile, the 50-day EMA is still flat, suggesting no clear directional bias. Since the 50-day EMA is below the 200-day EMA, a potential death cross continuation remains in play.
The Relative Strength Index (RSI) is also neutral, hovering around the 50.00 line for an extended period.
The Average Directional Index (ADX) has stayed below the 20.00 level since May 2025, signalling a lack of trend strength. However, if the ADX rises above 20.00 in combination with a triangle breakout on the main chart, it could present a strong trading opportunity.
Based on the current market structure, selling pressure from the falling trendline resistance signals an immediate bearish opportunity targeting 216.10. A break below 216.10 could extend losses toward the 194.07 support level.
Alternatively, a bullish scenario would emerge if the price breaks above the triangle resistance with daily candle confirmation around 245.00. A sustained move above the 200-day SMA could open a long opportunity targeting the 300.00 psychological level.
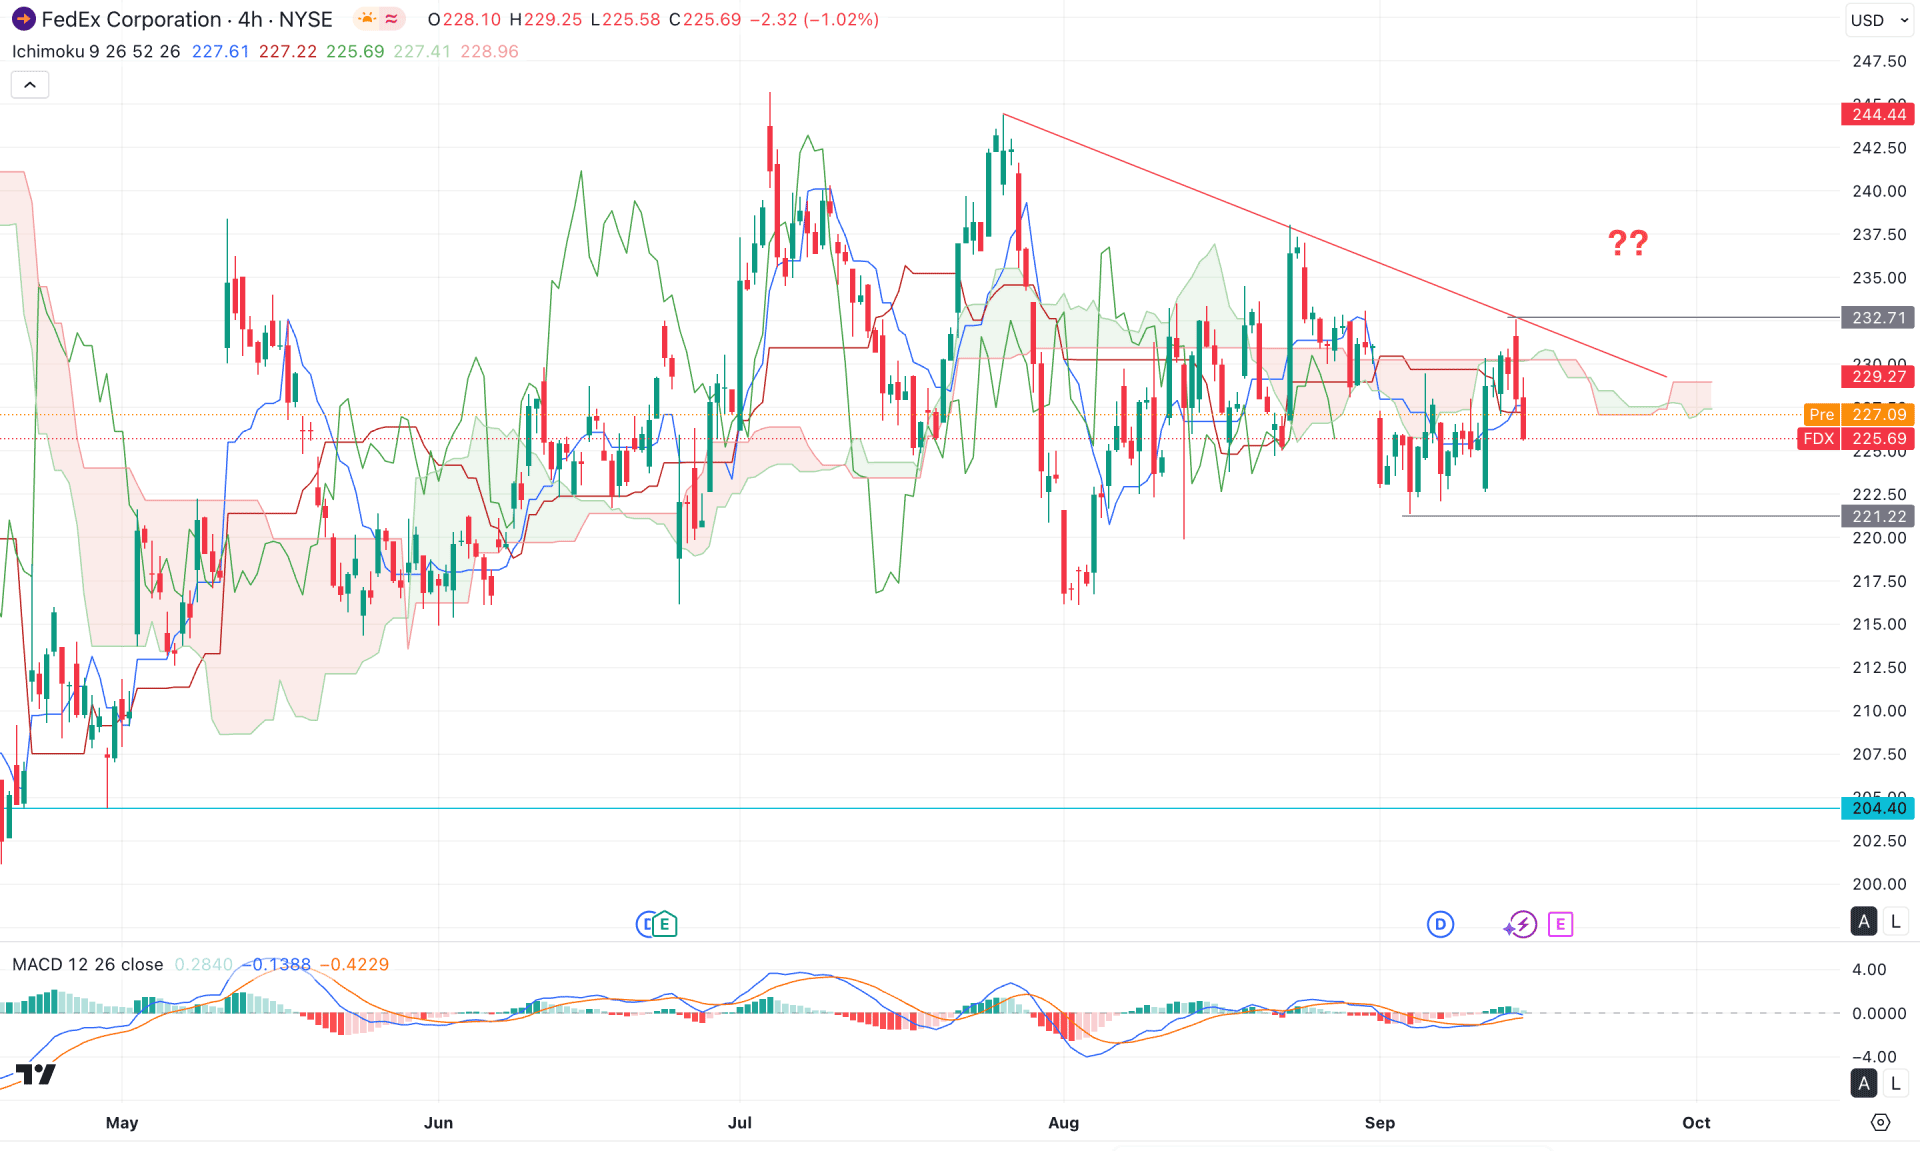
In the H4 timeframe, a sideways momentum is visible as multiple violations are present from the Ichimoku Kumo Cloud area. Moreover, the Future Cloud is corrective, with no clear trend direction.
In the secondary indicator window, the MACD Histogram aimed lower but was still hovering above the neutral 0.0 line. Moreover, the Signal line has failed to hold the downward pressure as it formed a valid bullish crossover.
Based on this outlook, the upcoming trend trading opportunity is a valid range breakout from the current price area. As the price is trading within the cloud area, a bearish break below the 221.00 support level could be a highly probable short opportunity.
On the other hand, a bullish break above the cloud level is needed before opening a long opportunity. In that case, a consolidation is needed after having a new swing above the 237.10 level before aiming for the 300.00 psychological level.
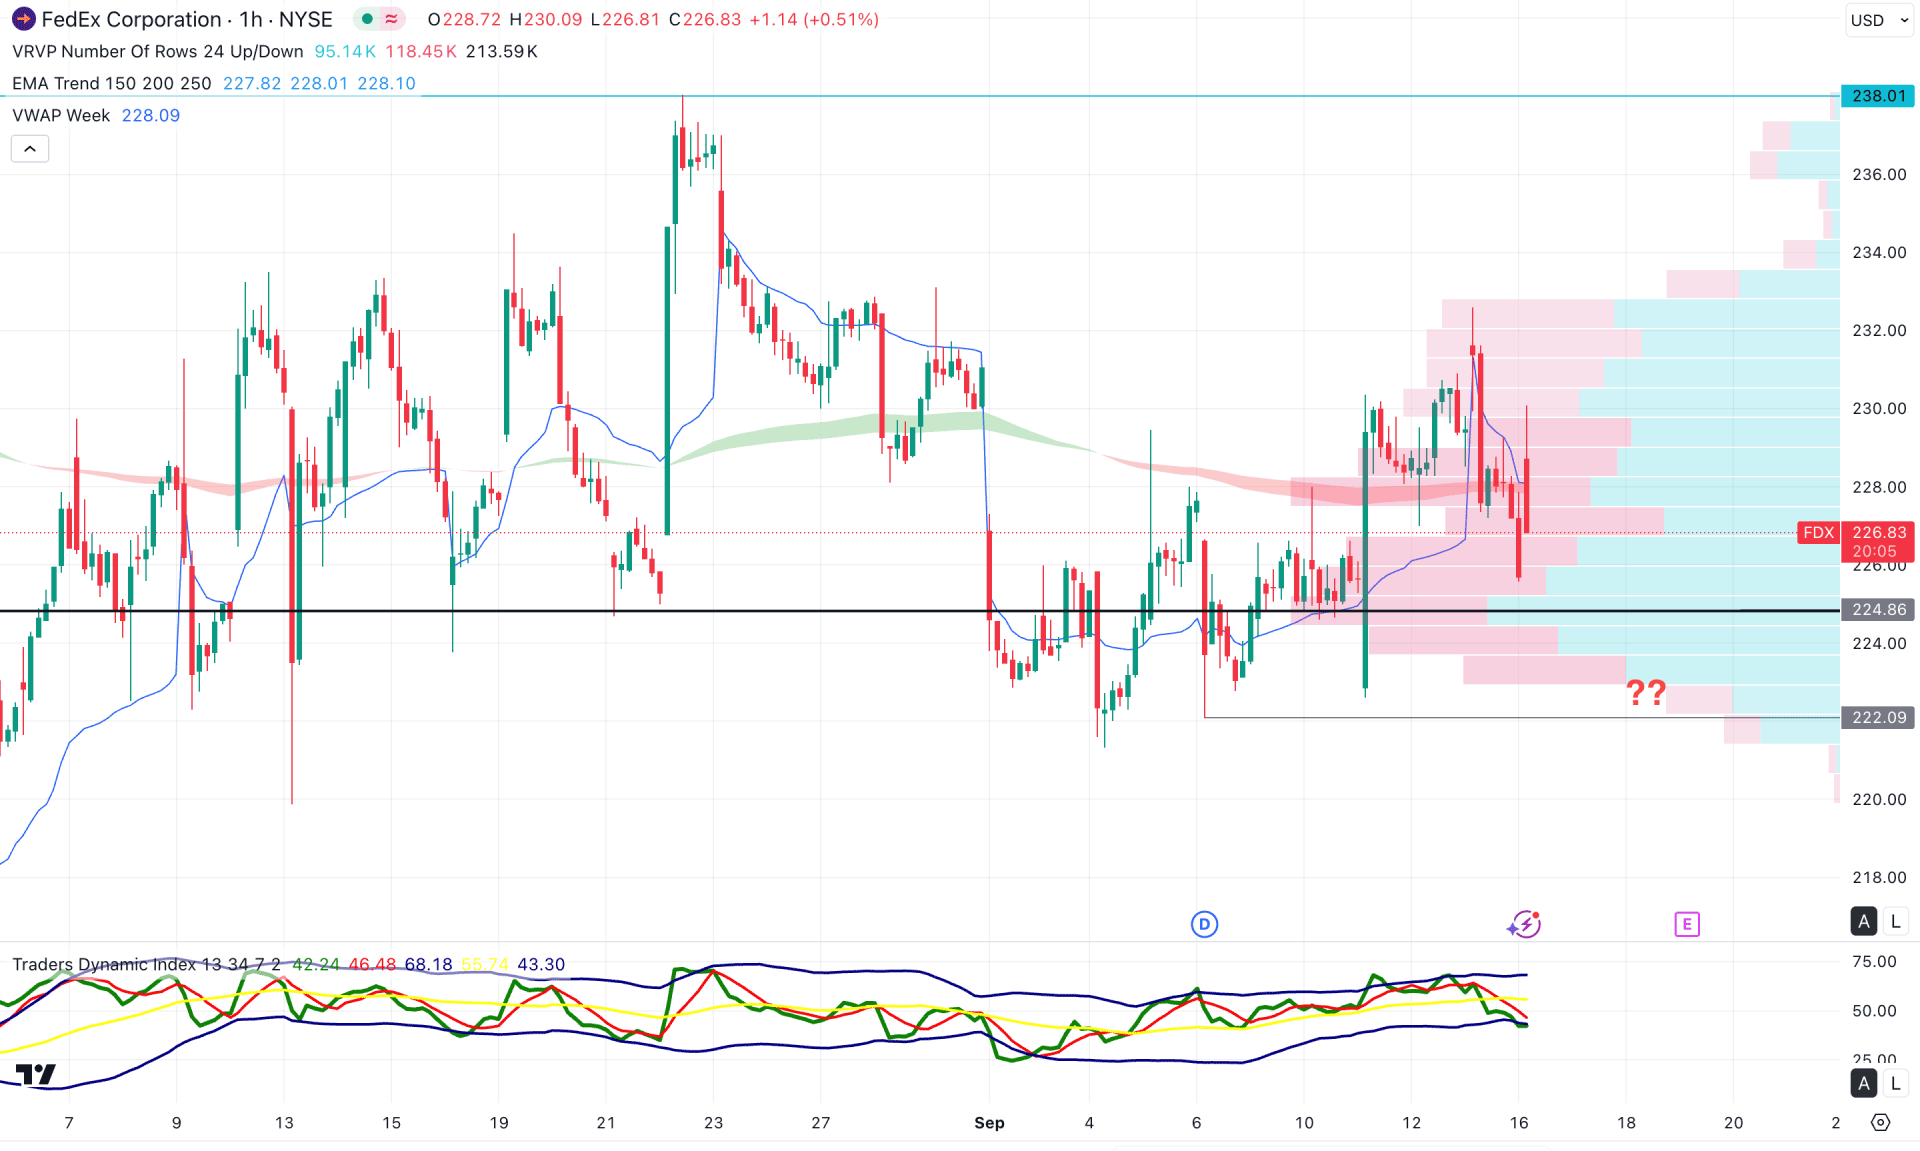
In the hourly timeframe, the volatile market structure is present, where multiple violations are visible at the Exponential Moving Average wave area. Moreover, the weekly VWAP shows the same structure, where the current line is hovering above the current price.
In the secondary indicator window, the Traders Dynamic Index (TDI) has reached the bearish zone where the current line is below the 50.00 line.
Based on this outlook, the downside pressure needs validation from the high-volume breakout. A bearish hourly candle below the 224.36 level could be a short opportunity, where the main aim would be to test the 218.00 level.
The alternative trading approach is to wait for a bullish break above the WVAP level with a consolidation above it.
Based on the overall market outlook, the FDX is trading at the discounted zone from where no valid bottom is visible. It is a sign of additional downside pressure before following the long-term bullish trend. As the daily price is trading sideways, a valid break below the trendline support could create a bottom soon.


