Published: March 29th, 2023
Fantom is a decentralized finance (DeFi) application development platform prioritizing security and scalability. It solves the problem of sluggish transaction speeds on older blockchain platforms that employ smart contracts.
The development of the open-source platform is the responsibility of the Fantom Foundation, which was established in 2018 by the South Korean computer scientist Ahn Byung Ik. Under the direction of CEO and CIO Michael Kong, the team consists of engineers, scientists, and designers with extensive experience in full-stack blockchain development.
Fantom utilizes the consensus mechanism Lachesis to enable smart contracts. The company asserts that Lachesis, an Asynchronous Byzantine Fault Tolerance (aBFT) consensus protocol, is faster and more cost-effective than earlier technologies. Also, it can maintain a high level of security.
The Opera FTM token runs on the Fantom mainnet, the ERC-20 FTM token runs on the Ethereum blockchain, and the BEP-2 FTM token runs on the Binance Chain and facilitates transactions on the Binance decentralized exchange (DEX).
The native token of the platform FTM has two primary uses: staking and voting on the future of the network. Holders can stake FTM, and they can also vote on platform-development-related decisions.
Let’s see the upcoming price direction of the Fantom token from the FTM/USDT technical analysis:
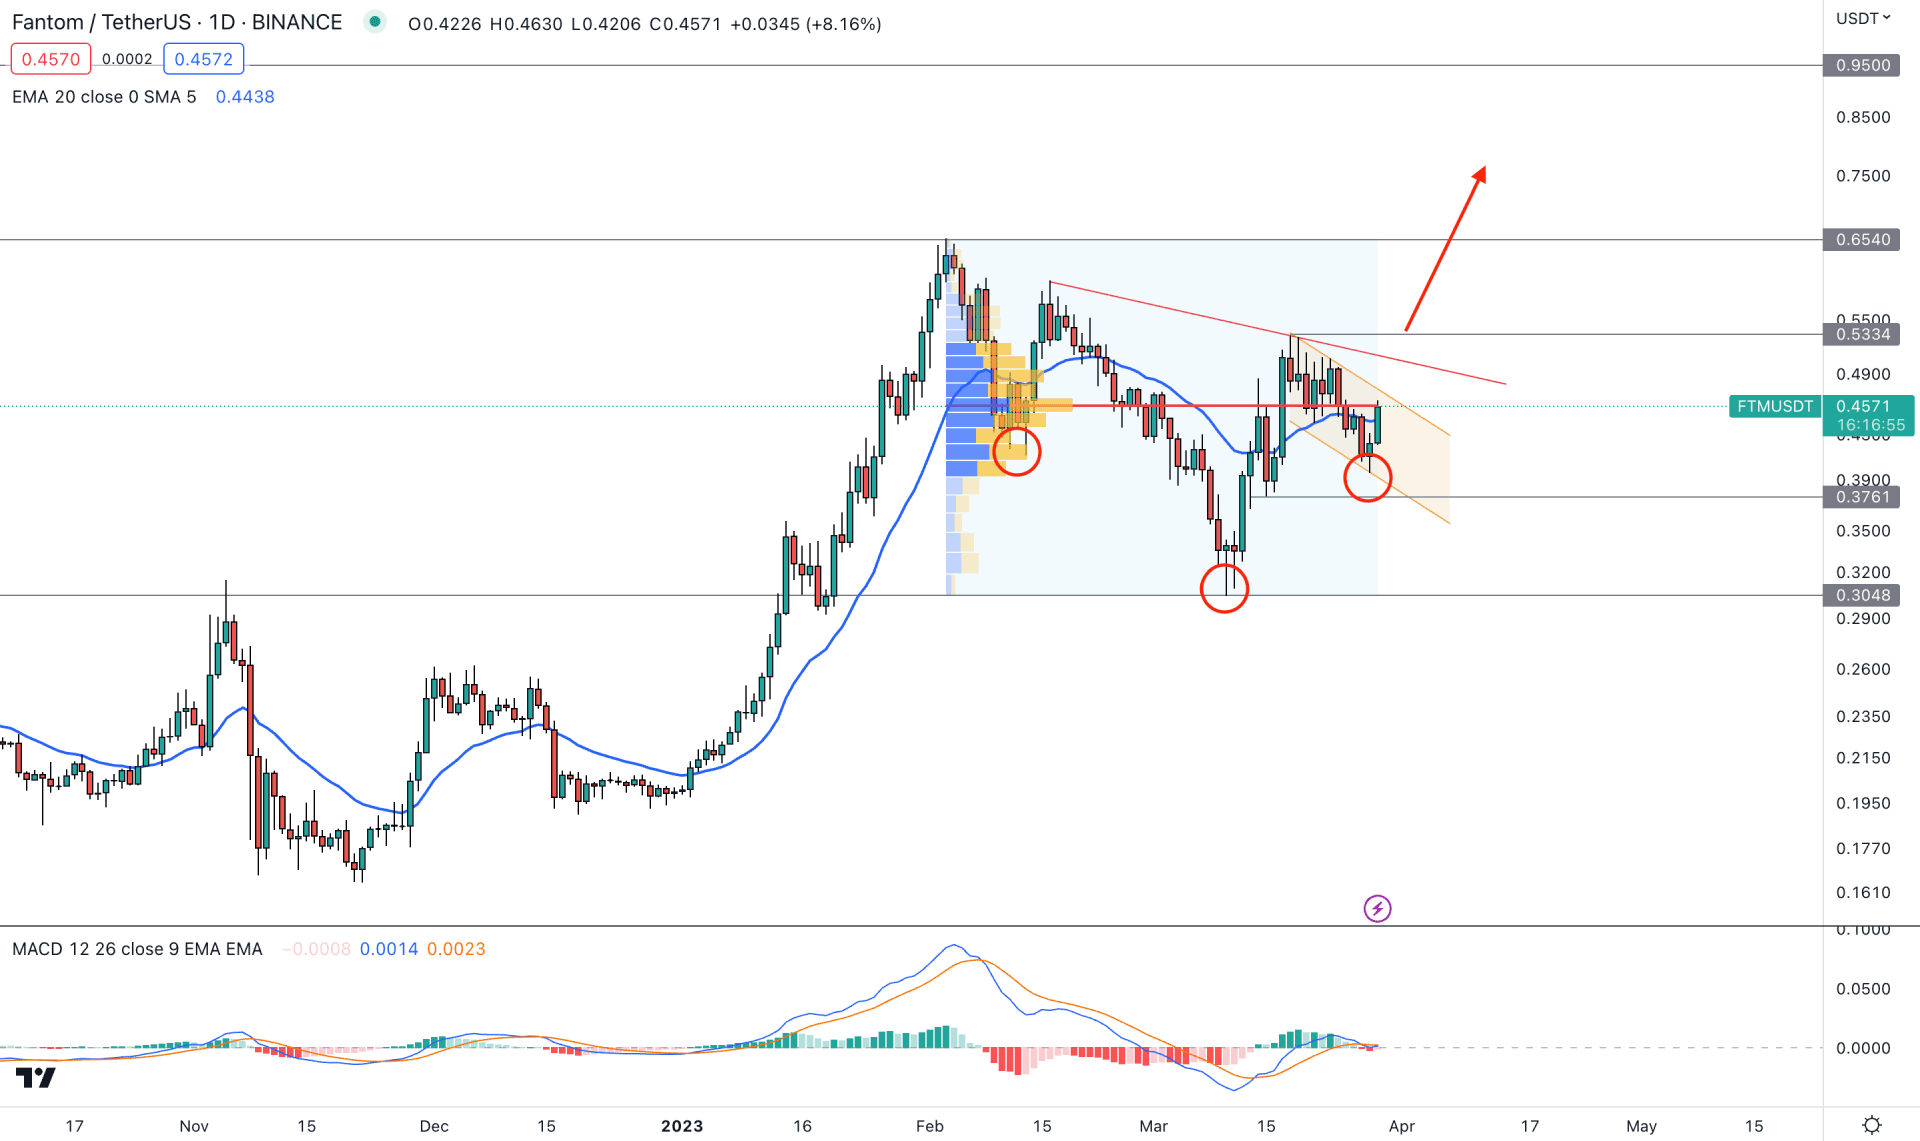
The FTM price is trading within a strong bullish trend, as shown in the monthly and weekly candles. Therefore, the primary trading idea for this instrument is to look for long opportunities based on the market behavior on the daily or intraday charts.
In the daily price, a strong bullish impulsive leg is visible from the December 2022 low, which ended at 0.6540 level with more than 240% gain. Later on, a significant downside correction is seen below the 50% Fibonacci Retracement level, which was ended with a bullish recovery and internal structure break.
The sideways market since February 2023 indicates a possible “Inverse Head and Shoulders” formation. If the current price continues moving higher and form a daily candle above the 0.5334 swing high, it will validate the pattern with an opportunity to reach at least the 0.6540 high.
In the main chart, a corrective momentum is seen from the descending channel formation, where the current dynamic 20-day EMA is closer to the price. In that case, an extension to the channel is possible, but buying possibility would be valid after a proper breakout.
An early sign of the bullish breakout in the indicator window is seen as dynamic EMA’s formed a bullish crossover. Although the Histogram is at a neutral line, a shift of EMA’s above the positive zone would indicate the beginning of a bullish trend.
Based on the daily price prediction of FTM/USDT, the broader outlook is corrective, but the existing bullish trend could resume after a valid “Inverse Head and Shoulders” pattern breakout.
On the other hand, a downside pressure below the 0.3761 support level could eliminate the current buying possibility, which can lower the price toward the 0.3048 support level.
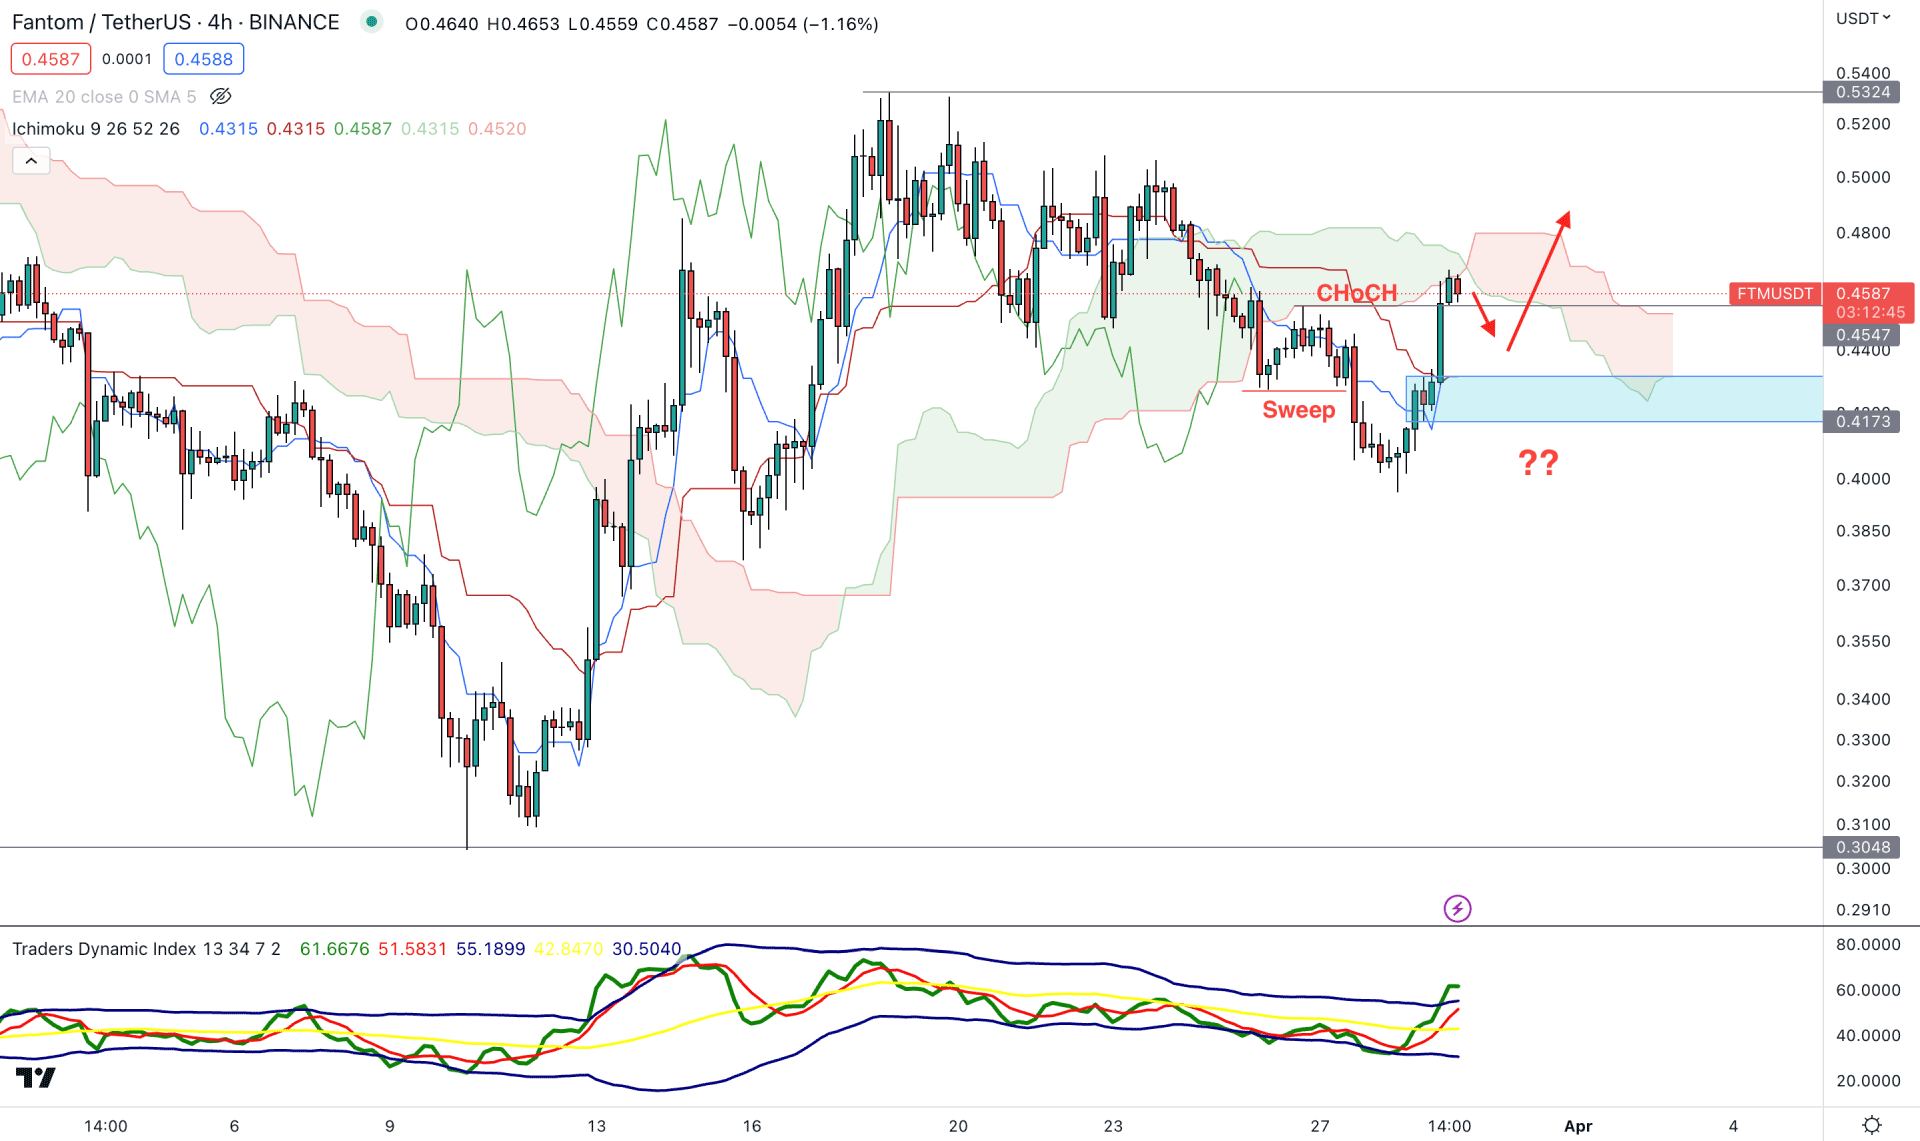
In the H4 timeframe, the market outlook is bullish even if the recent price showed a bearish pressure below the dynamic Kumo Cloud.
A downside pressure is seen from the 0.5324 swing high that pushed the price below the cloud support. However, an internal swing formation with a liquidity sweep with a bullish change of character showed a sign of reversal. Moreover, the 0.4315 to 0.4173 area came as a valid order block. Therefore, if the price comes towards the order block and forms a bullish rejection candlestick, it might open a long opportunity, targeting the 0.5400 level.
In the indicator window, the TDI shows buyers' presence in the market as the current level is above the neutral 50.00 level. Moreover, dynamic Tenkan Sen and Kijun Sen are below the current price and working as a confluence support at the demand zone.
Based on this structure, the bullish possibility is valid as long as the price trades above the 0.4173 swing low. In that case, the upside possibility is open, targeting the 0.5400 key psychological level. However, breaking below the 0.4100 level with a bearish H4 candle might invalidate the current bullish bias and lower the price in the coming hours.
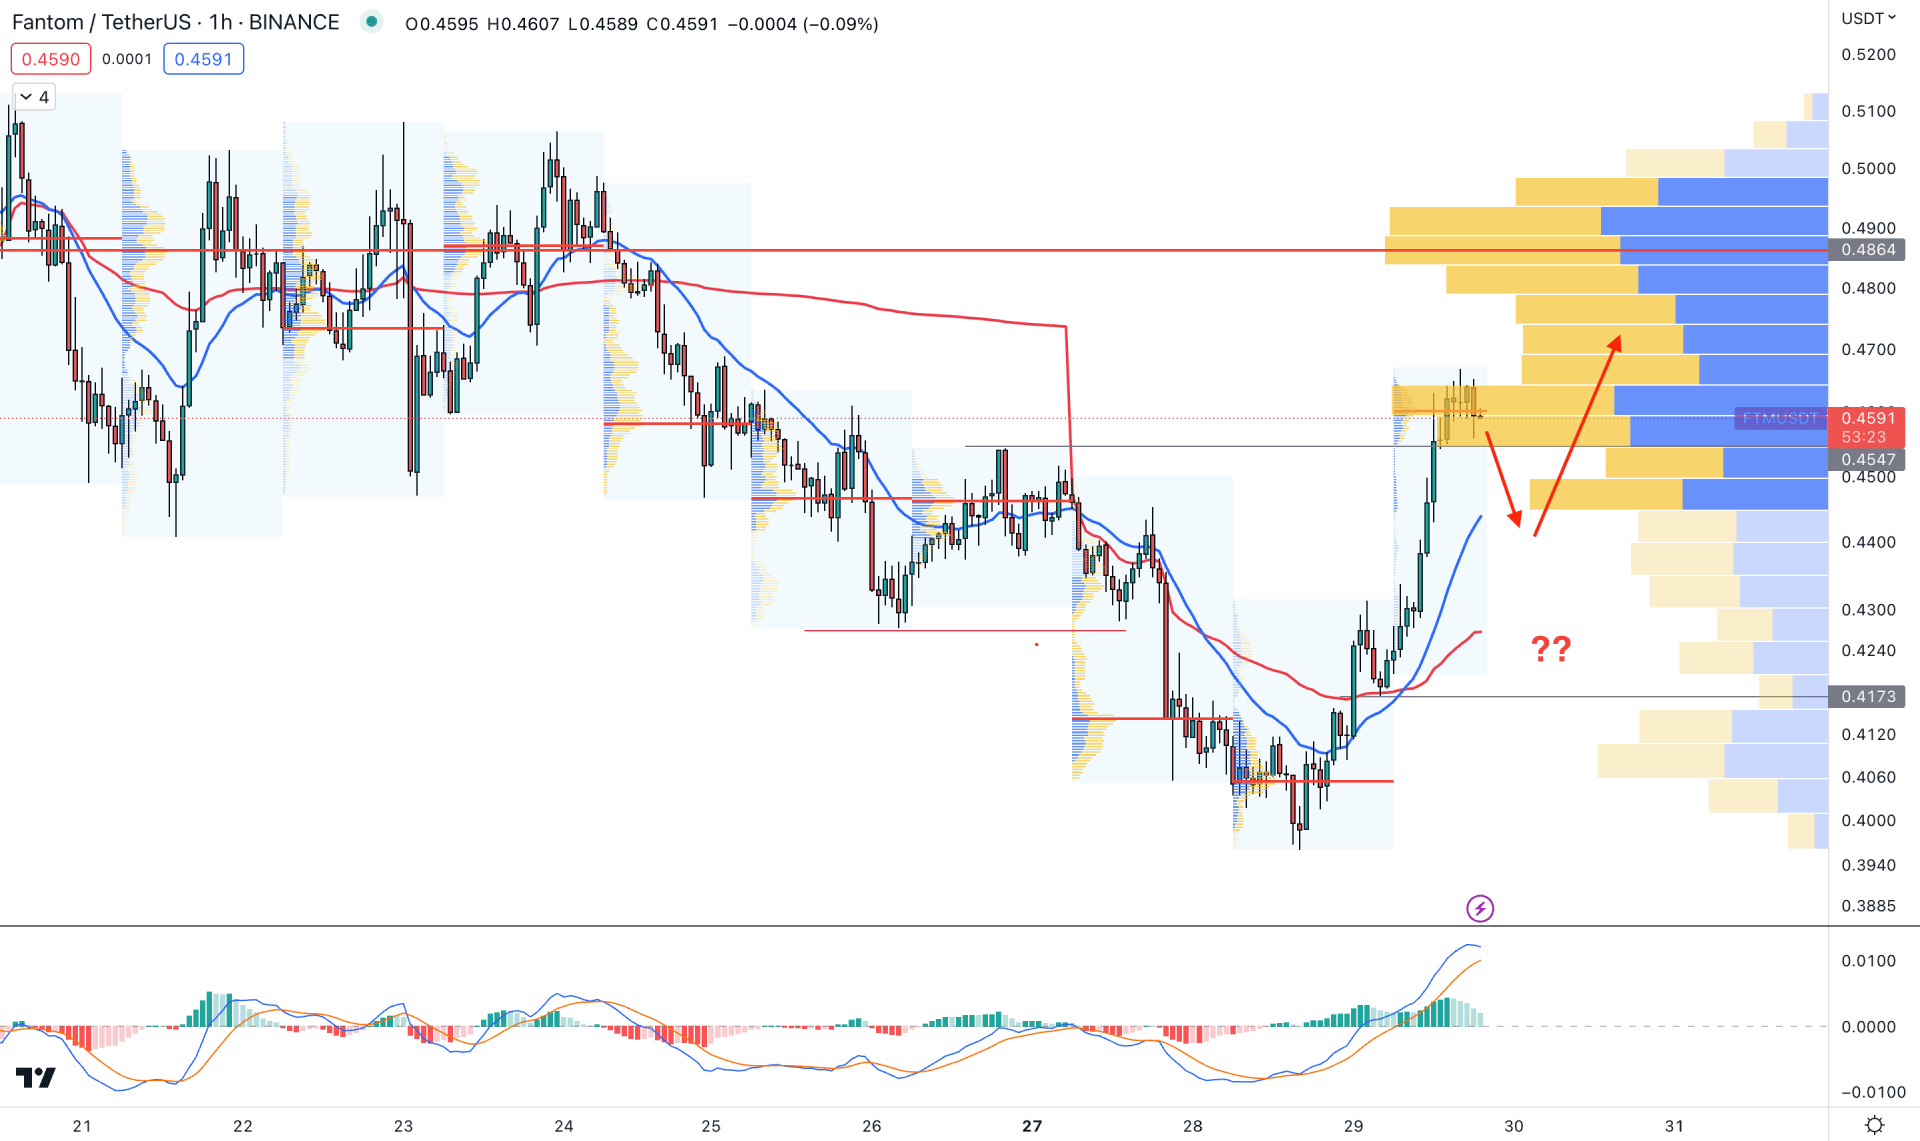
In the hourly chart, the broader market outlook is corrective. After breaking above the 0.4547 swing high, the price went volatile and made a new intraday high volume level. It is a sign that bulls are struggling to hold the price above the swing level while some downside correction is pending from the imbalance left at the MA crossover area.
On the other hand, the visible range high volume level is above the current price, which is also signalling a possible bearish correction.
Based on this structure, investors might face downside pressure if the hourly candle comes below the 0.4547 level. However, the bullish trend continuation opportunity needs to take over the 0.4864 level, before aiming for the 0.5500 level.
Based on the current multi-timeframe analysis, FTM/USDT needs a push from bulls to validate the price breakout before forming a long impulsive leg. Investors should monitor the intraday price to join bullish rally as early as possible.


