
Published: January 27th, 2026
After the market closes on Tuesday, application security provider F5 (FFIV) will release its profits. Last quarter, F5 reported sales of $810.1 million, increasing 8.5% year over year, above analysts' revenue projections by 2%.
The company had a sluggish quarter; both the full-year EPS projection and the revenue guidance for the upcoming quarter fell well short of analyst expectations.
Analysts predict that F5's revenue will drop 1.4% year over year to $755.7 million this quarter, reversing the 10.7% increase it saw in the corresponding quarter last year. It is anticipated that adjusted earnings will be $3.65 per share.
The growing need for hybrid multicloud infrastructure is probably what helped FFIV's product line performance in the initial quarter of the fiscal year. The software subsegment is anticipated to have profited from FFIV's variable consumption program, which allows clients to incorporate extra modules and attachments into the current footprint.
In the initial quarter of fiscal 2026, the structures of the sub-segment's sales are expected to be driven by strong systems refresh opportunities during the ongoing transition of FFIV's older technologies, such as VIPRION and iSeries offerings. Beyond tech update, FFIV also gains from growing systems demand for use cases related to the sovereignty of data and AI preparedness.
Strong renewal rates, increased multi-year contracts, rising platform acceptance, and rising Distributed Cloud Services usage among large business clients have all helped to strengthen the whole product group.
Let's see the further outlook from the FFIV technical outlook:
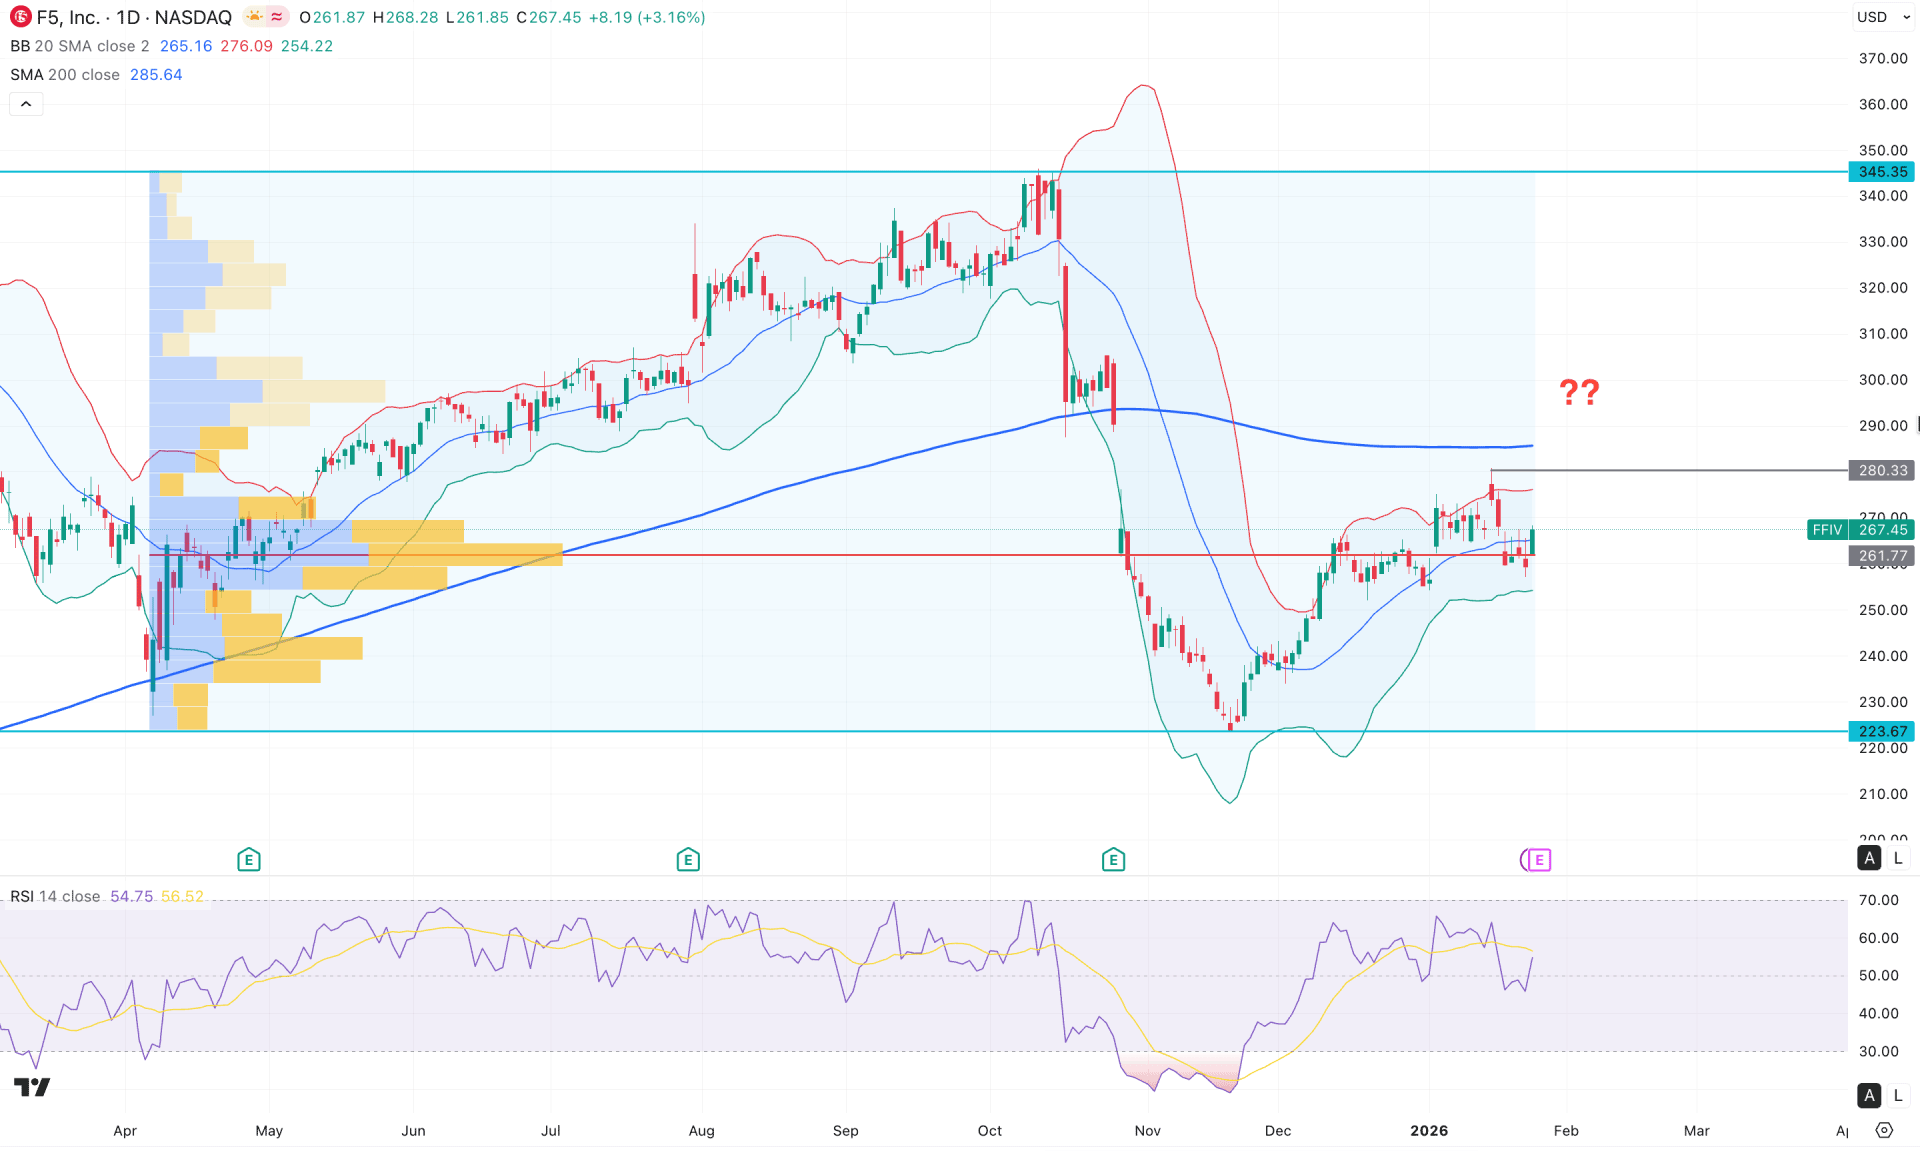
On the daily chart of FFIV, the recent price action shows a strong bearish reversal from the 345.35 top. As the price is currently moving sideways after the decline, a solid pullback is needed before anticipating a bullish continuation.
On the higher timeframe, the price has reached the discounted zone formed by strong selling pressure since October 2025. The monthly candle has formed a two-bar reversal at the bottom, accompanied by a new swing-high formation. This signals a potential bullish continuation opportunity, although further confirmation from lower timeframes is required. Meanwhile, the weekly timeframe remains sideways after posting a new swing high above the 266.67 level, indicating a possible breakout from the ranging market.
From a volume perspective, the highest activity level since April 2025 is close to the current price. Within a ranging market, this suggests an order-building phase, from which a massive breakout followed by a solid retest could present a trend-trading opportunity.
On the main price chart, both the upper and lower Bollinger Bands have flattened, signaling a low-volatility, range-bound market. Multiple rejections have been observed near the high-volume level at 261.77. The 200-day SMA is acting as strong resistance above the 280.33 level, which must be breached to validate any bullish scenario.
In the secondary indicator, the Relative Strength Index (RSI) has rebounded from the 50.00 neutral level, with room to test the potential overbought zone near 70.00.
Based on the overall market structure, investors should closely monitor how price reacts around the high-volume level. Currently, a bullish daily candle has formed above the middle Bollinger Band, increasing the probability of a test of the 280.33 resistance level. However, any immediate bearish rebound with a daily close below the 260.00 level could present a potential short opportunity, targeting the 223.67 support zone.
On the other hand, an extended hold above the 261.77 high-volume level, followed by a bullish swing high above 280.33, could open the door for a move toward the 345.35 level. In that case, a sustained move above the 280.33 level would be required before anticipating further upside toward the 360.00 area.
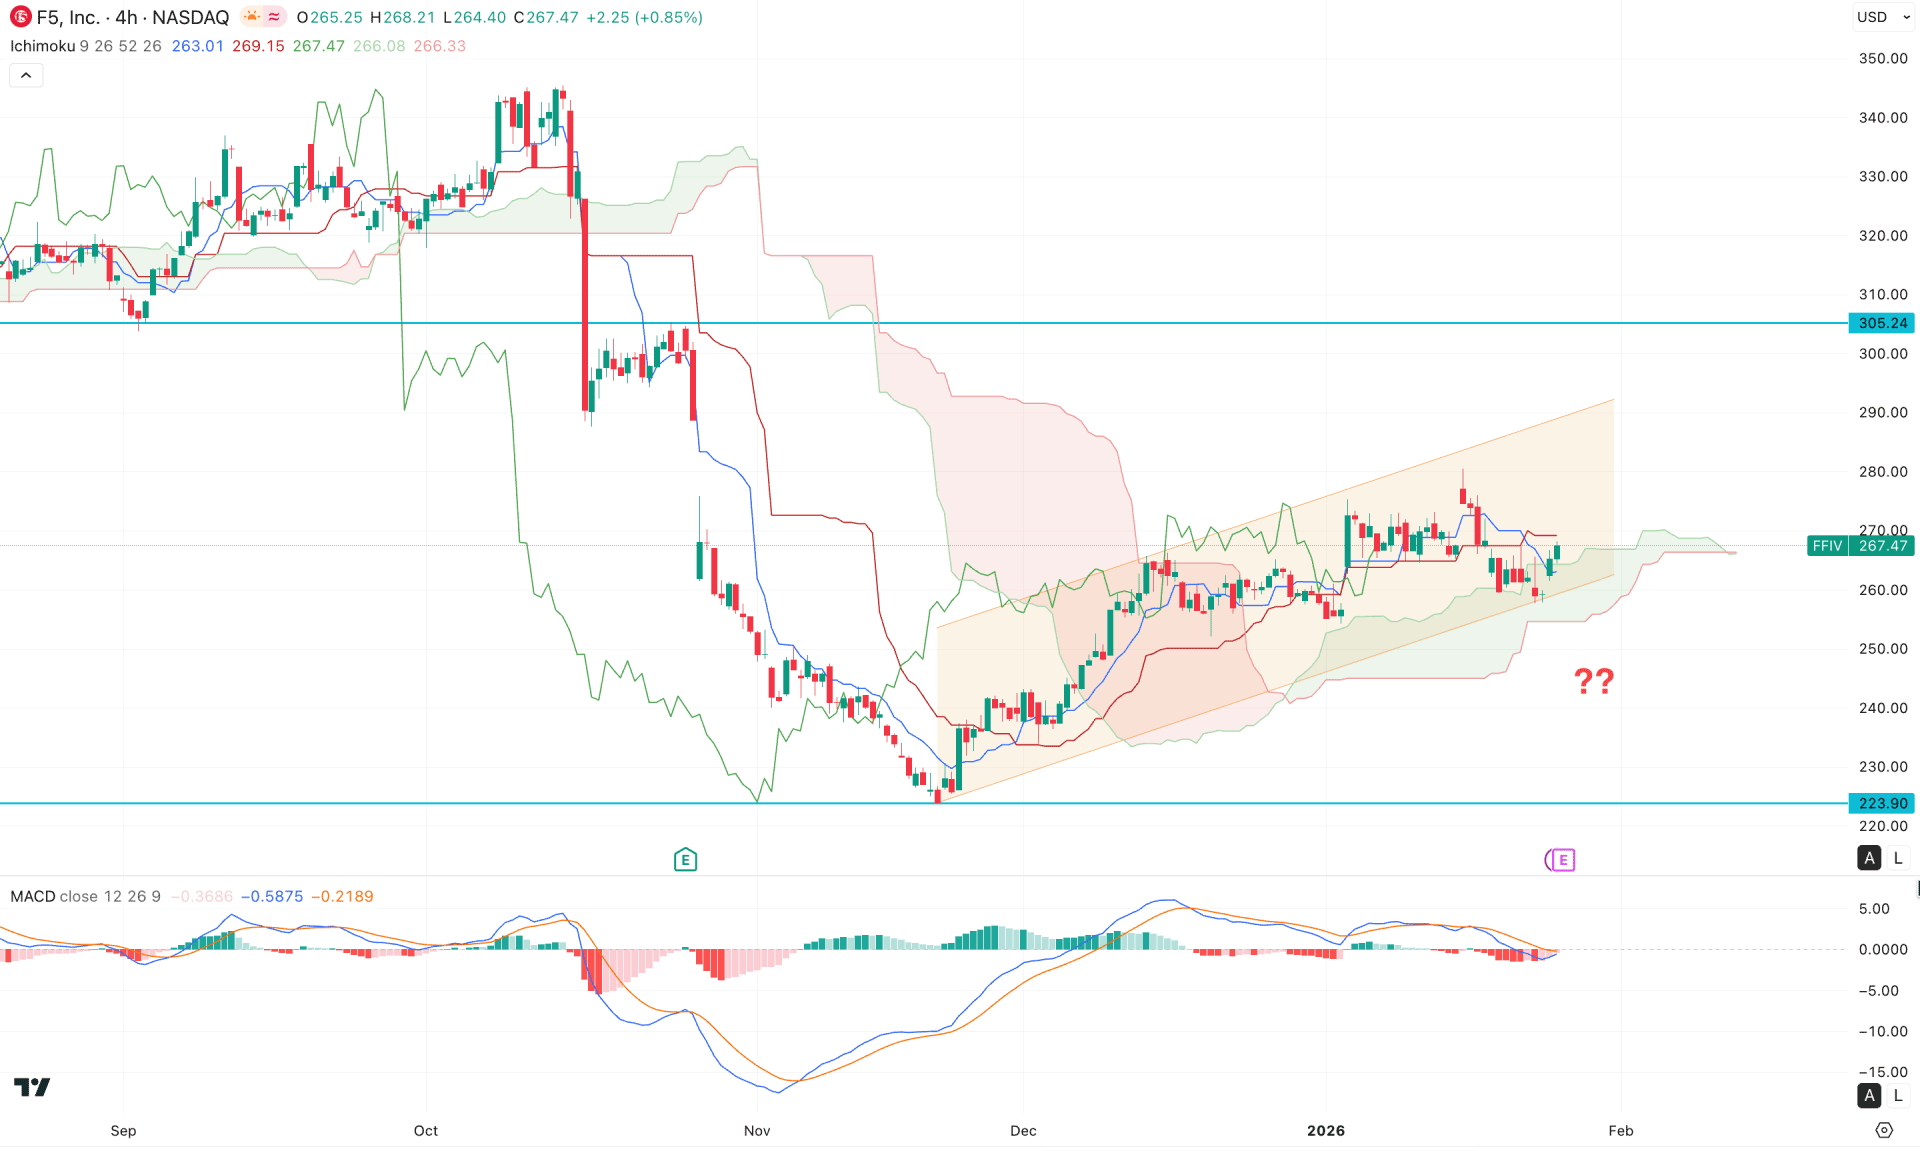
On the H4 timeframe, the price is currently trading in a sideways range following strong selling pressure and a cloud break. However, the price is still holding above the cloud area within a corrective structure, which requires close monitoring before anticipating the next directional move.
In the forward cloud, both lines are converging, signaling indecision, with multiple violations observed along the dynamic levels.
In the indicator window, the MACD histogram has lost bullish momentum and has moved into the neutral zone, reflecting mixed sentiment around the signal line.
Based on this structure, the primary objective for this pair is to identify a descending channel breakout with a confirmed close below the cloud's lower boundary before initiating a short position. On the downside, immediate support is located at the 223.90 level, followed by the 200.00 target.
On the other hand, the recent price action is still finding support along the lower boundary of the channel, from where a bullish channel extension toward the 290.00 level remains possible. However, the key resistance in this structure stands at 305.24, which must be decisively breached to validate a long-term bullish trend continuation.
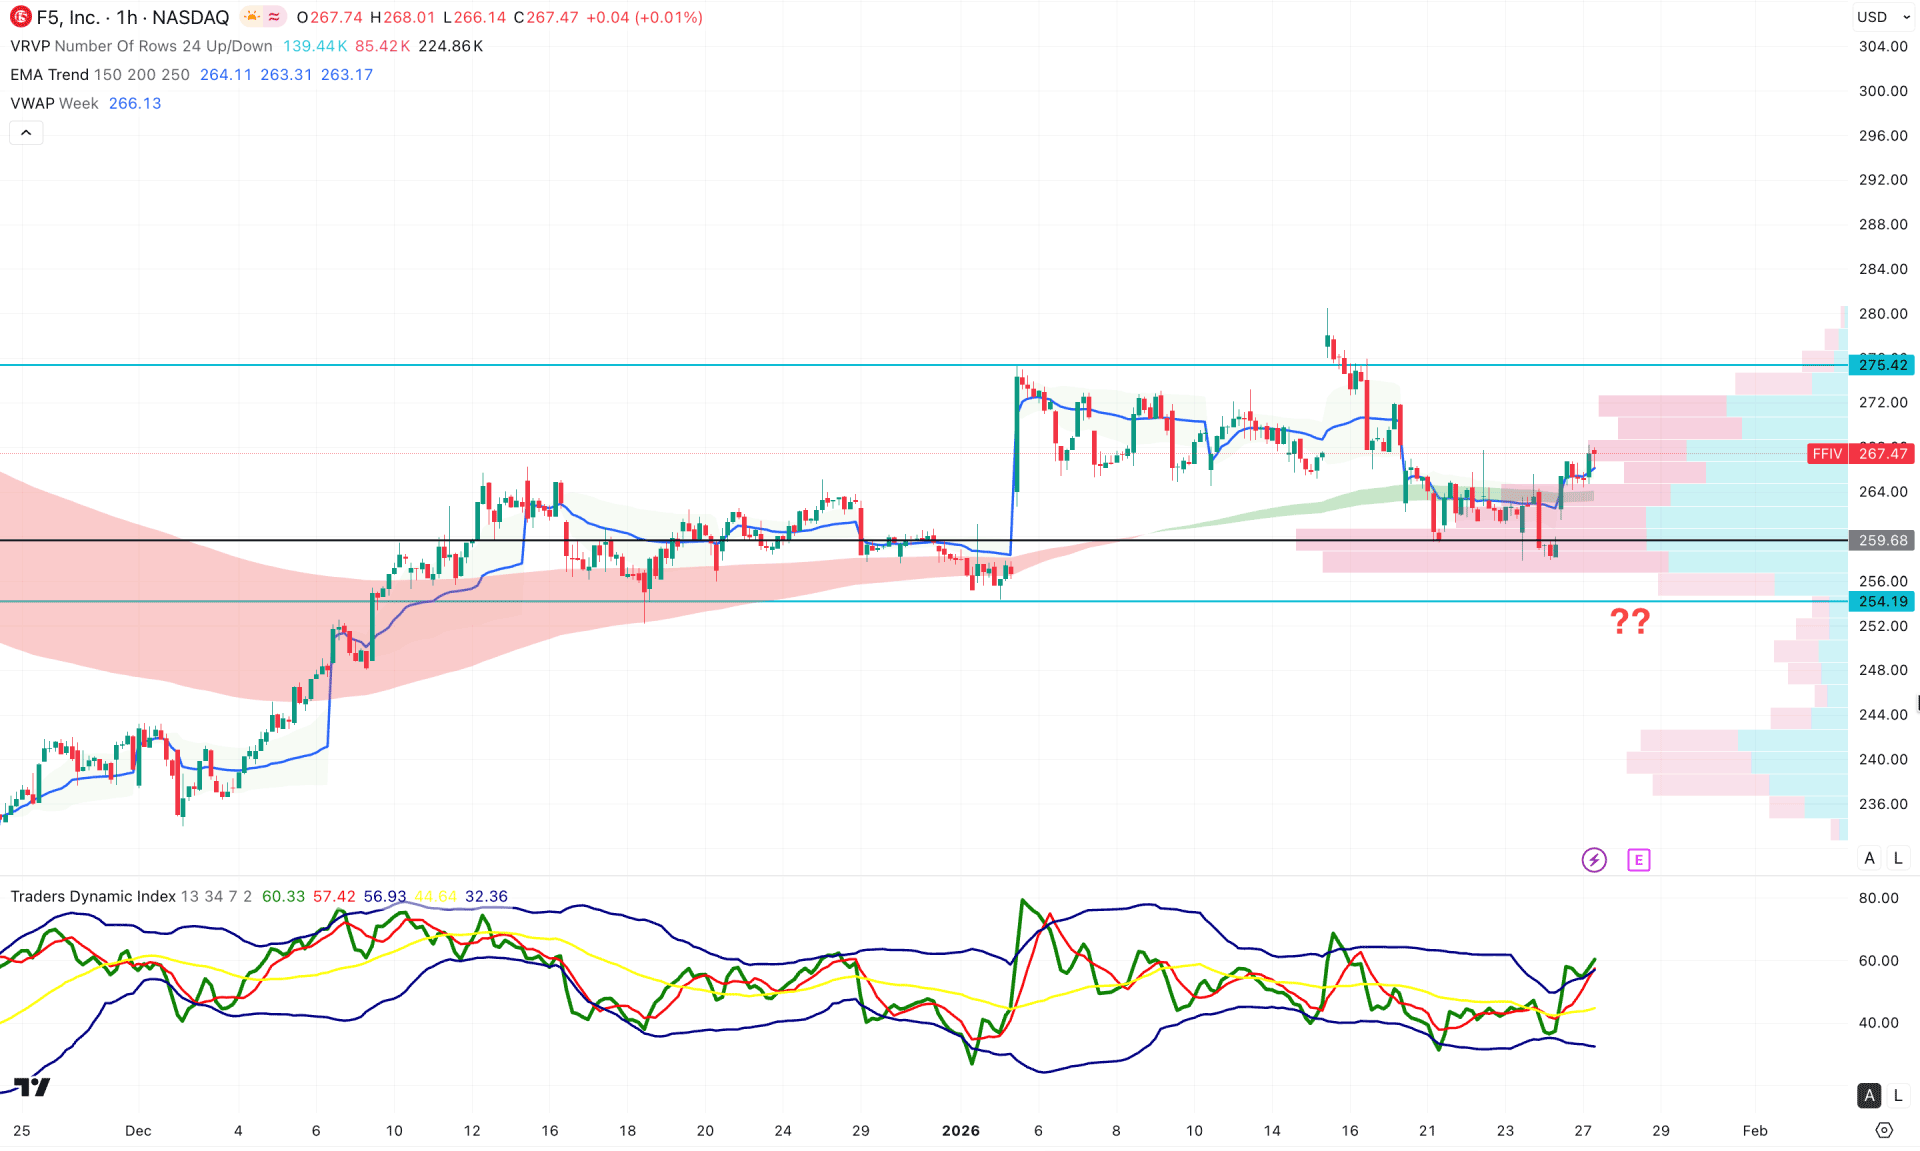
On the lower timeframe, the most recent price action is trading sideways while maintaining underlying bullish pressure. A strong bullish rebound is visible from the intraday high, pushing the price above the EMA wave. Moreover, the weekly VWAP line remains below the current price with an upward slope, indicating sustained buying pressure.
In the indicator window, price conditions appear overbought as reflected by the Traders Dynamic Index (TDI). The current TDI reading suggests a potential short-term top formation within the bullish momentum.
Based on this outlook, the primary objective for this instrument is to anticipate a bullish trend continuation, with an initial target at the 275.42 resistance level. A confirmed close above this level could present a potential long opportunity, opening the door for a move beyond the psychological 300.00 level.
On the downside, an immediate bearish break with failure to hold above the 259.60 level could signal a deeper corrective move toward the 240.00 support zone.
Overall, FFIV stock is trading within a bullish trend structure, though further confirmation from the daily timeframe is required to validate continued upside momentum. The price is currently consolidating in a range-bound market, and the upcoming earnings report could act as a key catalyst for a decisive breakout.


