Published: November 18th, 2021
Exxon reported the Q3 earnings report on 29 October at $1.58 a share with a revenue of $75.79 billion. Since the COVID-19 pandemic, Exxon investors have remained committed to dividends, even by slashing spendings. Moreover, the company said they have a plan to increase the shareholder’s distribution by buying back nearly $10 billion valued XOM stocks.
According to Exxon’s CEO, they plan to increase spending on the lower-emission energy sector to have a strong return with stable development. The overall annual capital expenditure would be between $20 billion to $25 billion for the coming years.
Exxon earnings and XOM stock have a positive correlation with the Crude Oil price. Recently, US Oil reached the critical resistance of $80.00 level for the first time since 2014, while Brent Oil has seen a new high price since 2018. As the current Crude Oil price is already at a multi-year high with a volatile market structure, any rebound in the oil price would be an alarming sign for XOM investors.
Let’s see the upcoming price direction from the Exxon Stock (XOM) technical analysis:
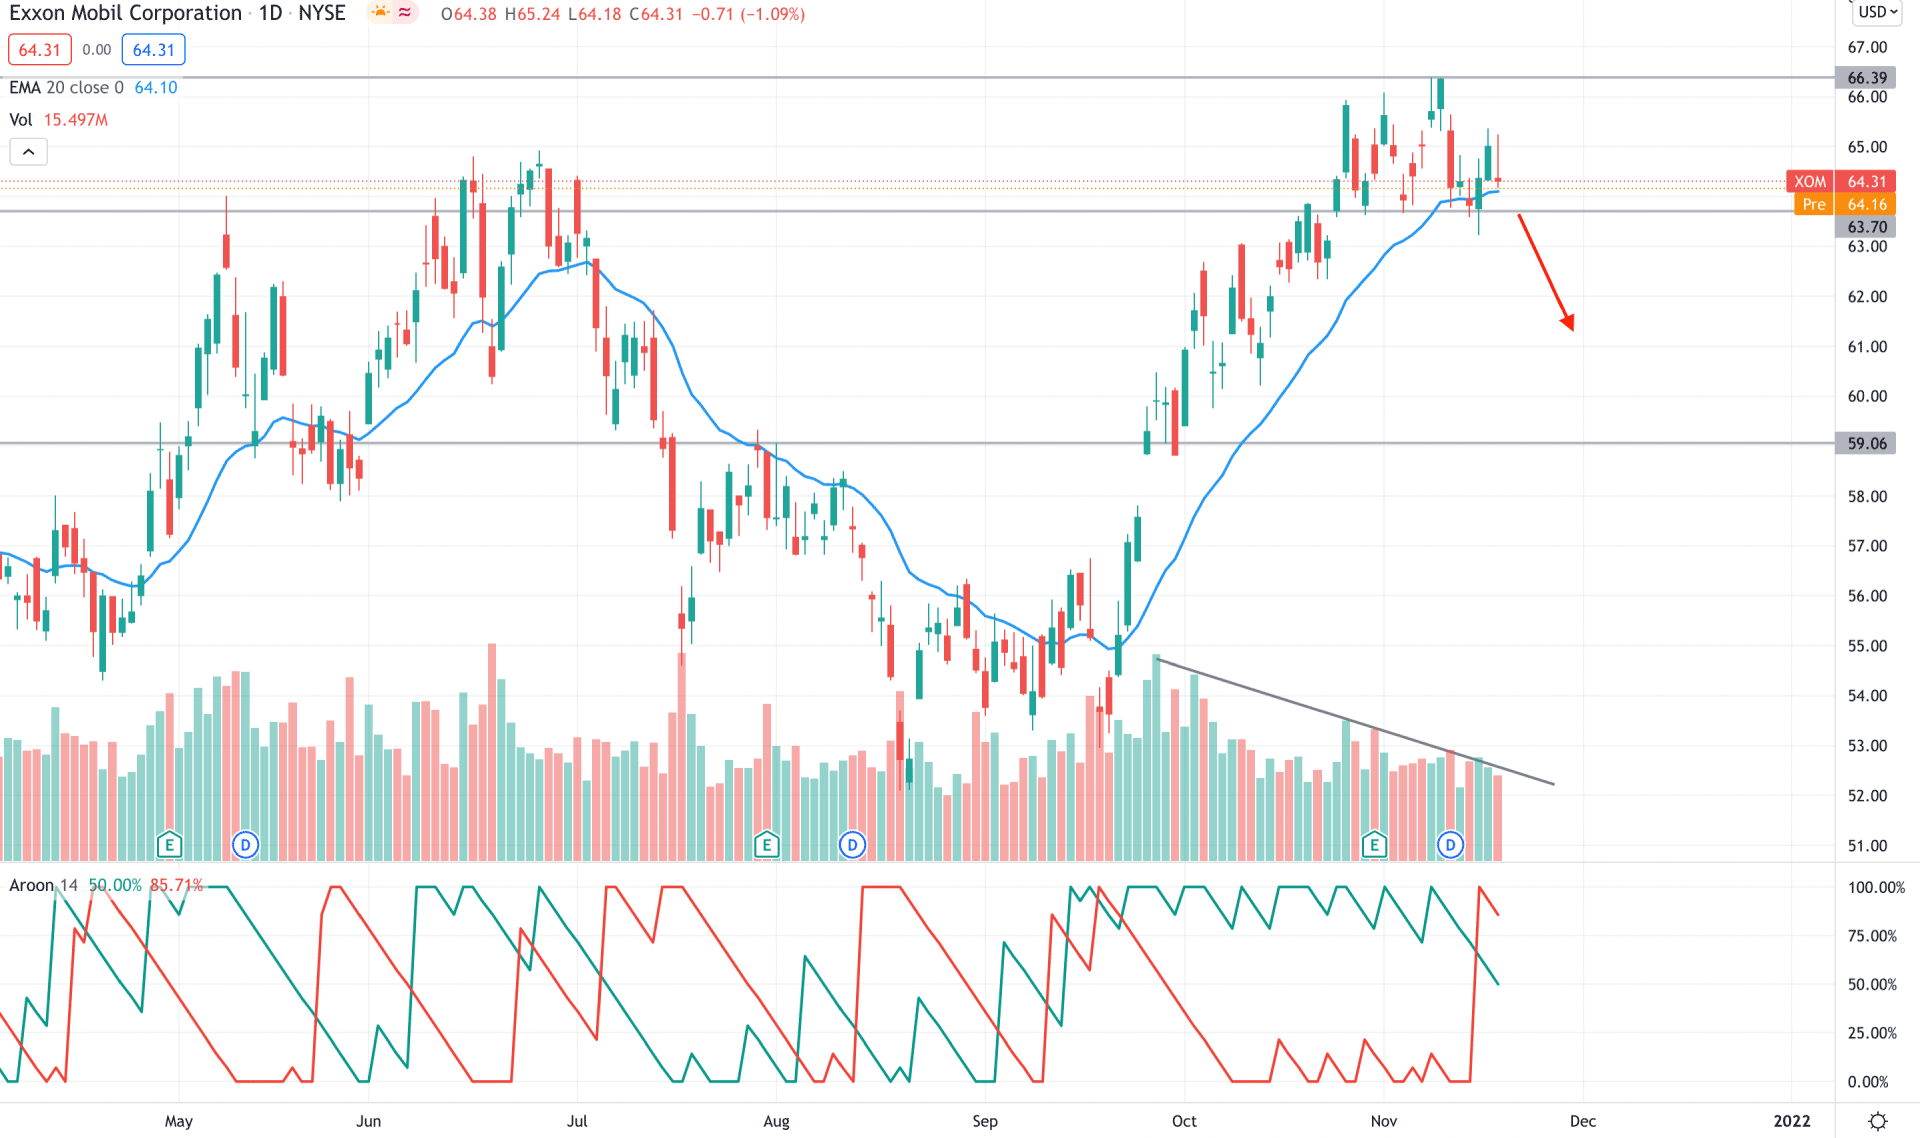
Exxon Stock initiated a solid bullish pressure in the middle of September, where a bullish solid daily close above the 56.40 resistance level shooted the price higher at 66.39 key-event level. After that, however, the price became volatile after reaching the yearly high while the volume kept falling. In the last two months, the price remained corrective within the 63.70 to 66.40 level, which shows the buyer’s weakness.
In the Crude Oil daily chart, the price made a bearish break of structure below the 80.79 level with a retest of the 84.80 supply area. Therefore, crude oil is more likely to extend the bearish pressure as long as bears hold the price below the 80.86 key event level.
The above image shows how the Exxon Stock (XOM) is trading within a corrective momentum while the early trend changed from bullish to bearish. According to the Aroon Indicator, the Aroon Down (red line) moved above the Aroon Up ( green line) and reached 100% area. Therefore, the bearish pressure may extend until Aroon Down holds its momentum above the 50% level. Meanwhile, the trading volume is decreasing and moving within a trendline. In that case, a bearish daily candle below 63.70 with a substantial volume would be a good opportunity for XOM bears towards the target of 59.00 level. On the other hand, a stable price above the 66.40 key event-level would be bullish the current market structure.
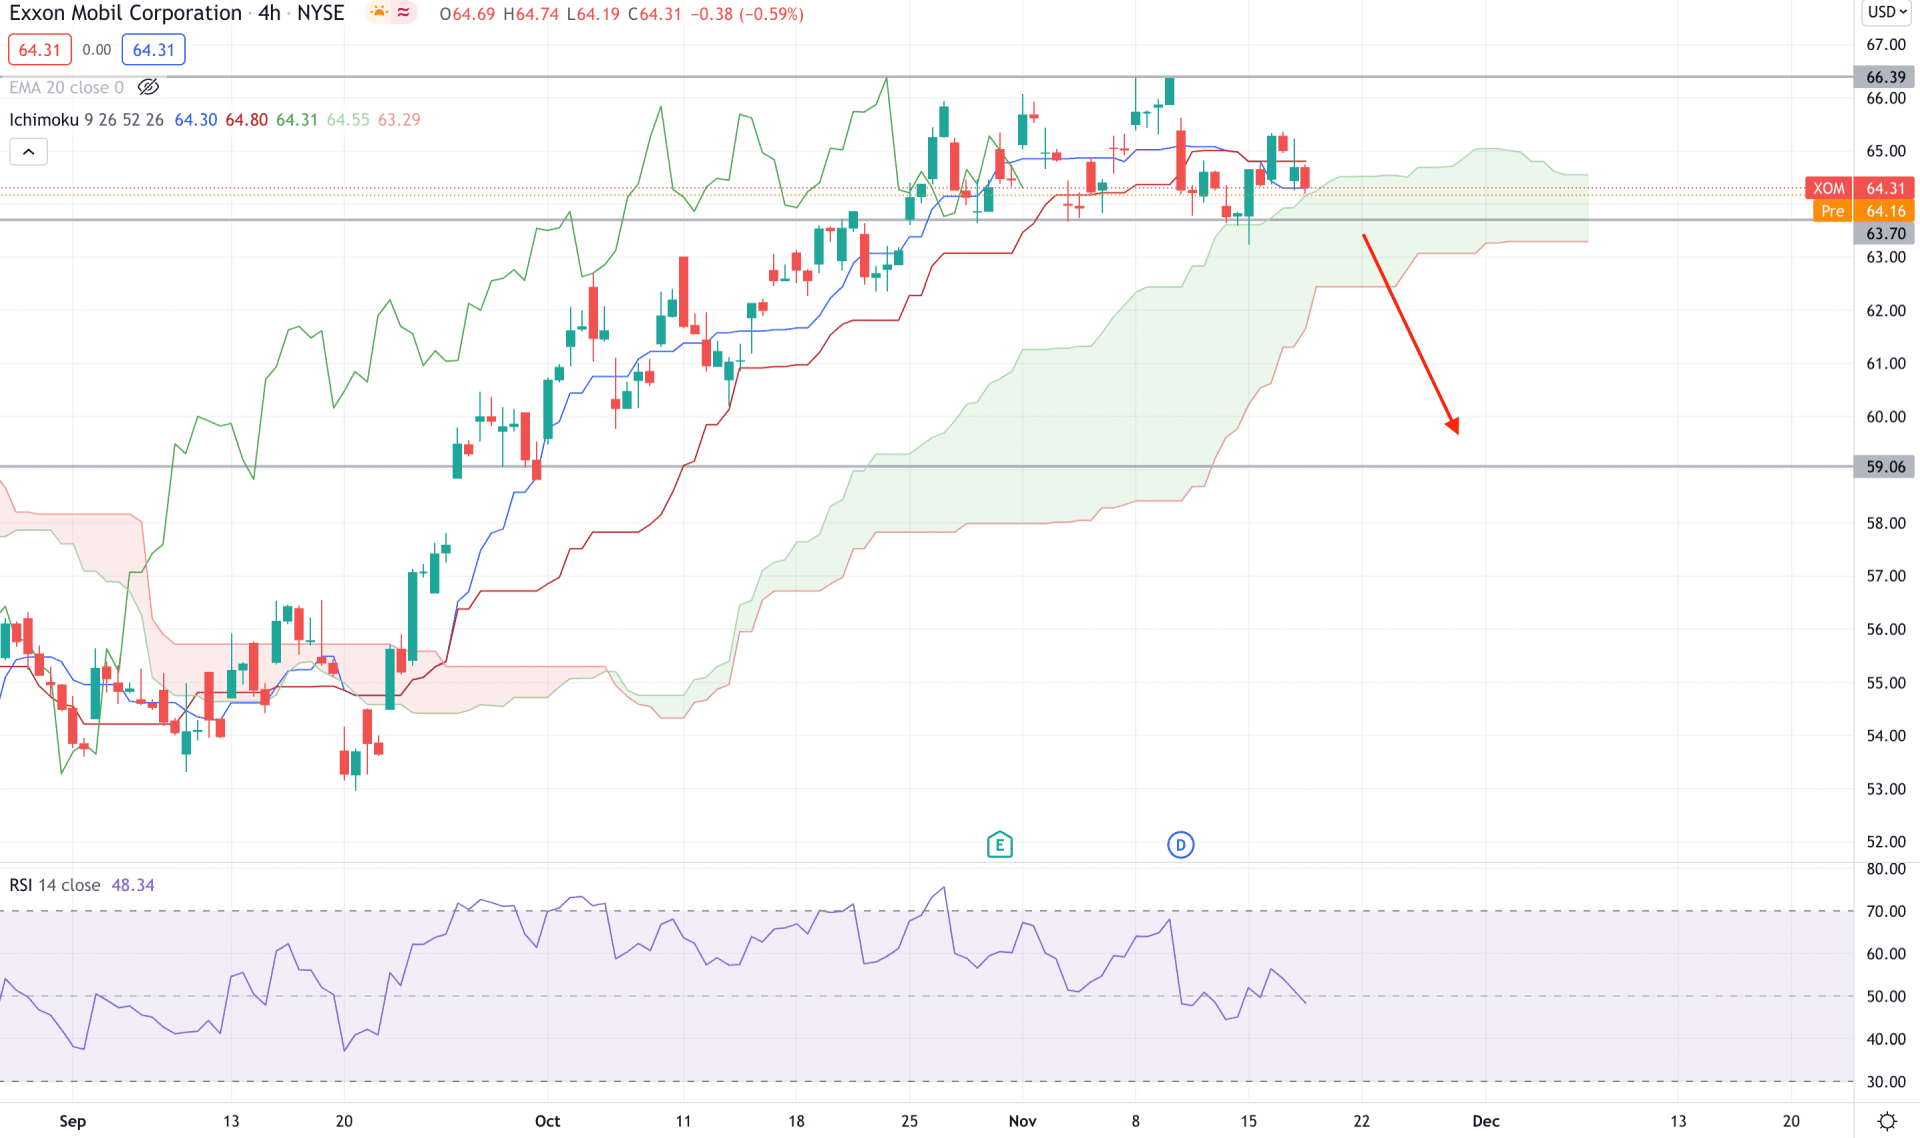
According to the Ichimoku Kinko Hyo, Exxon stock (XOM) is trading in a bullish trend where the most recent market momentum has weakened. As a result, the future cloud became flat while the lagging span moved closer to the price. In this condition, any strong bearish indication has a higher possibility of working out.
The above image shows how the Tenkan Sen Crossed below the Kijun Sen and worked as a dynamic support. Meanwhile, the RSI level moved below 50 areas and headed to 30 levels, increasing the selling possibility. Therefore, based on the H4 context, a strong bearish H4 candle below 63.70 would increase the selling pressure towards the 59.06 level in the coming days. On the other hand, a strong rebound from the cloud support and a bullish H4 close above the Kijun Sen would increase buying possibilities.
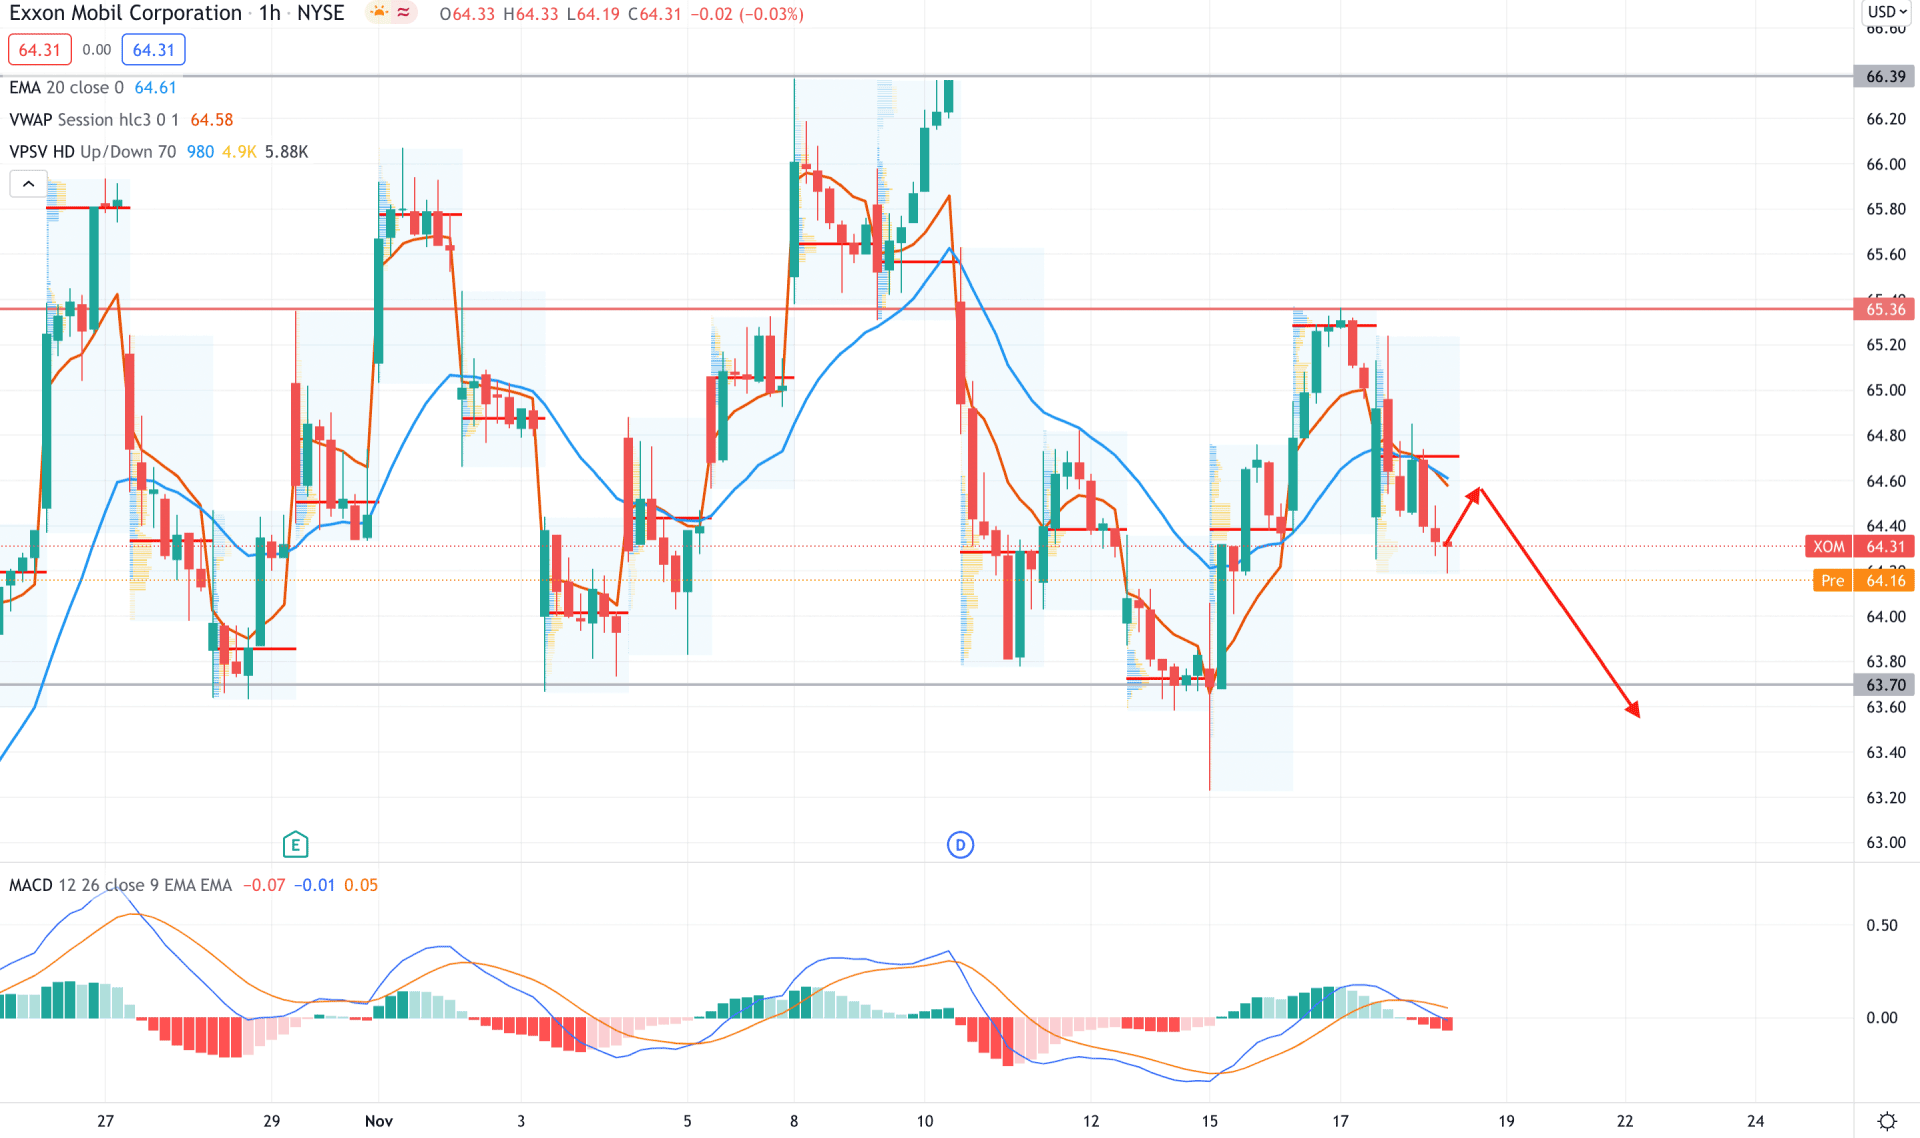
In the intraday chart, the price is trading within a range where the most recent price moved below the 64.71 high volume level while the dynamic 20 EMA is working as a resistance.
The above image shows how the MACD Histogram is heading below the zero line, with an NPN formation. In that case, any bearish rejection from the dynamic 20 EMA or weekly VWAP on the H1 chart would be a good selling opportunity in Exxon Stock. On the other hand, a bullish break above 65.36 may invalidate the bearish possibility.
As per the current market condition, Exxon stock may move lower in the coming days, where the ultimate target would be near the 59.00 level. On the other hand, a bullish break above the 66.40 key event level with the support from Crude Oil price would invalidate the current market structure and increase the buying pressure towards the 71.00 area.


