
Published: February 23rd, 2022
In the Eurozone, the February ZEW survey showed that the current German condition is above expectations after the pandemic restriction. However, the EU expectation slipped for the first time in three months. In the latest second reading of EU Q4 GDP, the report came with an unchanged value at 0.3% q/q and 4.6% y/y. The current market sentiment awaits how the geopolitical issues are driving the price, where the volatility depends on how the US reacts to Russia’s movement to Ukraine.
According to the latest report from a US representative, no sign of significant US interest in Russia’s movement is seen. The US Secretary of State Antony Blinken showed no possibility of meeting with the Russian Foreign minister on Tuesday. Moreover, the US President has provided less interest in fighting against the Ukraine issue that may decrease the volatility for EURUSD in the coming days.
The US economy started the new year with a positive sentiment where the Control group, a metric used for GDP calculation, came at 4.8% m/m. However, the retail sales have not adjusted the inflation. People considered buying goods with higher prices, where the most significant rise in consumer spending came at furniture and auto dealers. On the other hand, the Fed has taken actions to minimize the rising inflation where a 50 bp rate hike is highly possible in the March FOMC. Now investors should focus on how the Core PCE Price Index m/m is coming where the current expectation is an unchanged value at 0.5%.
Let’s see the upcoming price direction from the EURUSD technical analysis:
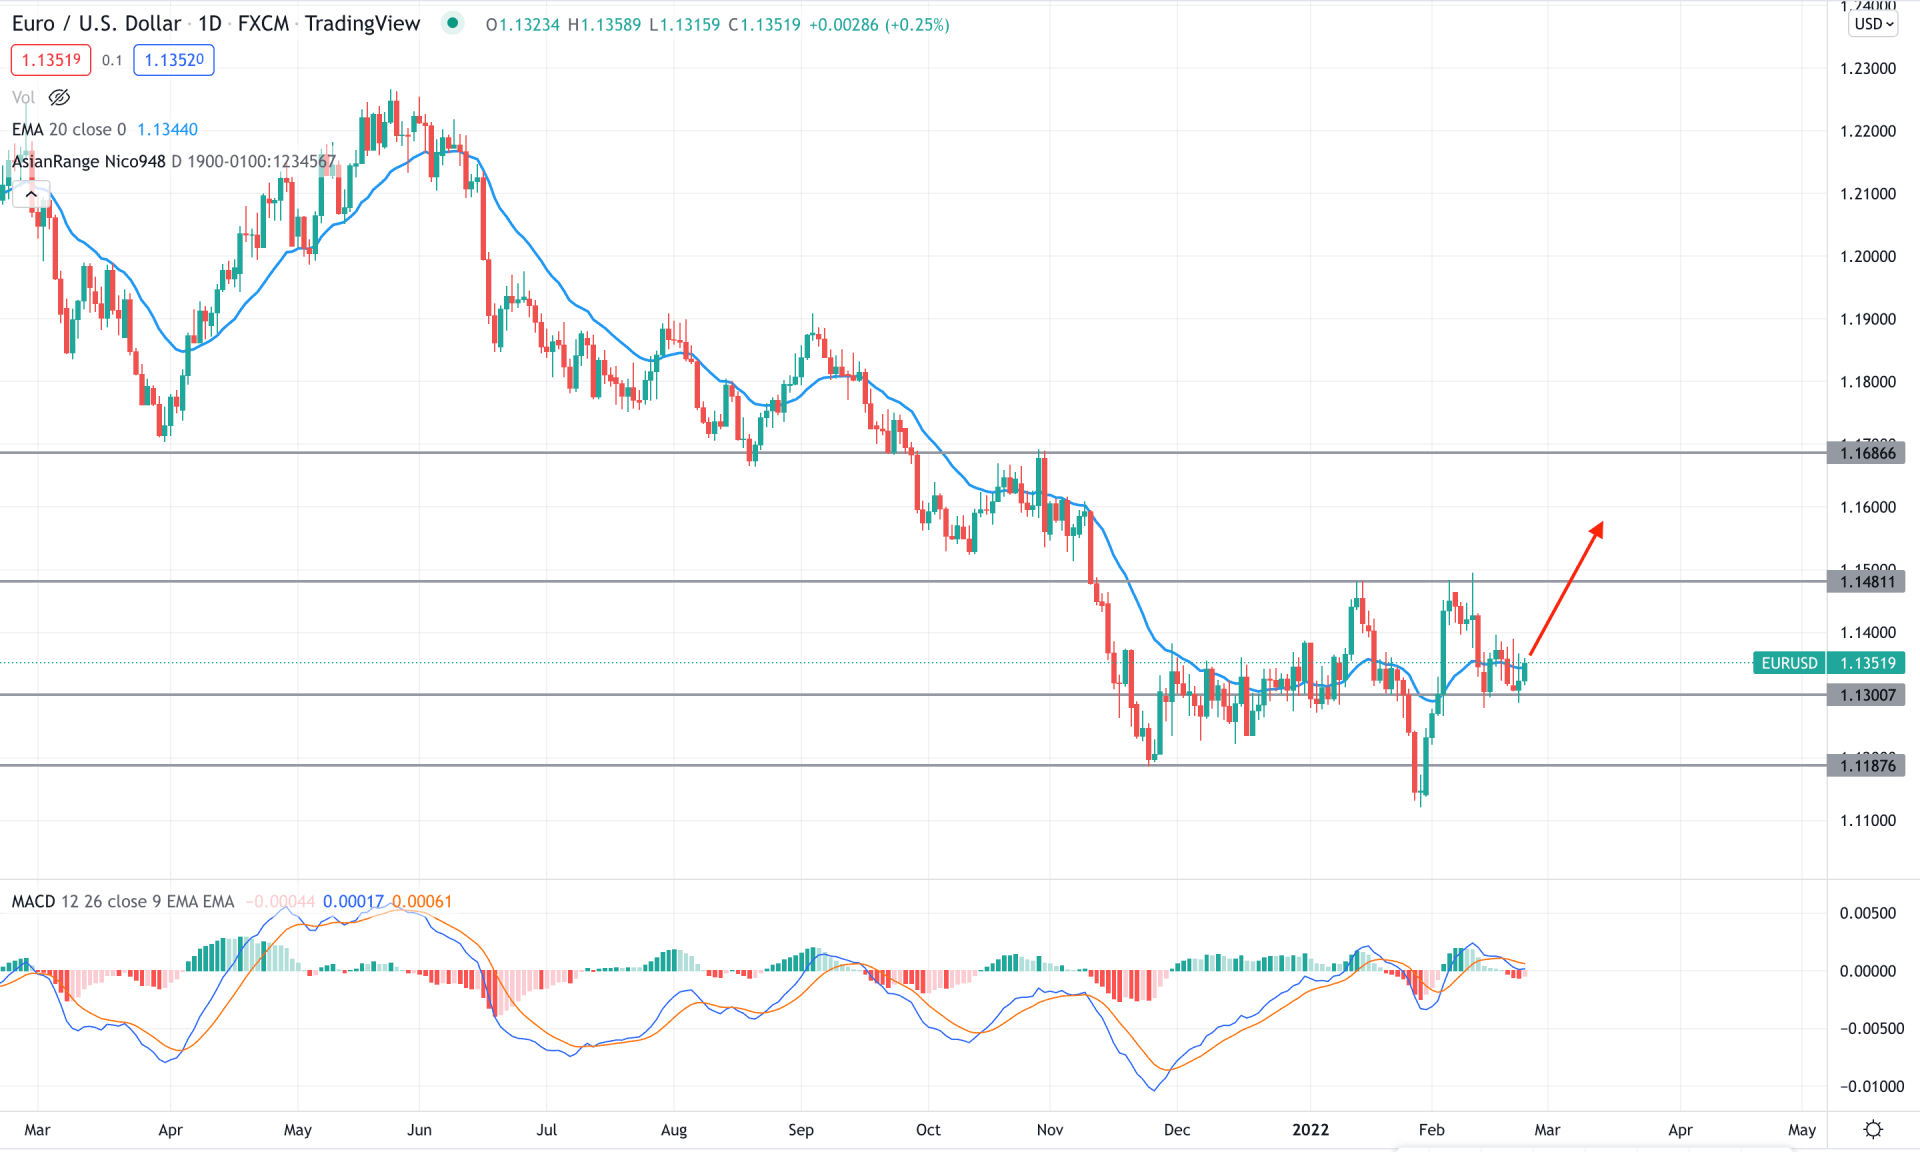
In the daily chart, the selling pressure is solid in the EURUSD as the new multi-year low at 1.1121 level with a double top at 1.1481 provided a strong bears’ presence. However, in the most recent price, bears failed to breach the 1.1300 level with a bearish daily close, raising the question of reactivating the existing selling pressure.
The above image shows how the daily candle remained corrective above the 1.1300 level while the MACD Histogram is bearish. However, the MACD line is above the Histogram and aimed lower while the price is corrective above the 1.1300 support level.
In this context, investors should closely monitor how the intraday price shows a range breakout where any upside pressure may test the 1.1480 level in the coming days. On the other hand, a new bearish daily candle below the 1.1300 level may resume the existing selling pressure to open rooms for testing the 1.1100 area.
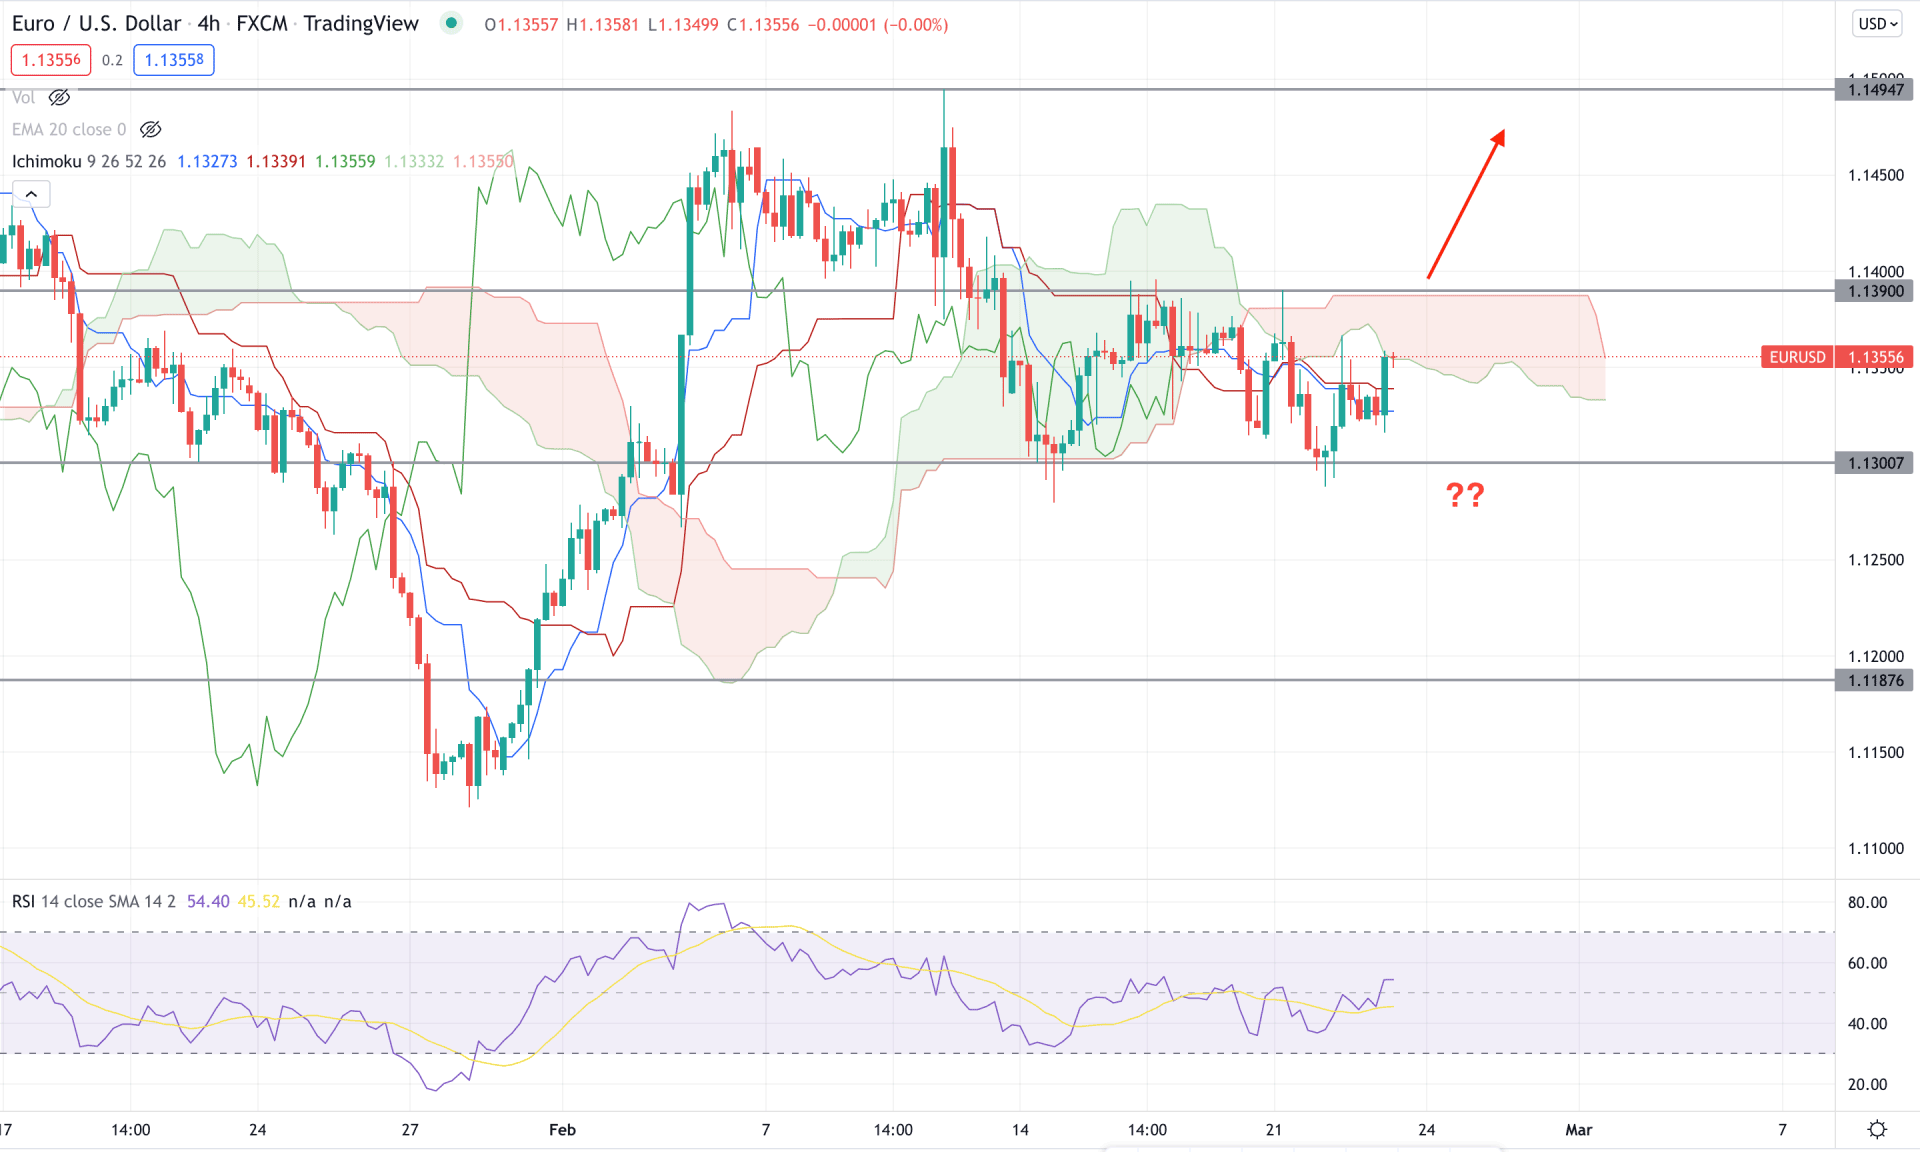
According to the Ichimoku Cloud analysis, the EURUSD H4 chart is trading with a bullish potentiality. The Senkou Span A is below the Senkou Span B but aimed higher in the future cloud. It is a sign that bears are losing the momentum where any bullish breakout might open a buying opportunity.
The above image shows how the RSI level moved above the 50 levels with a corrective movement while the latest H4 candle closed above dynamic Tenkan Sen and Kijun Sen lines. The overall price is trading within the range between 1.1390 to 1.1300, where a bullish H4 close above the 1.1390 level would ensure the bullish cloud breakout with a buying opportunity towards the target of 1.1500 area.
On the other hand, the hope of bears depends on how the price reacts on the dynamic Kijun line, while a rebound and a bearish H4 candle below the static 1.1300 support level would lower the price towards the 1.1100 area.
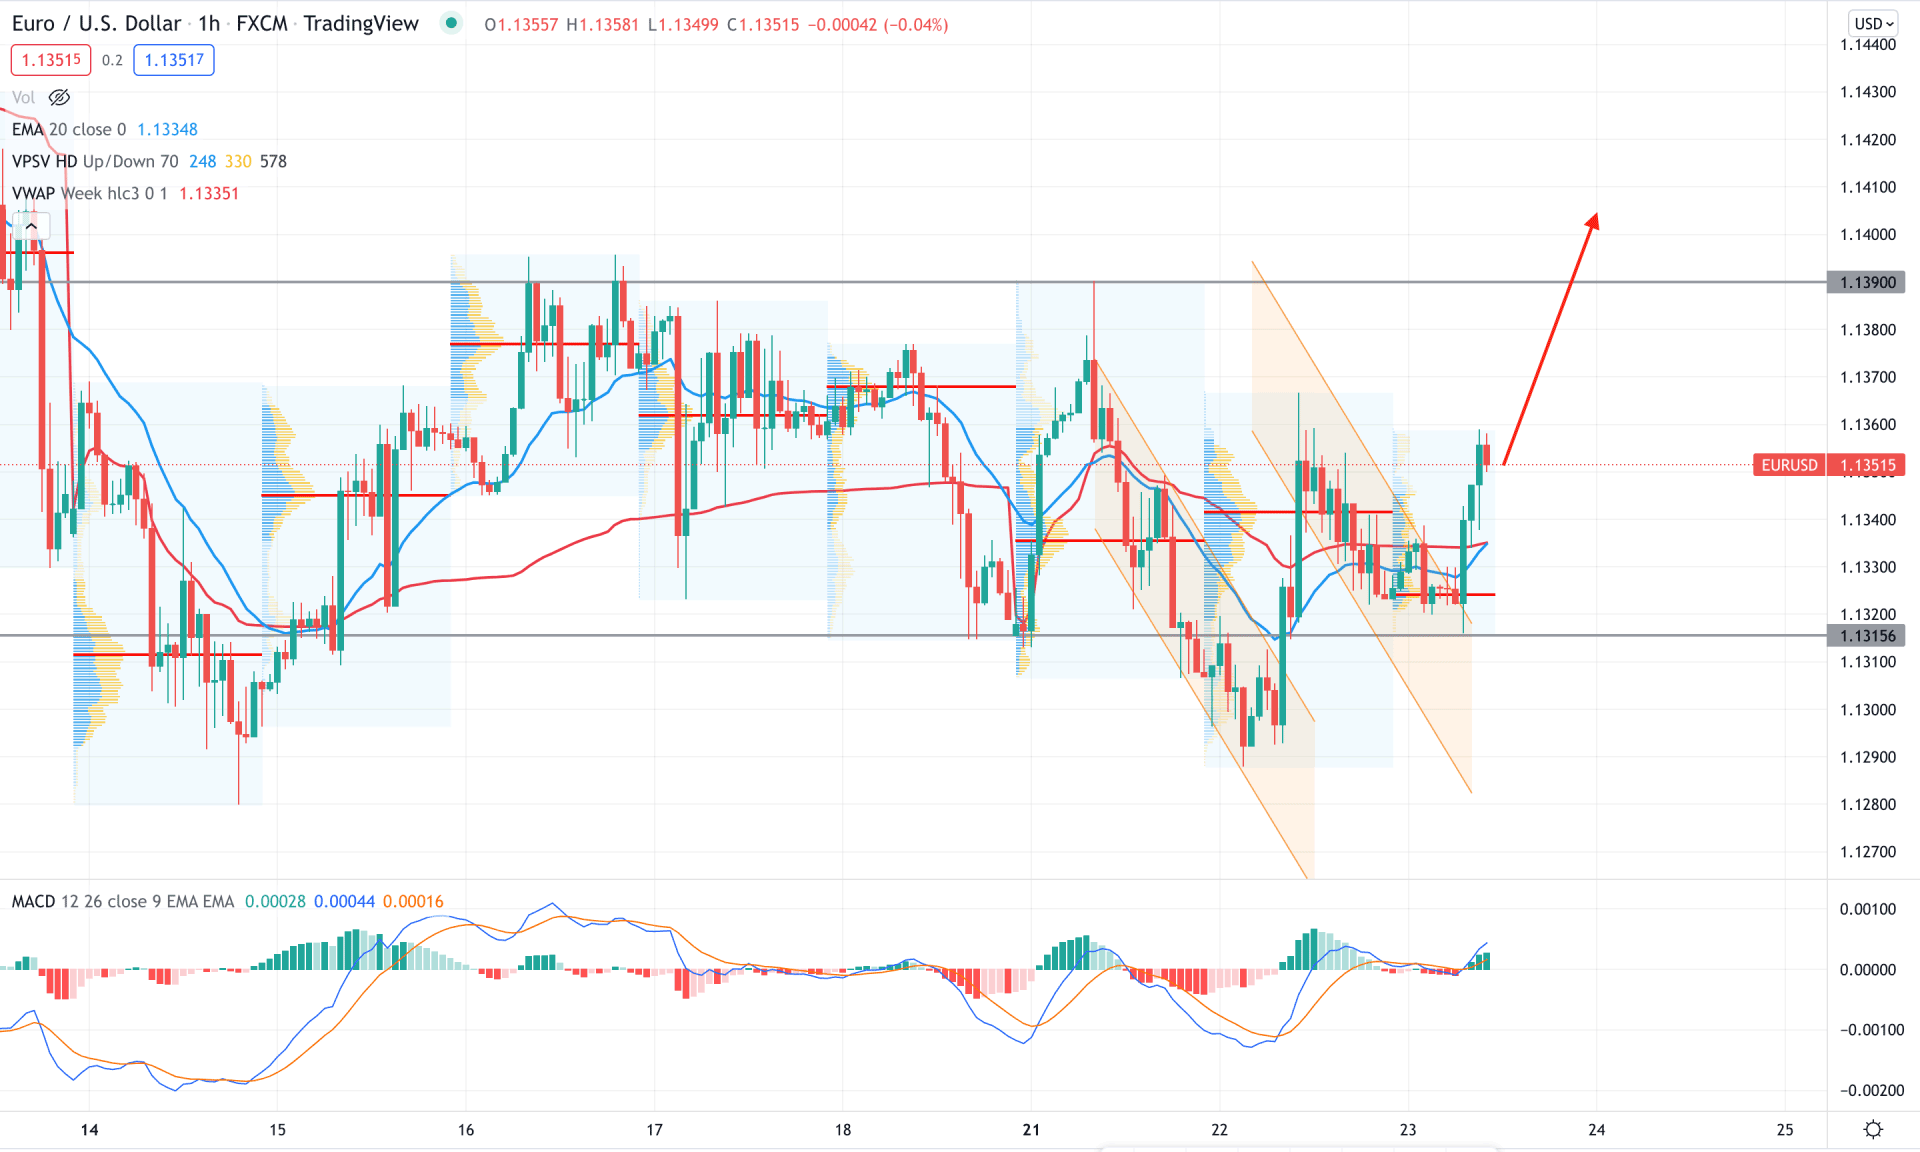
In the intraday chart, EURUSD is trading within a pre-breakout structure where any strong bullish rejections from dynamic levels would open a buying opportunity. Moreover, the extreme volatility pushed the price to show a breakout from bearish channels where the buying opportunity is valid as long as bulls hold the price above the 1.1300 level.
The above image shows how the MACD histogram changed its position from bearish to bullish and made a new high. On the other hand, dynamic 20 EMA and weekly VWAP are below the price and provide minor support.
Based on the current price structure, any bullish rejection from 1.1340 to 1.1300 would increase the buying opportunity towards the target of 1.1400 area. In that case, investors should consider finding strong bullish signs as the broader market trend is still bearish.
As per the current market context, EURUSD is more likely to show buying pressure as bulls hold the price above 1.1300 key support level. Therefore, any bullish H4 close above the H4 Kumo Cloud would provide a reliable buying sign. In that case, the primary target of the bull run would be towards the 1.1500 level.


