
Published: November 27th, 2025
The EURUSD is heading upwards for four consecutive trading days, where overcoming the 1.1600 level could be a remarkable achievement.
The US Dollar Index (DXY) dipped from its weekly high amid dovish Fed expectations. Currently, traders are anticipating an 85% chance of a rate cut at the upcoming FOMC meeting in December. Moreover, mixed economic releases this week signal no clear direction, increasing the volatility.
On the other hand, the European Central Bank (ECB) remains cautious about the economic policy. The ECB Vice President offers a positive outlook for the economy, while the Croatian central bank chief, Boris Vujcic, anticipates a rate cut.
Can the EUR hold the gain against the US Dollar during the holiday season?
Let's see the complete outlook from the EURUSD technical outlook:
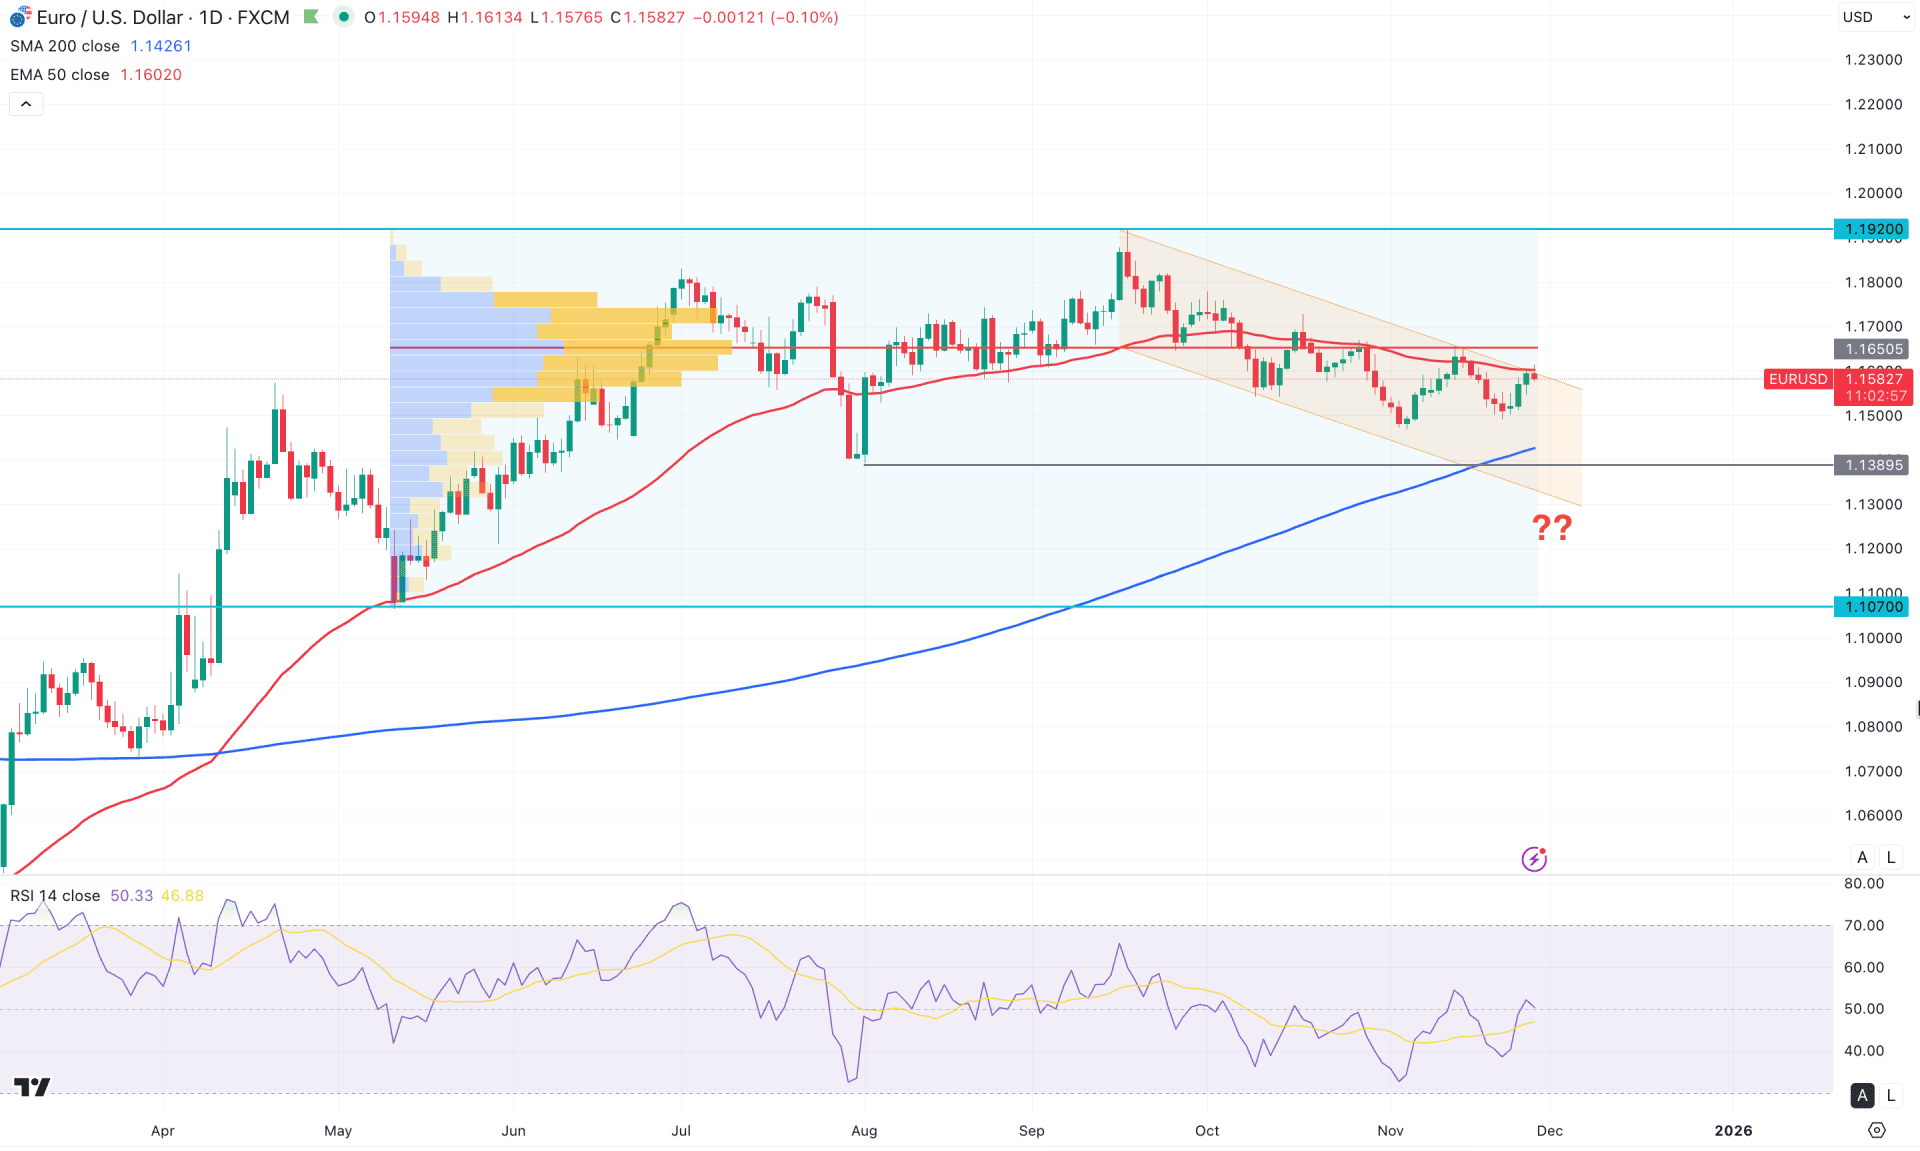
In the daily chart of EURUSD, the broader market context remains bullish, even though a minor sideways correction is possible from the recent swing high. Investors should closely monitor how the price behaves near the channel area, as a valid breakout could resume the existing bullish trend.
On the higher timeframe, the monthly candle suggests the potential for a formation near the 1.1920 level, where a consolidation phase is present. Meanwhile, the weekly price action indicates consolidation in the premium zone, signaling no clear trend.
In terms of volume, the price is still trading on the sellers' side, as the largest activity zone since May 2025 is at the 1.1650 level. Since the recent price is trading below this crucial high-volume resistance, the primary expectation is for short opportunities.
On the main price chart, EURUSD has been trading for a considerable time below the 50-day Exponential Moving Average (EMA). The most recent daily candle is also struggling to maintain momentum above the 50-day EMA. Additionally, the ongoing descending channel is creating bearish pressure as the price continues to react to channel resistance. However, the 200-day Simple Moving Average (SMA) maintains a bullish slope, with a crossover near the 1.1389 static support. A bullish break above the 50-day EMA is needed before any continuation to the upside.
In the secondary indicator window, the Relative Strength Index (RSI) is hovering around the neutral 50.00 level, indicating sideways momentum. The Average Directional Index (ADX) also remains flat in September 2025, showing no trend development.
Based on the current market structure, a bullish break above the 1.1650 high, supported by the ADX rising above the 20.00 level, could validate a long opportunity, with the ultimate target being a test of the 1.1920 resistance. On the other hand, the ongoing price action remains bearish, as it meets general resistance, with the immediate downside target at 1.1389.
However, a failure to break below the 200-day SMA, followed by a bullish rebound, could offer another long opportunity at a discounted price. Extended selling pressure below 1.1389 would limit bullish potential and could drive the price toward the 1.1070 key support level.
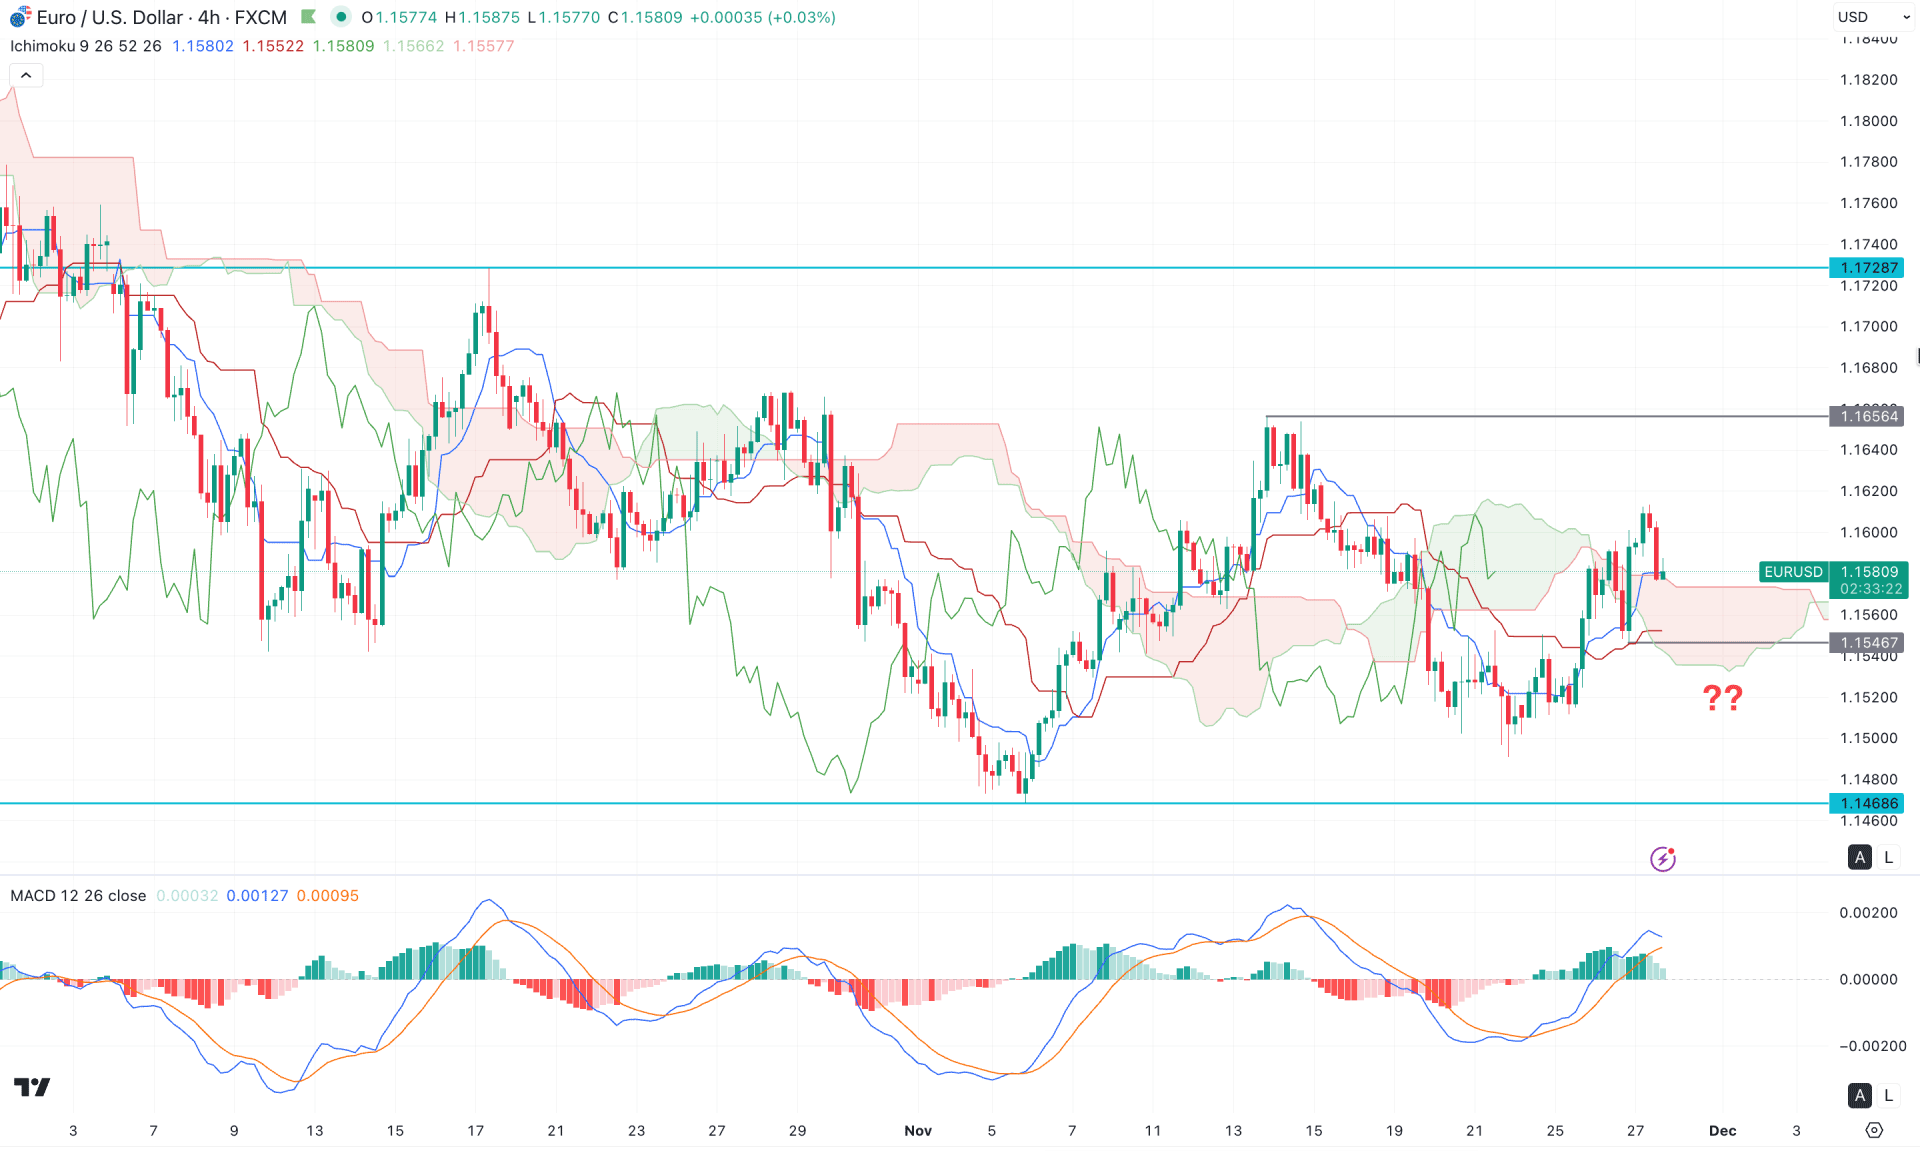
In the H4 timeframe, the overall market momentum is corrective, where the most recent price is trading sideways above the Ichimoku Kumo Cloud zone. As the Future Cloud is not solid to anticipate a bullish continuation, investors should remain cautious before taking a long approach.
In the indicator window, the MACD Histogram reached the neutral point after failing to hold the positive momentum. Moreover, the Signal line has failed to continue the surge and has become flat at the upper peak area.
Based on this outlook, a corrective momentum needs to be overcome before anticipating a trend trading opportunity. Primarily, a bullish reversal from the dynamic Kijun Sen level might confirm the cloud breakout and take the price towards the 1.1656 level.
However, a failure to hold the price above the Cloud area with an immediate bearish H4 candle below the 1.1546 support level might discount the price towards the 1.1480 area.
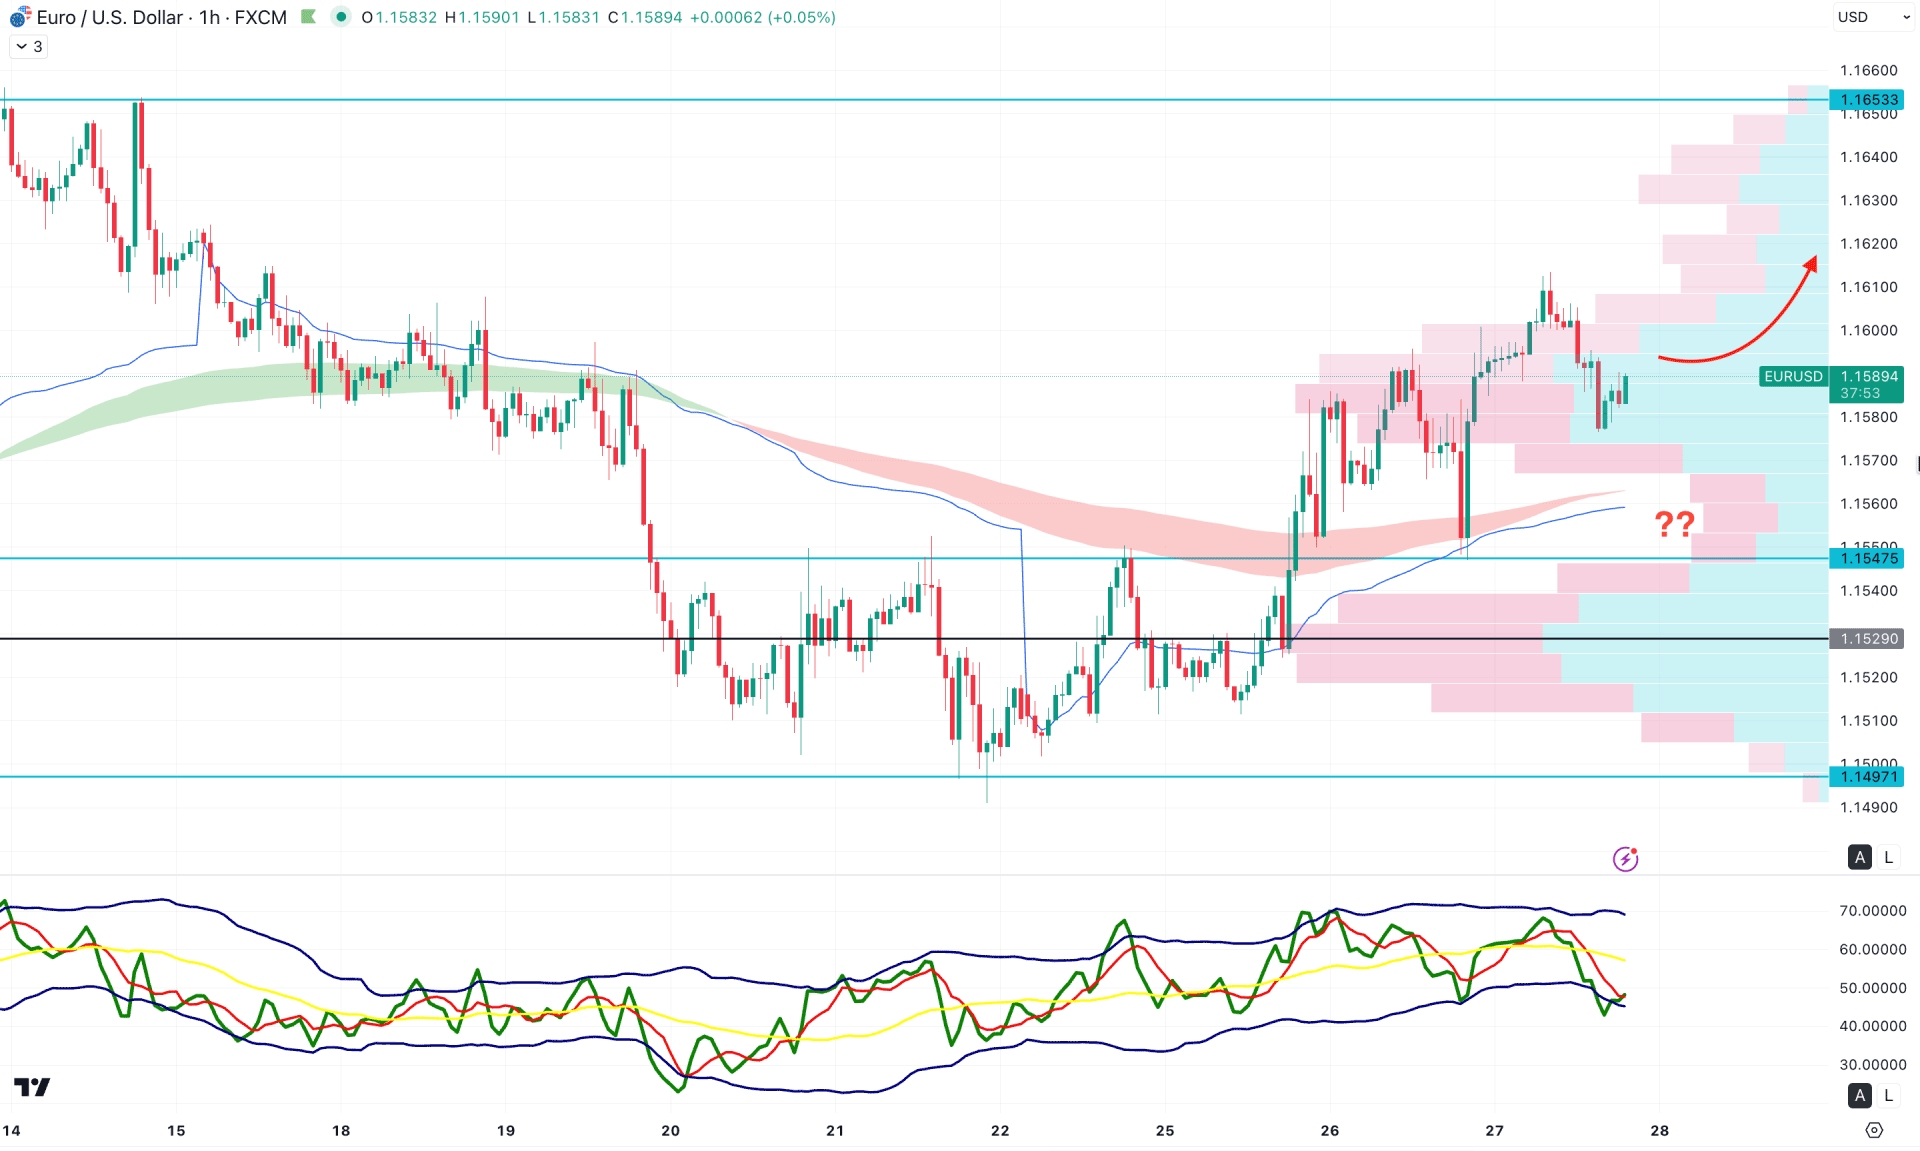
In the hourly timeframe, the recent price is trading bullish from a range breakout, which signals the major trend continuation. Moreover, the intraday high volume line and weekly VWAP are below the current price, working as additional bullish pressure.
In the indicator window, the Traders Dynamic Index (TDI) has reached the lower peak, suggesting a potential bottom formation. However, more selling pressure could come as long as the TDI remains below the 50.00 line.
Based on the overall market structure, the EURUSD is trading within a bullish continuation momentum. The upward pressure could extend as long as the VWAP remains below the current price.
Based on the above market scenario, EURUSD is having an intraday bullish pressure, where a barrier is visible from the daily channel resistance. Investors might wait for a breakout with a daily confirmation before following the major trend. However, a failure to overcome the resistance with an intraday confirmation could offer a short-term bearish opportunity.


