
Published: September 7th, 2023
The EUR/USD pair gained ground during European trading hours on Wednesday. However, it was unable to sustain its recovery and moved below the 1.0700 key level.
Wednesday's ISM Services PMI report revealed that business activity in the U.S. service sector grew faster than expected in August. In addition, the report indicated that employment had continued to expand and that price pressures accelerated during that period. The weekly unemployment claim also supported the fact by coming at 216K.
This resulted in reevaluating the probability that the Federal Reserve will raise the policy rate again this year. As a result, the yield on 10-year US Treasury bonds continued to rise, fortifying the USD further.
In the present market environment, which is marked by risk aversion as evidenced by the decline in US stock index futures, the EUR/USD pair cannot achieve a technical correction.
In addition, market participants will attentively monitor Federal Reserve (Fed) official statements. This Saturday marks the beginning of the Fed's blackout period, and policymakers have only two more days to influence market expectations.
Let's see the upcoming price direction from the EURUSD technical analysis:
EURUSD is the widely traded currency pair with the highest liquidity in the market. This currency pair represents investors' average activity in the broader market, allowing market participants to gauge the overall trend.
In the recent price chart, the EURUSD pair is trading under bearish pressure, while the current price is on the sellers' side with a downside correction. As per the market context, any bullish recovery after wiping out sellers would be a great bullish opportunity.
In the higher timeframe, a strong bearish trend is clear, as the current price is trading below last month’s low, while the weekly candle shows 8th consecutive bearish closes. In that case, a downside continuation is potent until a strong rejection comes from any crucial support level.
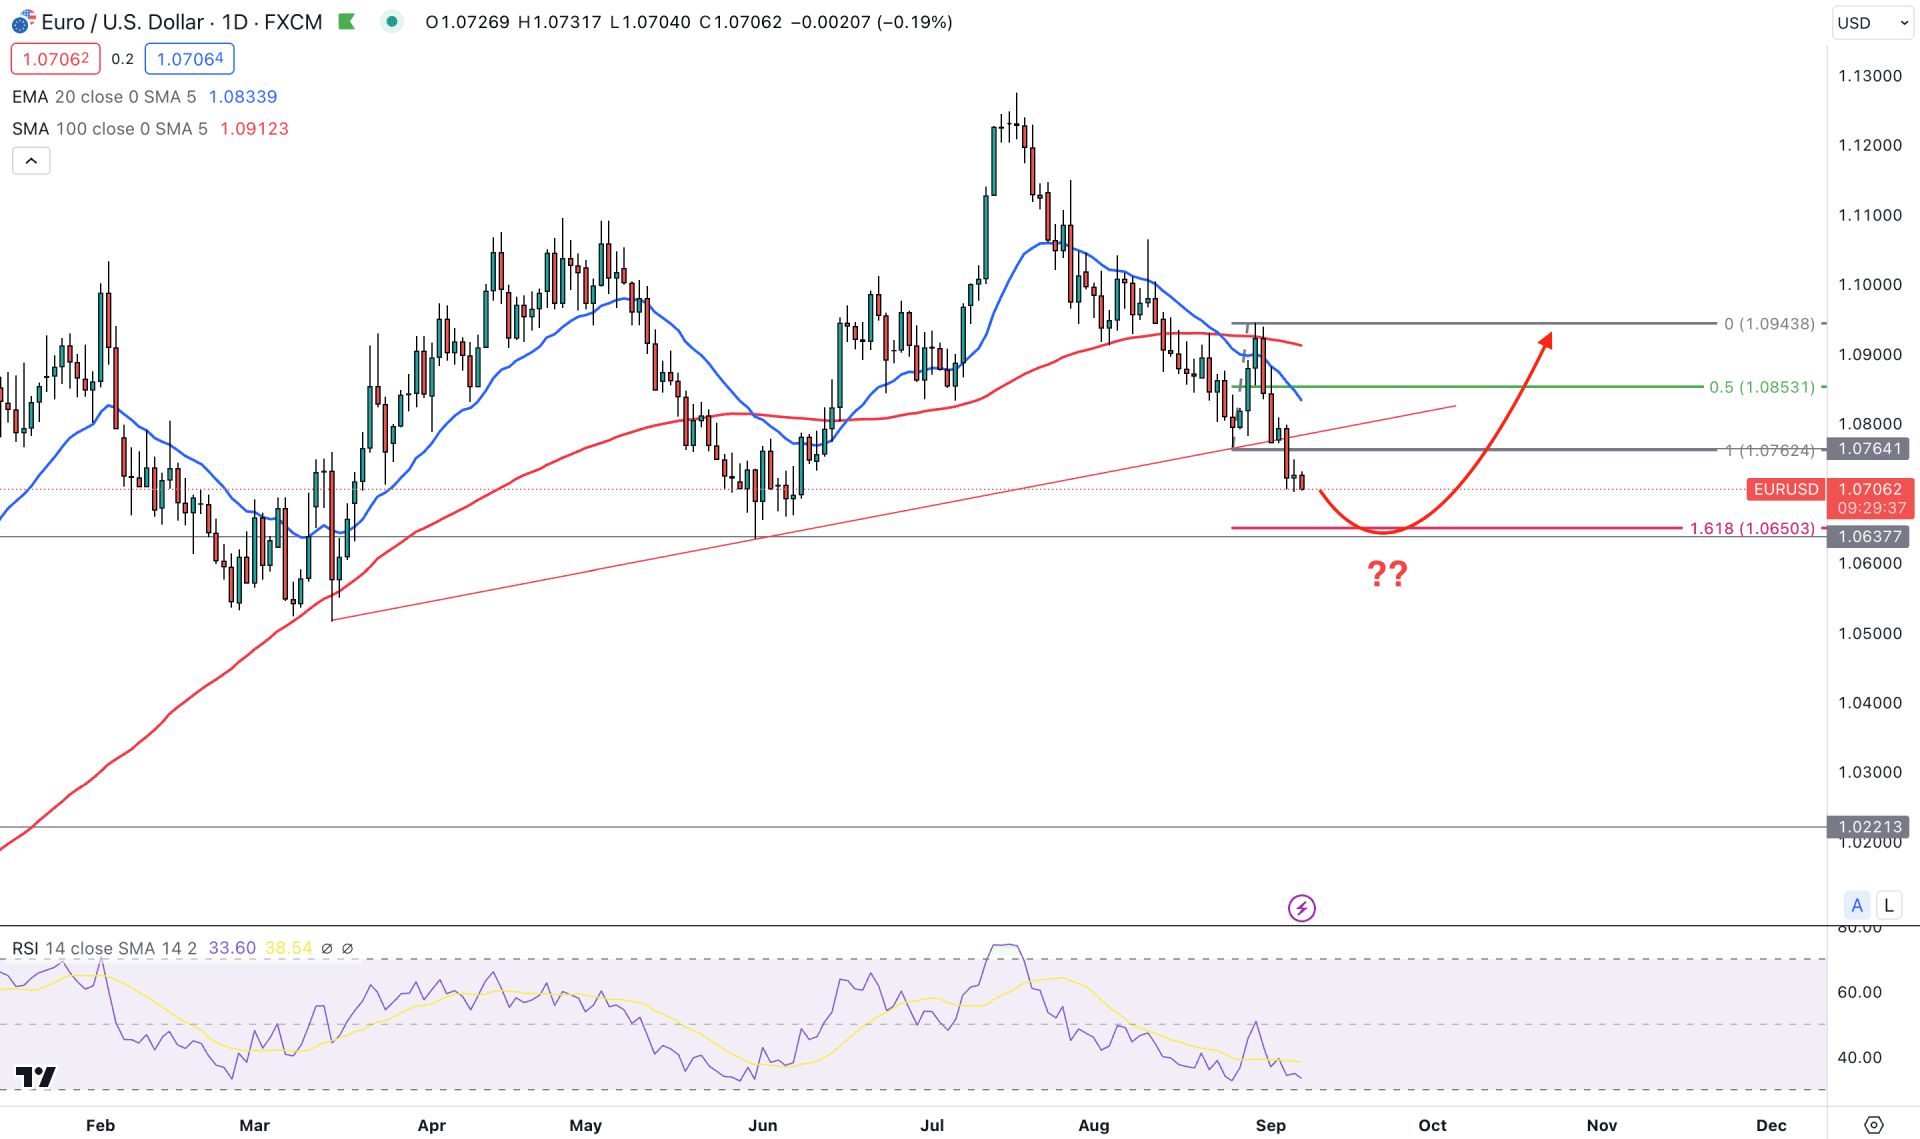
The daily chart shows the current price trades below 100 and 20 Moving average levels, backed by a bearish crossover. It signifies that medium and short-term traders are strongly bearish in this pair. However, the downward momentum is running for weeks, which may rebound after grabbing sufficient liquidity.
The current price is trading below the crucial support level of 1.0762, where the current 161.8% Fibo Extension from the 1.0943/1.1762 area is at the 1.10650 level. Currently, the 14-period Relative Strength Index is still above the 30.00 level, with a higher possibility of reaching below the oversold zone before showing a rebound.
Based on the daily outlook, an immediate bullish recovery with a daily candle above the 1.0650 level would be the aggressive bullish opportunity in this pair. However, a downward extension and a bullish exhaustion at the 1.1637 to 1.1600 zone would be another long opportunity. In both cases, the primary target area is the 1.0853 level.
On the bearish side, the price needs to consolidate at the 1.0650 to 1.0600 zone, indicating a bearish cross, targeting the 1.0500 level.
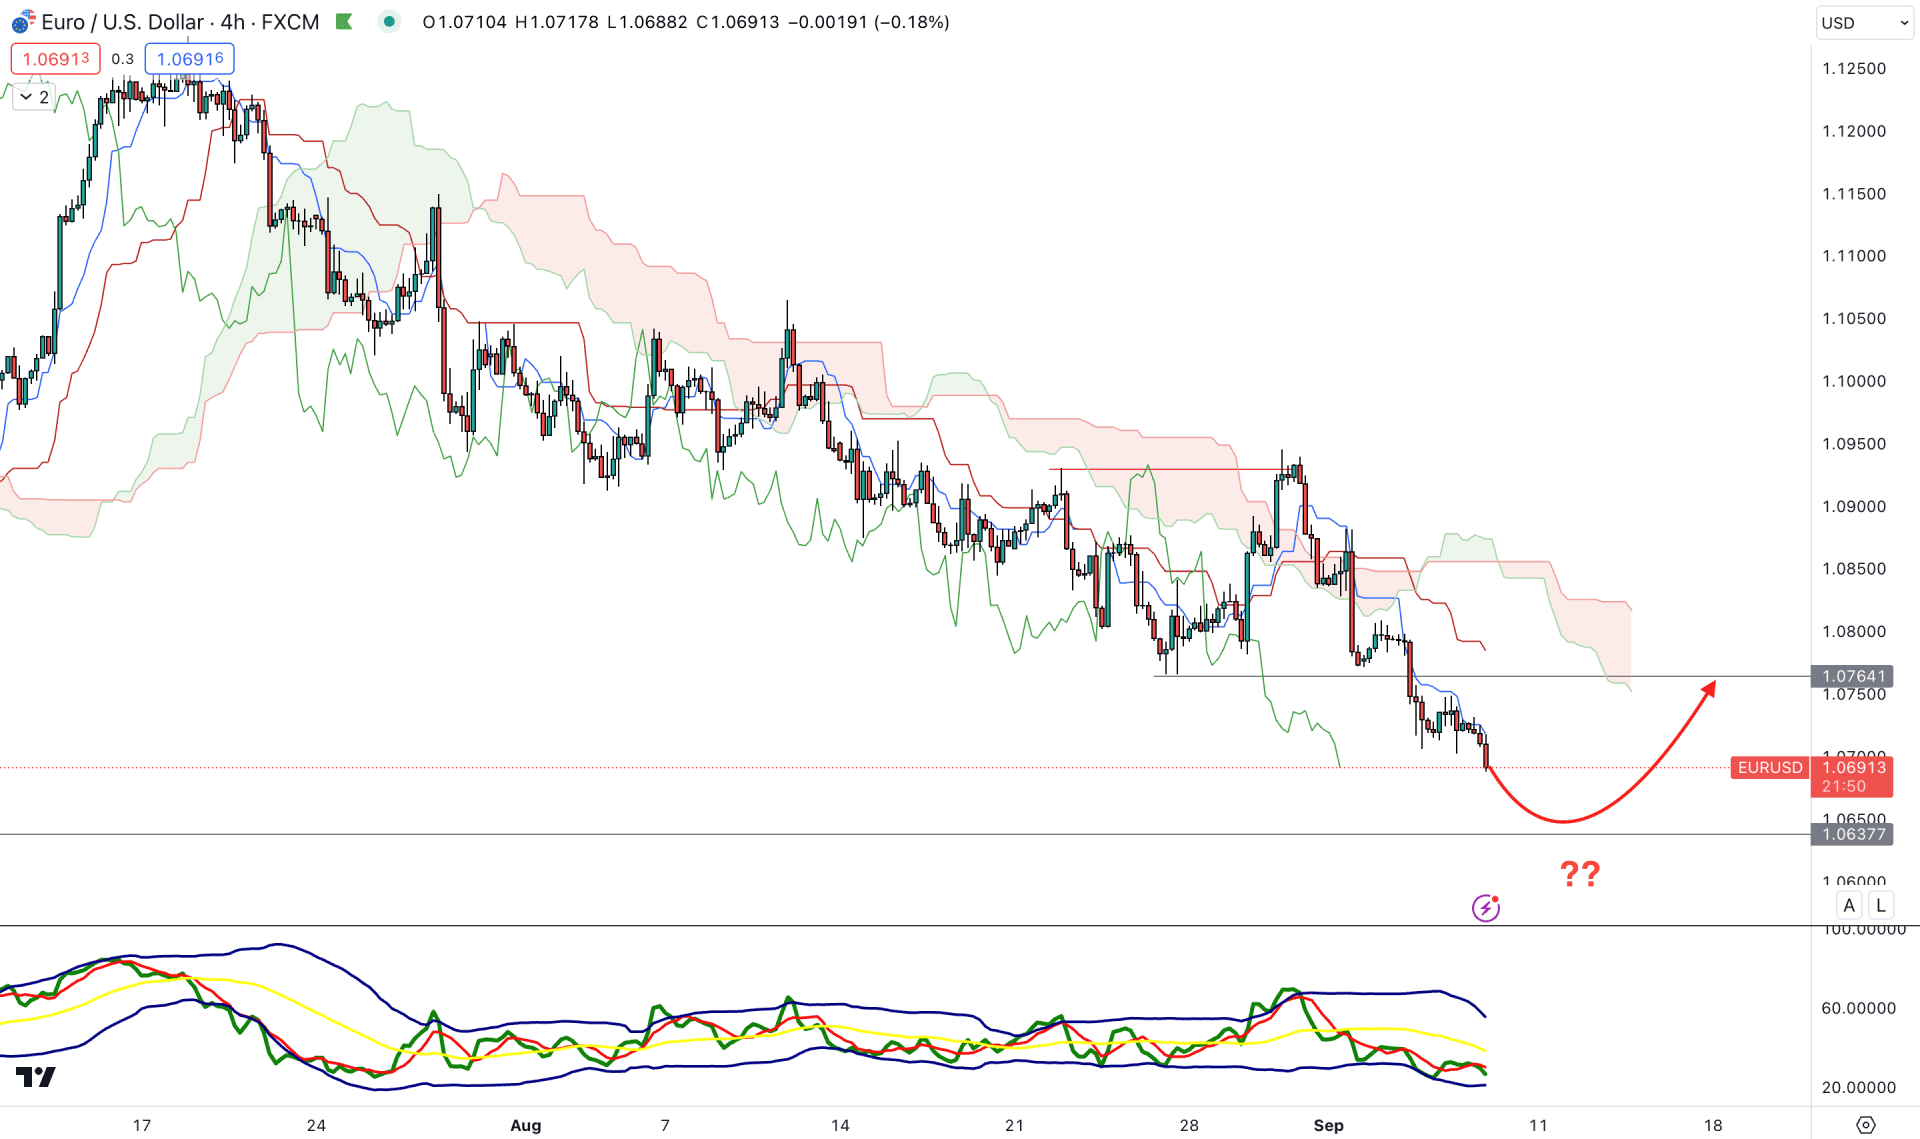
In the H4 chart, the current market momentum is bearish, initiated from the liquidity sweep at the 1.0929 high. A strong downside momentum is visible from the future cloud as both levels are showing a bearish turn.
In the indicator window, the TDI level shows strong selling pressure by holding the momentum below the 50.00 level. It is a sign that bears are active in the market and can increase the momentum in the coming hours.
Despite the strong downside possibility, a bullish mean reversion is pending as the dynamic Kijun Sen resistance is way above the current price. In that case, an immediate downside pressure towards the 1.0630 area could indicate a bullish correction at the dynamic Kumo Cloud area. On the other hand, further bearish rejection from the dynamic Kijun Sen level would lower the price towards the 1.0500 zone.
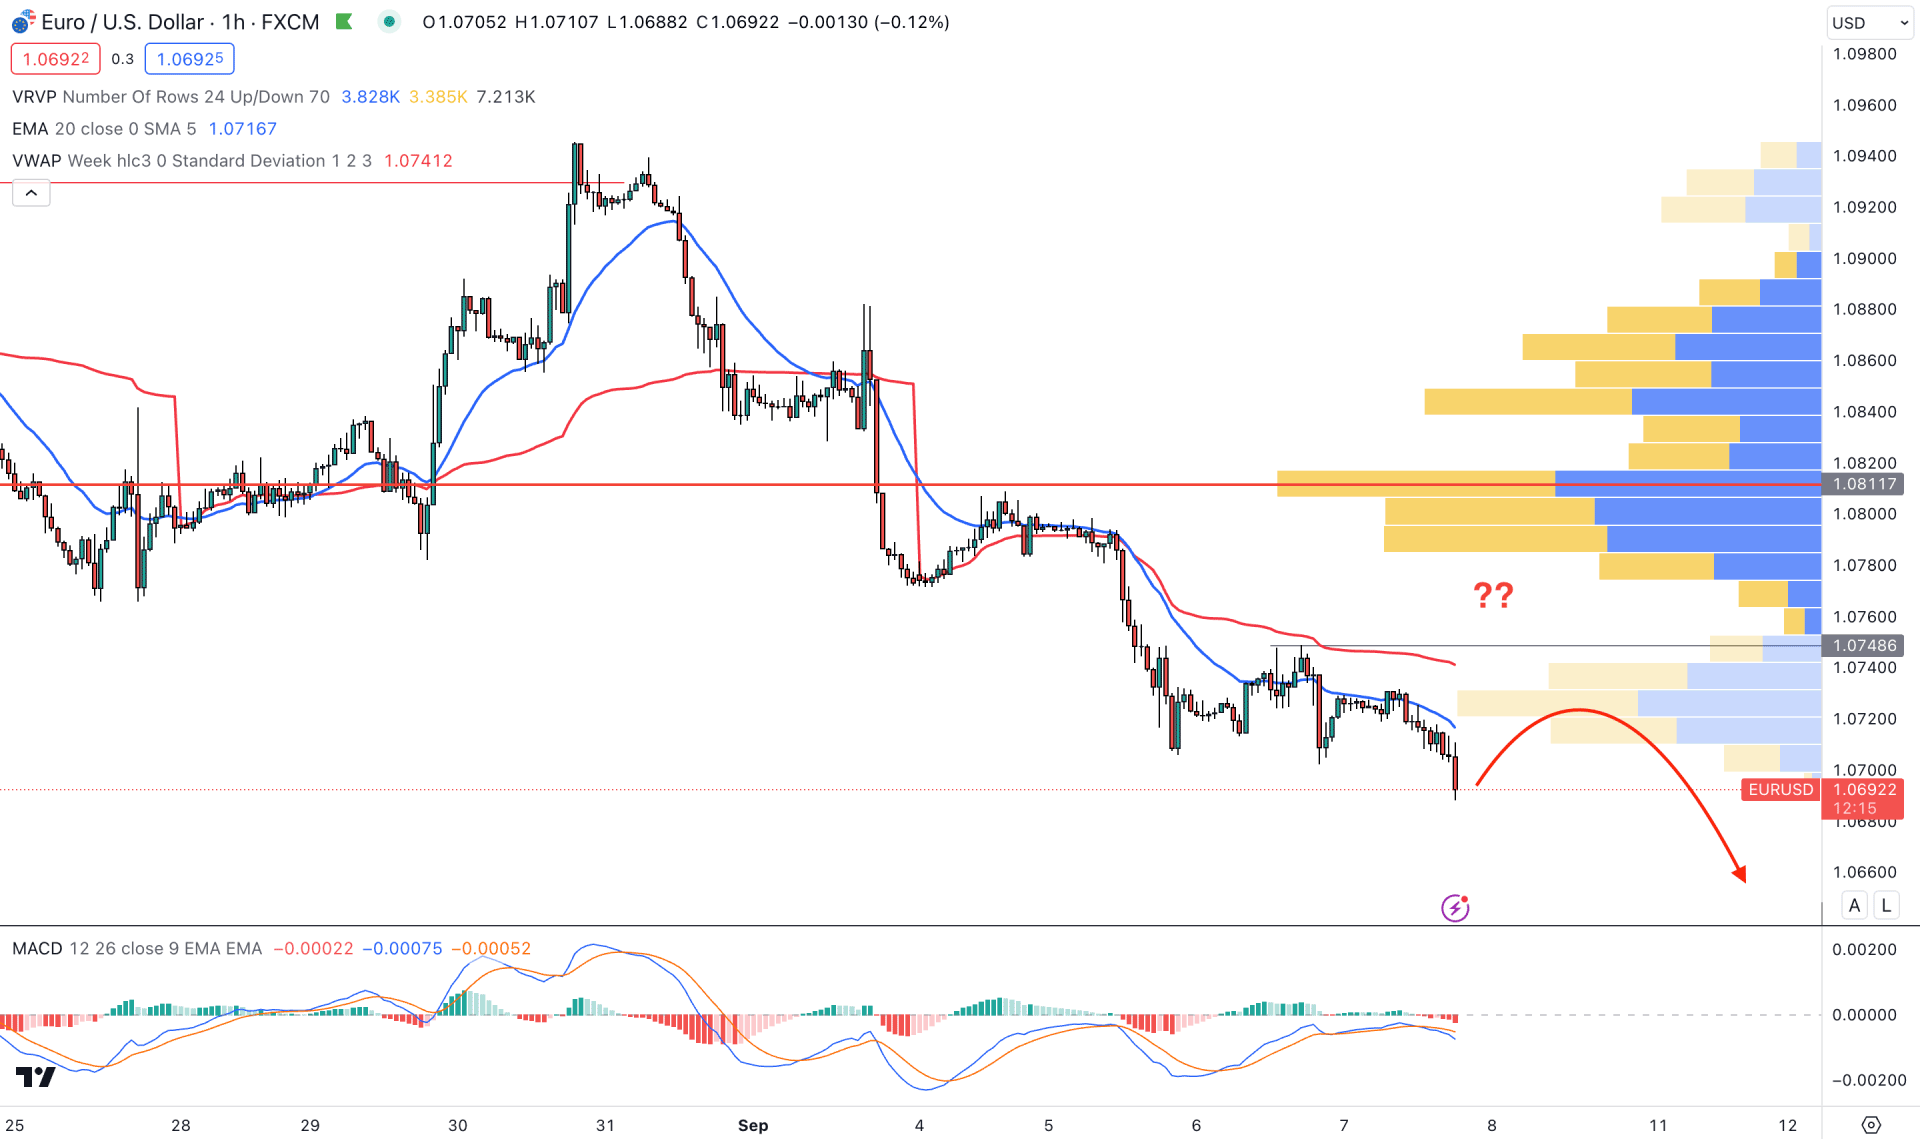
In the H1 chart, the current EURUSD price is trading below the dynamic 20 EMA and weekly VWAP, which suggests a strong bearish trend continuation opportunity. Moreover, the visible range high volume level is above this area, which would be the ultimate barrier for sellers.
As per the H1 price analysis, any upward correction and rejection from the VWAP resistance could indicate a bullish liquidity sweep and a bearish possibility towards the 1.0660 level. On the other hand, a new high volume level with a strong break above the VWAP level is needed to form a bullish reversal.
As per the current market context, EURUSD is still running within a strong bearish trend, which may extend to the marked Fibonacci Extension level. Before taking a bullish reversal, investors should closely monitor the price and find an exhaustion from the near-term level.


