Published: June 27th, 2024
The EURUSD pair recovered from its low of 1.0665, rising above the 1.0700 mark. Demand for the US Dollar declined despite a poor market tone. After Wall Street's dismal showing, Asian and European indices fell, limiting the USD's intraday fall and impeding any gains from the tech sector's comeback. However, once generally upbeat US economic data was released, the decrease in the value of the Greenback quickened.
The EURUSD pair was not greatly impacted by the earlier release of the Eurozone's June Economic Sentiment Indicator, which dropped 95.9 from 96 in May, below the anticipated 96.2.
Conversely, positive US data showed optimism for EURUSD bulls. Orders for durable goods increased by 0.1% month over month, outpacing the forecast decline of -0.1%. Furthermore, the US affirmed a 1.4% GDP growth rate marginally higher than the 1.3% estimate previously provided. 233K first claims for unemployment benefits were recorded for the week ending June 21, which is more than the projected 236K. The US will issue the June Kansas Fed Manufacturing Activity Index and the May Pending Home Sales later.
Let's see the future price direction of this pair from the EURUSD technical analysis:

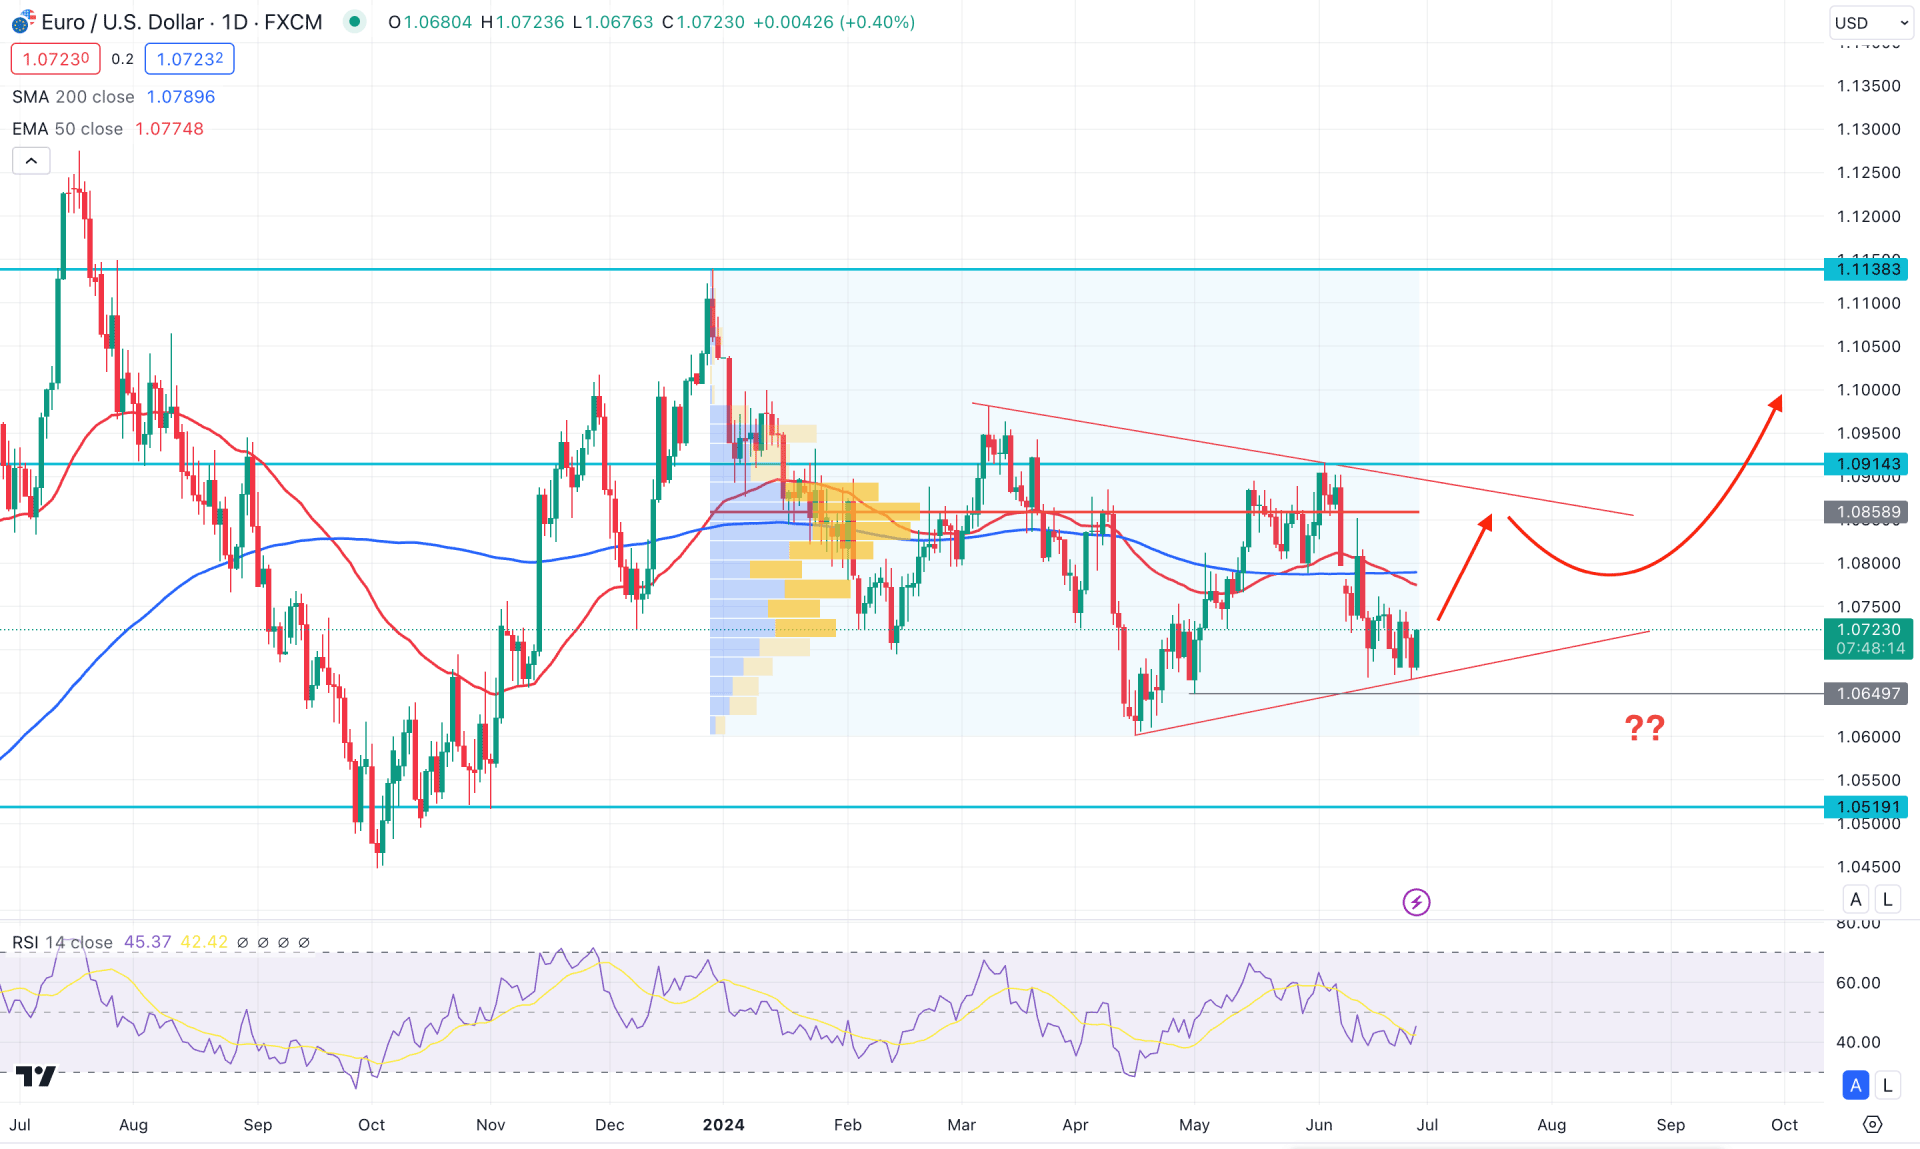
In the daily chart of EURUSD, the recent price shows extreme corrective momentum, from which a clear direction might come from a valid breakout.
Although sideways momentum is visible from the dynamic moving average level, the volume is still on the seller's side. Based on the fixed range high volume level indicator, the most active level since the beginning of 2024 is at the 1.0858 level, 1.25% higher than the current price. Based on this high volume level, we may expect a fresh bullish trend if the price overcomes this crucial level.
In the main chart, the 200-day simple moving average is above the current price, while the 50-day exponential moving average showed a bearish crossover. It signifies that long-term and medium-term traders are bearish, creating a short-term selling opportunity. However, investors should find more clues before picking a trend, as the flat moving average line might provide a false signal until a breakout happens.
On the other hand, the trend line support and resistance form a symmetrical triangle, with the most recent price at triangle support. Therefore, if the price can hold the triangle support and show intraday buying pressure, we may expect a range extension above the high volume level.
In the indicator window, the Relative Strength Index also remains flat below the 50.00 line, indicating a potential break to the 30.00 oversold point.
Based on the daily market outlook of EURUSD, a long-term bullish trend might appear if the price breaks out from the symmetrical triangle resistance and holds a stable market above the 1.0900 psychological level. That price is more likely to extend pressure and test the 1.1138 resistance level before heading towards the 1.1300 area.
On the bearish side, minor selling pressure is seen from the dynamic 50-day exponential moving average. Any selling pressure could take the price toward the 1.0649 support level.

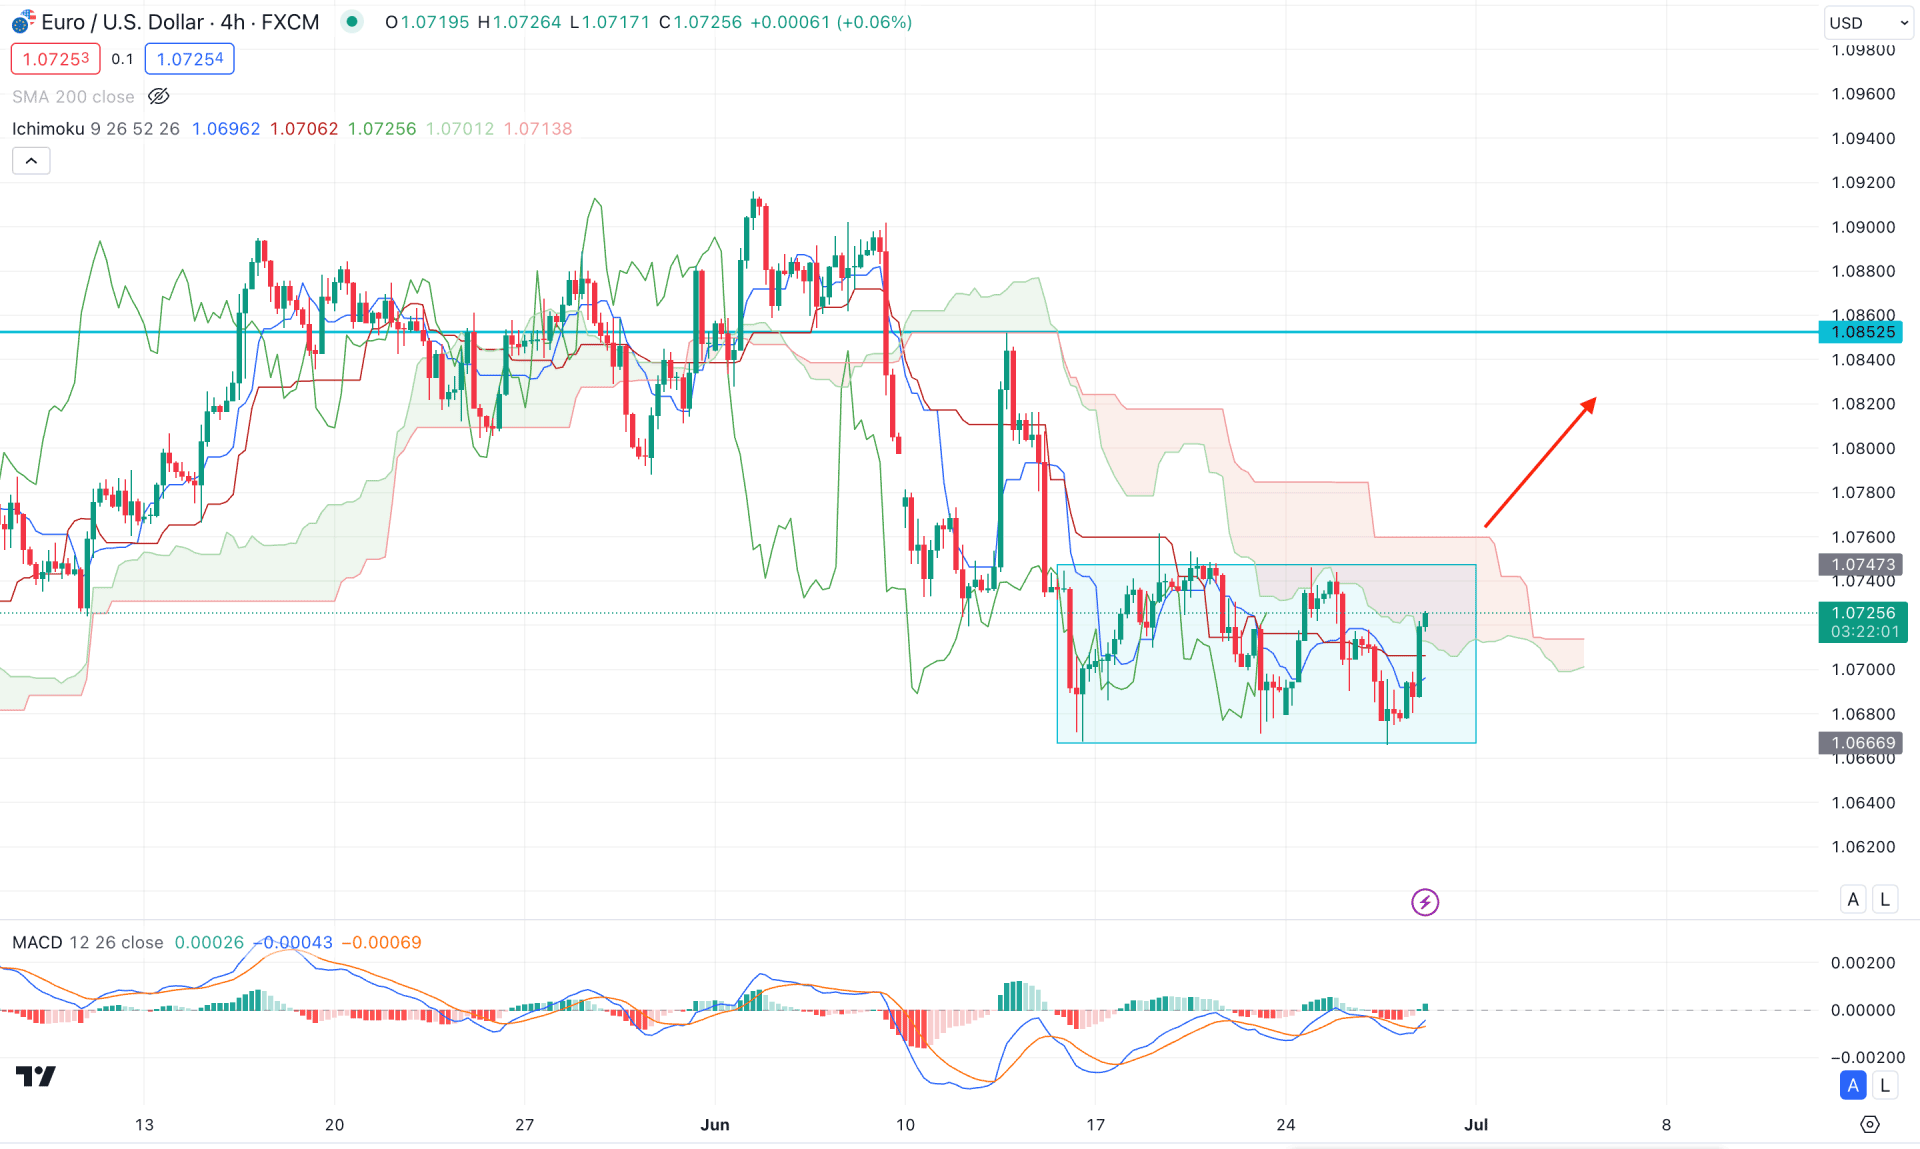
In the H4 timeframe, the current price trades sideways within the rectangle pattern, where the near-term resistance is found from the Ichimoku Cloud zone. Therefore, as long as the current price trades below the cloud high, we may expect the downside momentum to continue in the coming session.
In the indicator window, a clear divergence is visible from the MACD signal line, which fails to follow the lower low formation in the main price swing. Moreover, the recent price moved above the dynamic Kijun Sen line, creating a short-term bullish opportunity.
Based on the H4 outlook, a bullish continuation with a breakout above the rectangle pattern could offer a decent bullish opportunity, aiming for the 1.0852 resistance level. However, any immediate bearish rejection with an H4 candle below the Kijun Sen level might lower the price below the Rectangle low.

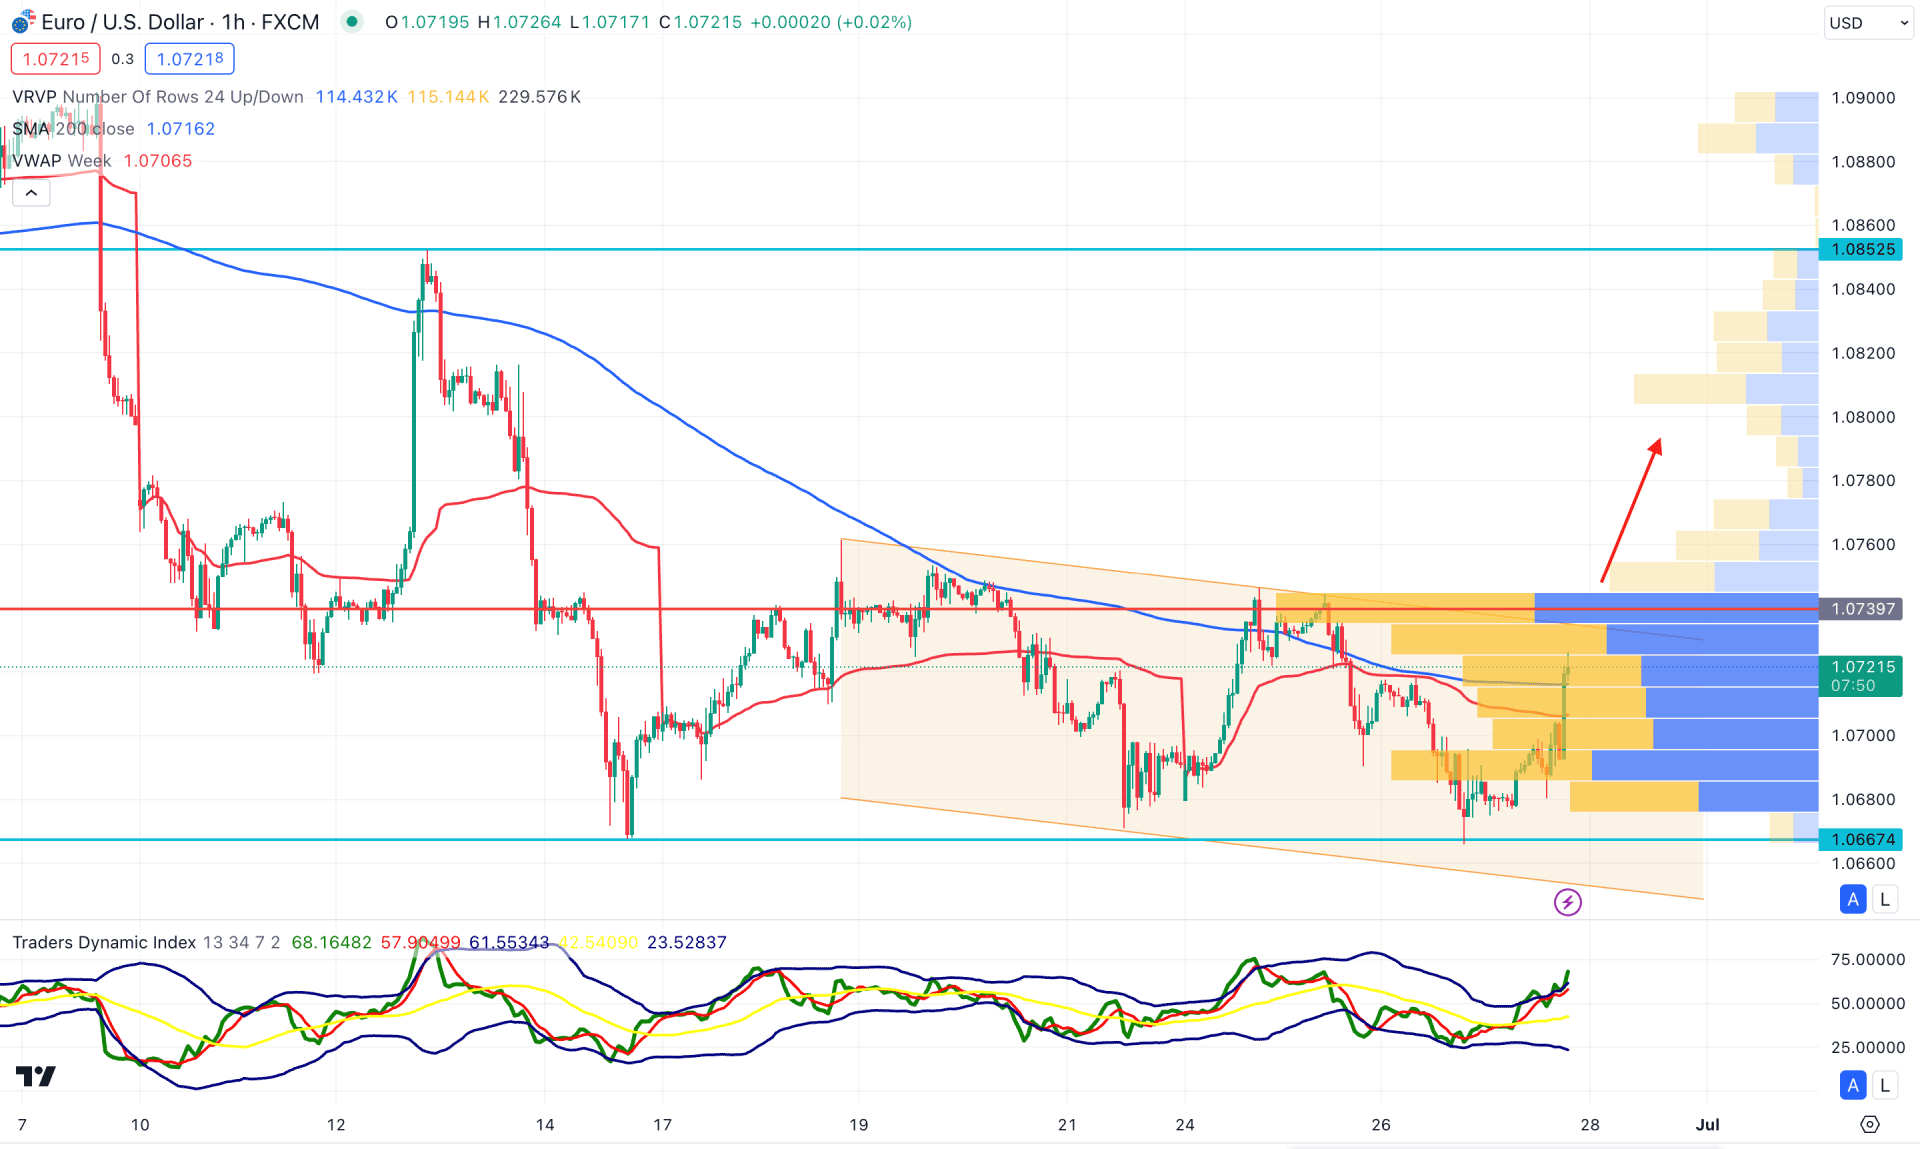
In the H1 chart, the current price of EURUSD is trading below the visible range high volume level, suggesting ongoing bearish pressure. However, the extreme buying pressure with an hourly candle above the 200 moving average might test the high level soon.
In the indicator window, the traders' dynamic index extended above the neutral 50.00 level and reached the overbought area, indicating ongoing buying pressure.
Based on the outlook for hourly candles, a bullish break from the 1.0739 high level could activate the long-term buying opportunity targeting the 1.0860 level. However, immediate selling pressure below the weekly VWAP level could extend the loss below the 1.0600 level.
Based on the current multi-timeframe analysis, EURUSD is more likely to extend the bullish correction towards the triangle resistance. However, a long-term bullish trend might form after having a valid triangle breakout.