
Published: August 21st, 2025
After being turned down at 1.1675 on Wednesday, the pair dropped to the 1.1650 region. With political influence mounting on the Federal Reserve (Fed) before Chairman Jerome Powell's statement on Friday, the US dollar is still strong. Meanwhile, in Europe, everyone's attention is focused on August's initial Purchasing Managers' Index (PMI) announcement, which is scheduled later today.
Two policymakers polled in favor of an interest rate drop in August, according to the minutes of the most recent Federal Open Market Committee (FOMC) meeting. Furthermore, Federal Governor Lisa Cook stated that she claims "no desire to be bullied out of her position" in response to US President Donald Trump's requests for her resignation.
The reliability of the US dollar is weakened by Trump's assaults on the Federal Reserve, which puts at risk the independence of the central bank. Before Fed Powell's statement at the Jackson Hole symposium, investors were still skeptical of playing against the USD.
Europe shows overall positive outlook in PMI data, which indicates a moderate decrease in economic activity. This would confirm the concerns raised by Christine Lagarde, president of the European Central Bank (ECB), who warned about financial instability and predicted softer growth in the next six months.
Let's see the complete price outlook from the EURUSD technical analysis:
In the daily chart of EURUSD, the ongoing market momentum is bullish as the price is aiming higher from left to right. As a strong bullish rebound is visible from the near-term dynamic line, investors might expect a bullish continuation soon.
Looking at the higher timeframe, the ongoing momentum is also bullish, where the current price is trading within the bearish body of July 2025. However, the ongoing price is still trading higher above the July 2025 low, signalling a bullish trend. In that case, the buying pressure is valid as long as the price trades above the 1.1354 monthly support.
Moreover, the weekly price is trading within a sideways momentum, in line with the trendline resistance. As the existing market momentum is bullish, a more bearish correction might appear as long as the resistance is protected.
In the volume structure, the largest activity level since January 2025 is below the current price, working as a major support. As long as the high-volume line remains below the current price, we may expect the upward pressure to extend. However, the current price is facing a trendline resistance followed by a strong gap with the high volume line. In that case, a failure to overcome the trendline resistance could offer an extended bearish correction.
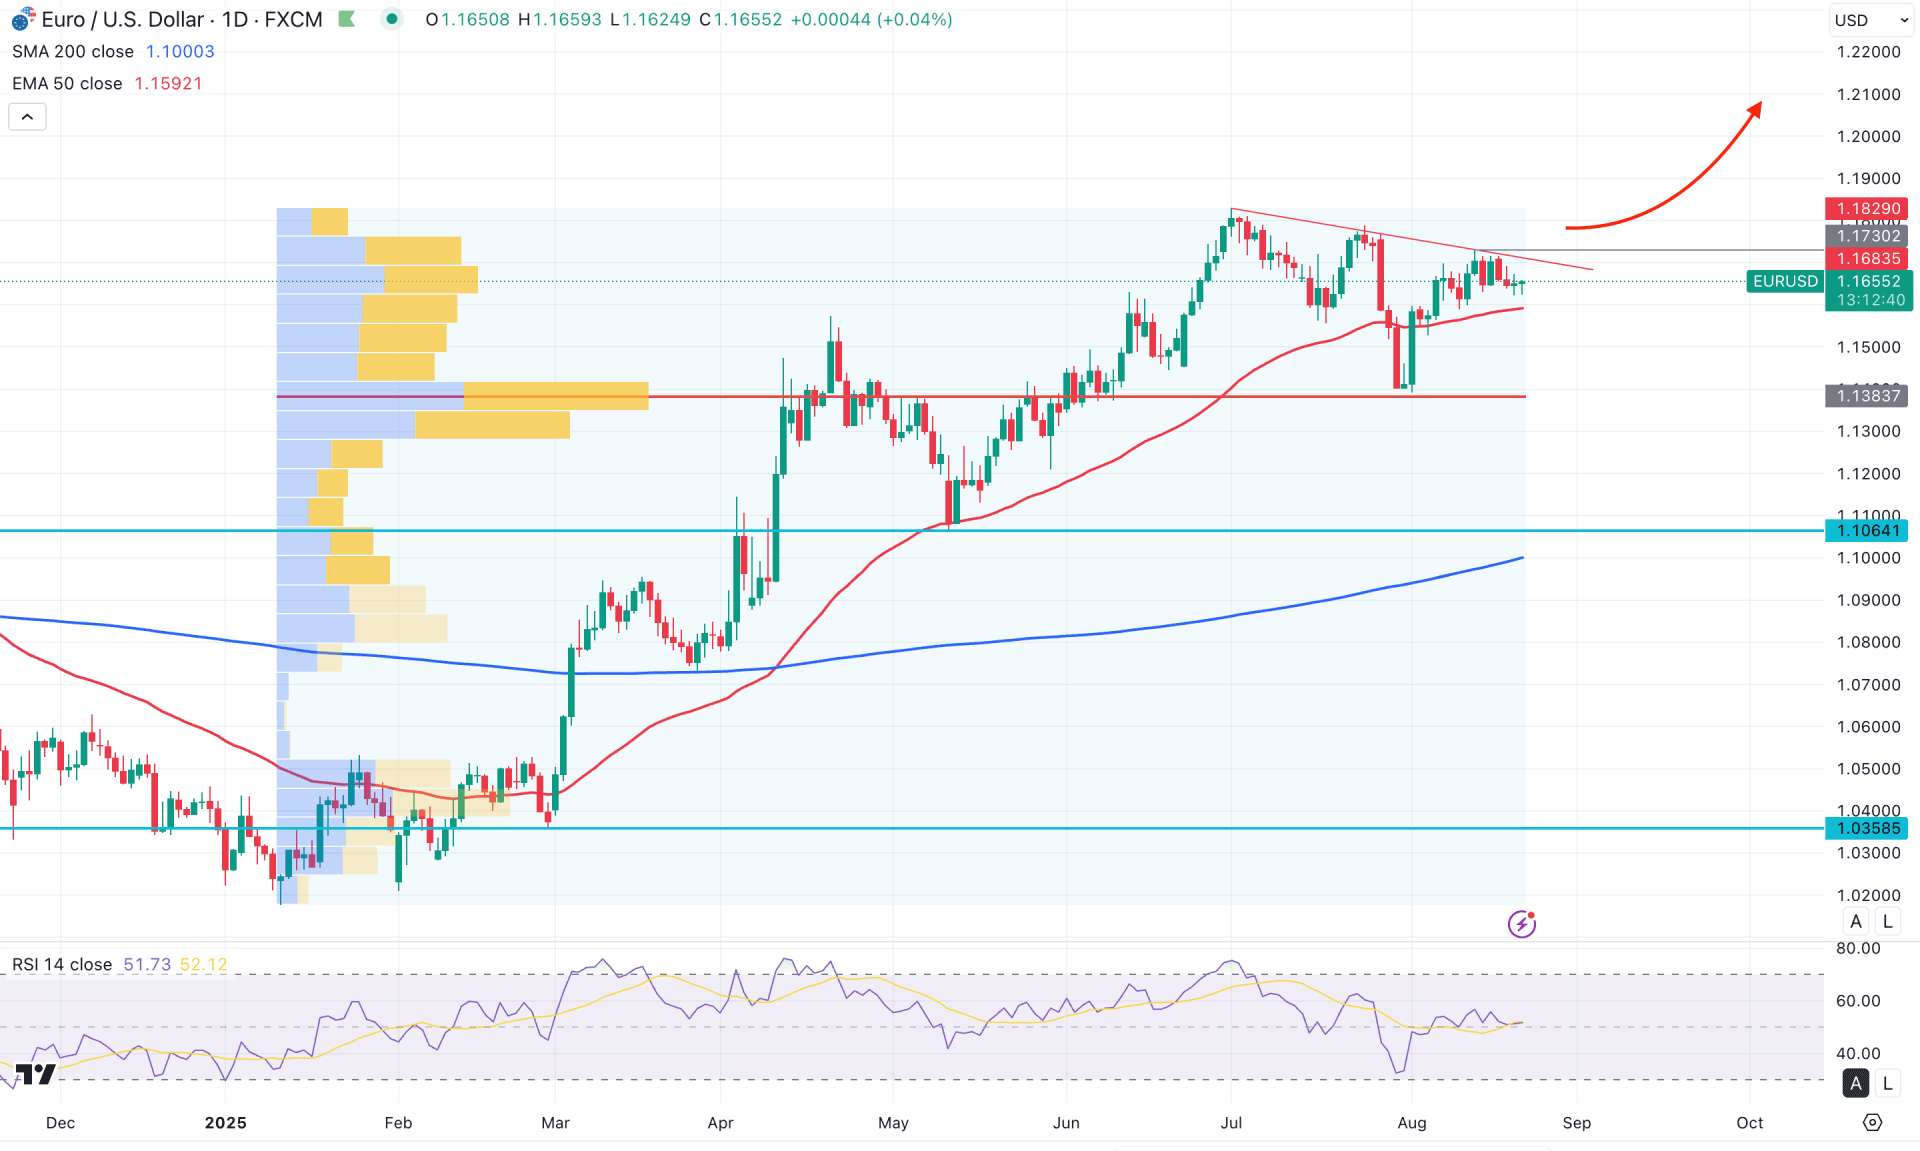
In the main price chart, the major market trend is bullish, signalled by the upward slope in the dynamic 200-day Simple Moving Average.
In the near-term price action, the 50-day EMA is close to the current price and acting as a bullish trend carrier. As a result, the price has formed a strong bullish reversal from the 50-day EMA line, suggesting that the upcoming price direction could remain bullish.
In the indicator window, the Relative Strength Index (RSI) has also flipped from the lowest area, with the current line moving above the 50.00 neutral level. Since the RSI is consolidating around the midpoint, a bullish signal on the main price chart could extend the upward pressure until the RSI reaches the overbought zone above 70.00.
From a broader market structure perspective, a breakout of the bullish trendline with a daily close above the 1.1730 level could present a high-probability opportunity, with the main target at the 1.2037 Fibonacci Extension level.
On the other hand, the price is still facing resistance from the falling trendline, while multiple support levels remain intact below the current price. In that case, a minor downside correction toward the 1.1383 level is possible. A clear bearish break below the 50-day EMA with a daily close would be required to confirm further downside pressure. However, the overall market remains bullish as long as the price trades above the 50-day exponential moving average.
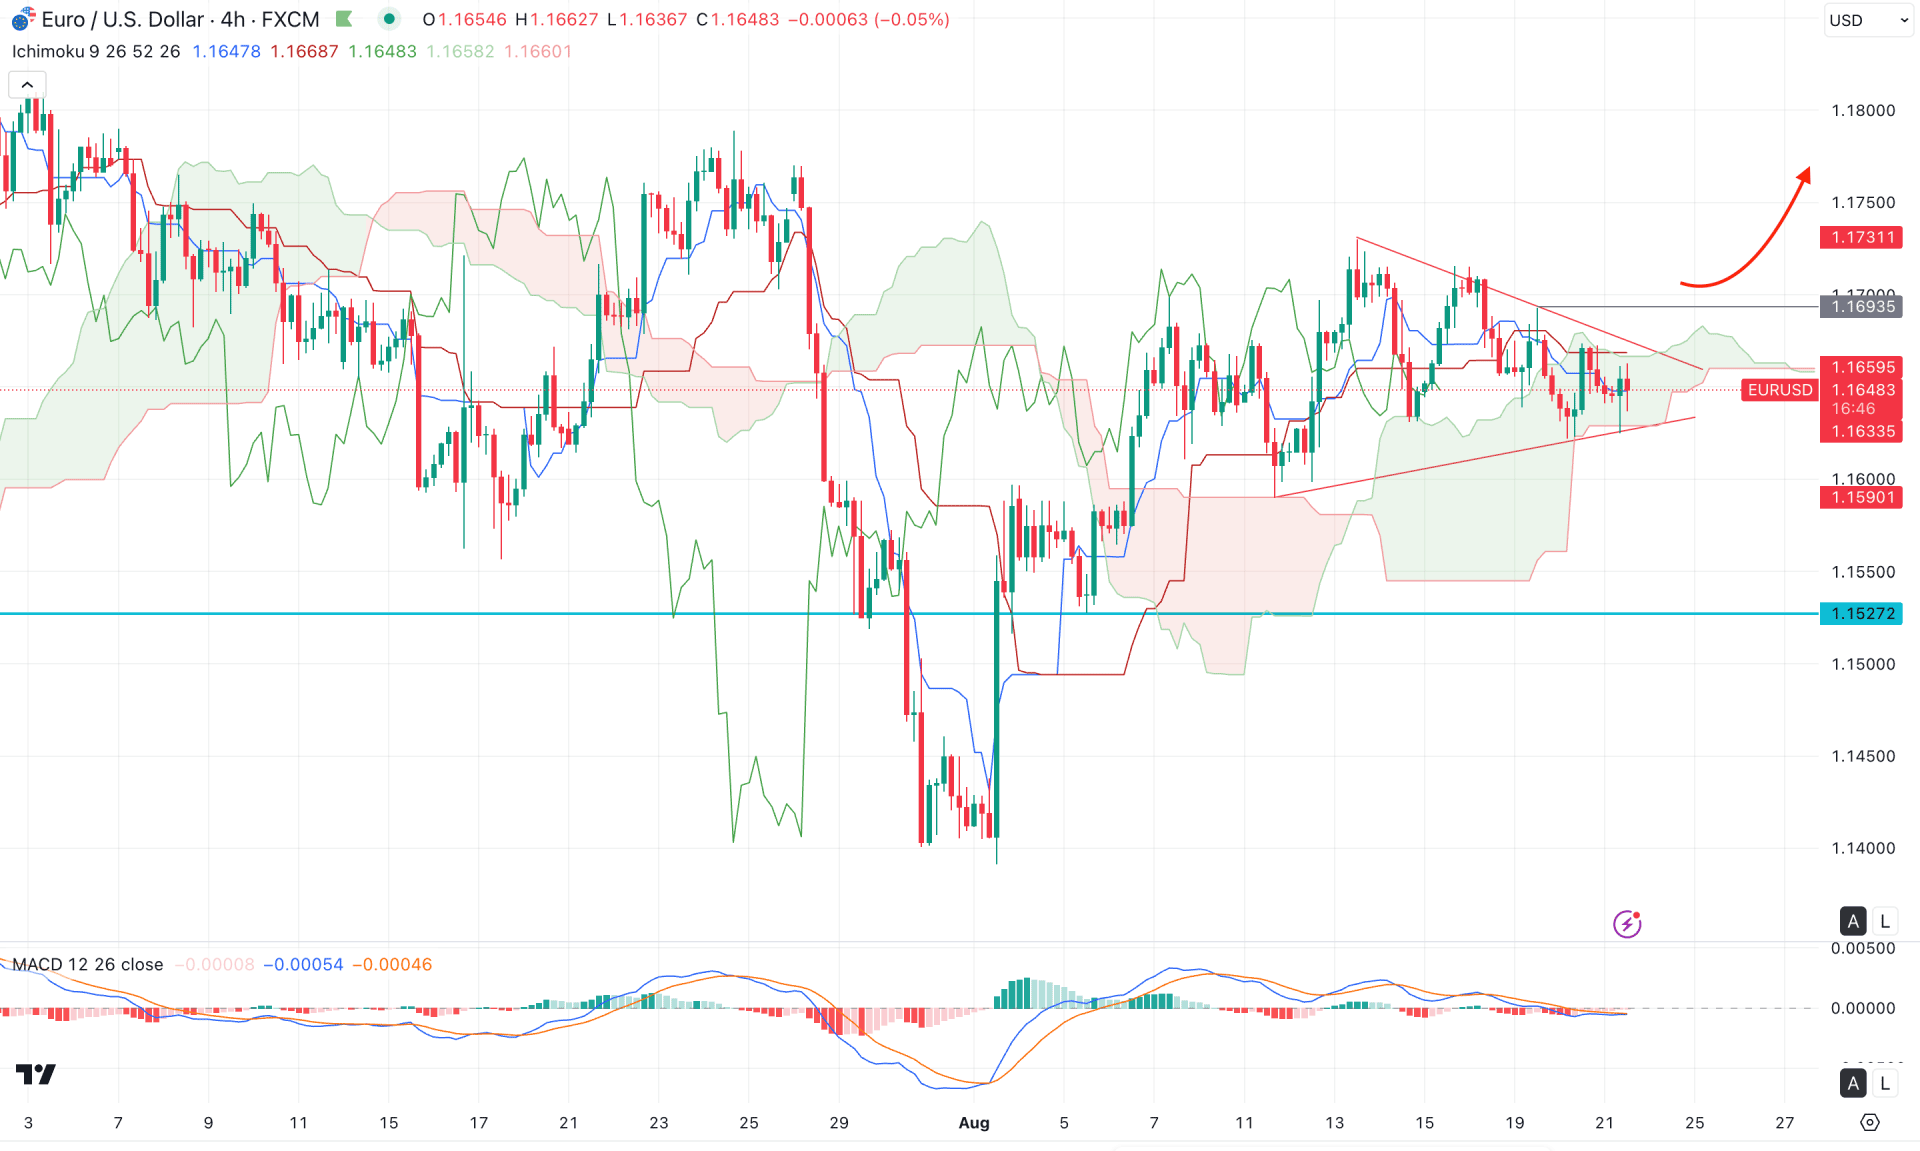
In the four-hour time frame, the ongoing market momentum is sideways after a solid bullish recovery from the 1.1400 psychological level. As the price is still hovering around the Ichimoku Cloud area, any strong bullish push could initiate a long opportunity.
According to the cloud indicator, the future cloud looks sideways as both Senkou lines have converged. Moreover, the price has moved below the immediate dynamic key zone baseline, signaling corrective pressure.
In the indicator window, corrective momentum is also visible as the MACD signal line has failed to show significant fluctuations. Meanwhile, the histogram has lost its bullish pressure and moved closer to the neutral area.
Based on the overall market structure, EURUSD is trading within a sideways momentum. A bullish breakout above the 1.1693 level with a four-hour close could be a potential long opportunity. On the bullish side, the immediate level to watch is 1.1800, followed by the 1.2000 level.
On the other hand, failure to hold the price above the 1.1527 support level could be an alarming sign. In that case, a deeper correction is possible towards the 1.1600–1.1550 area. A break below this zone would invalidate the bullish outlook.
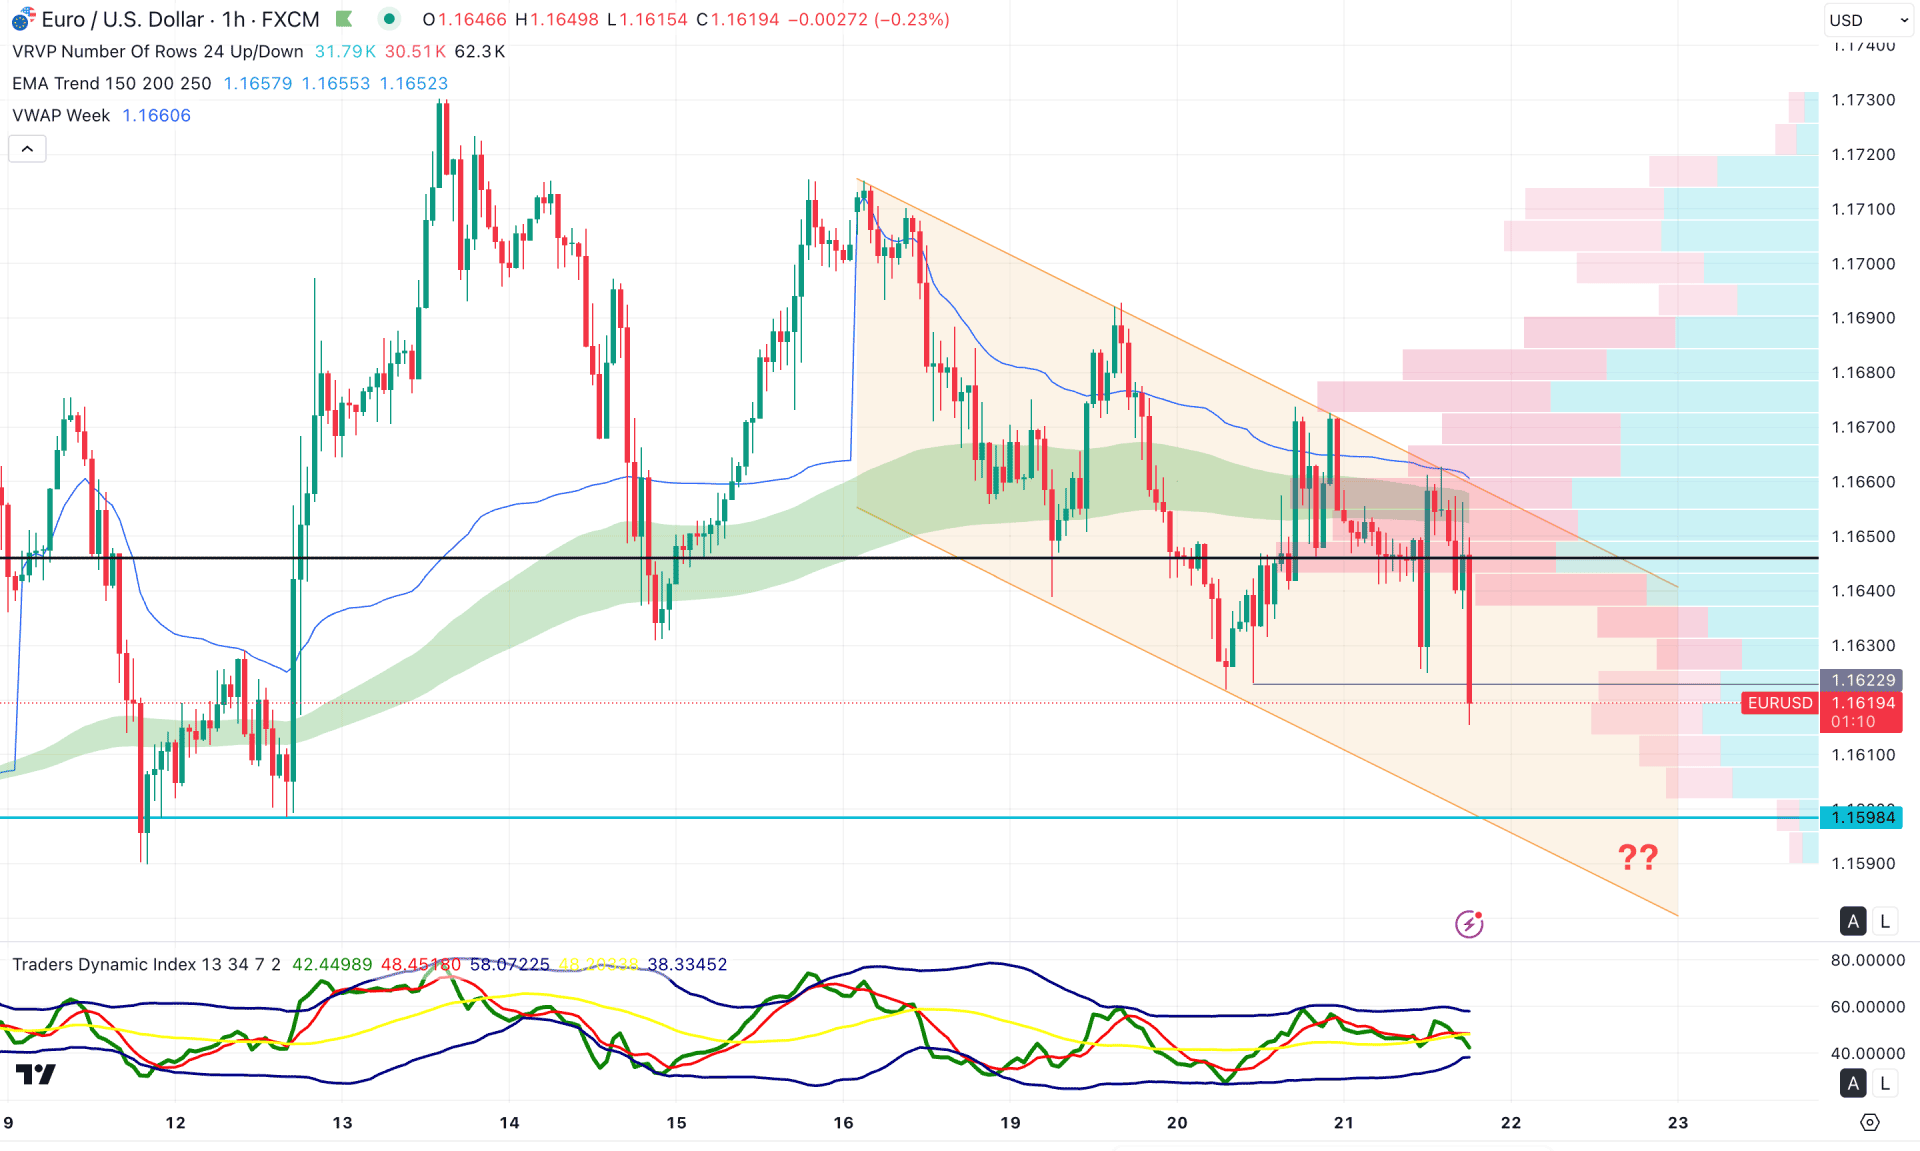
In the hourly timeframe, the price is moving within a descending channel, where the nearest resistance is visible from the high-volume level. Moreover, the weekly VWAP level is positioned above the current price, sloping downward in line with the exponential moving average.
In the secondary indicator window, the Traders Dynamic Index has formed a bearish crossover, with the current line hovering below the 50.00 neutral point. Based on this indicator structure, selling pressure is present; however, the strength of this bearish momentum appears weak.
Considering the overall market structure, investors should monitor how the price reacts near the discounted zone as it approaches the channel bottom. In this case, any bullish recovery from the 1.1622–1.1598 area could present a potential long opportunity. Alternatively, an immediate buying pressure with an hourly close above the 1.1650 level could provide an early long entry targeting the 1.1730 level.
In both scenarios, a confirmed breakout above the channel resistance is crucial before validating a sustainable long opportunity. Failure to hold above the 1.1640 level could be a challenging factor for bulls, as it may extend the range further toward the 1.1590 level.
Currently, EURUSD is trading within a resistance zone while remaining inside a descending channel. Furthermore, the price is facing pressure from the downward sloping trendline resistance. In this scenario, only a strong bullish push with a valid trendline breakout could extend the broader bullish trend. However, until such a breakout occurs, the pair remains vulnerable to further downside momentum.


