
Published: December 1st, 2021
Inflation is a matter of concern in both the US and Eurozone. The current CPI inflation is at 6.2% in the US, which is the highest level in more than 30 years. On the other hand, the Eurozone’s inflation has moved up to 4.9%, also the highest record. Although inflation is higher, the labor market and wage growth are also high.
Investors should closely monitor whether central banks tighten the monetary policy to support the inflation pressure or keep boosting employment in the divergent situation. However, according to many analysts, the possibility of tightening the monetary policy is high. The Fed has a higher chance of increasing the tapering pace at the December meeting with the possibility of three rate hikes in 2022. On the other hand, the ECB may remain patient about the rate hike.
On the other hand, the current increase in Omicron cases around the US and the Eurozone might keep the financial market volatile. Investors should closely monitor how the infection report is coming with close attention to the upcoming Non-Farm Payroll on Friday.
Let’s see the upcoming price direction from the EUR/USD technical analysis:
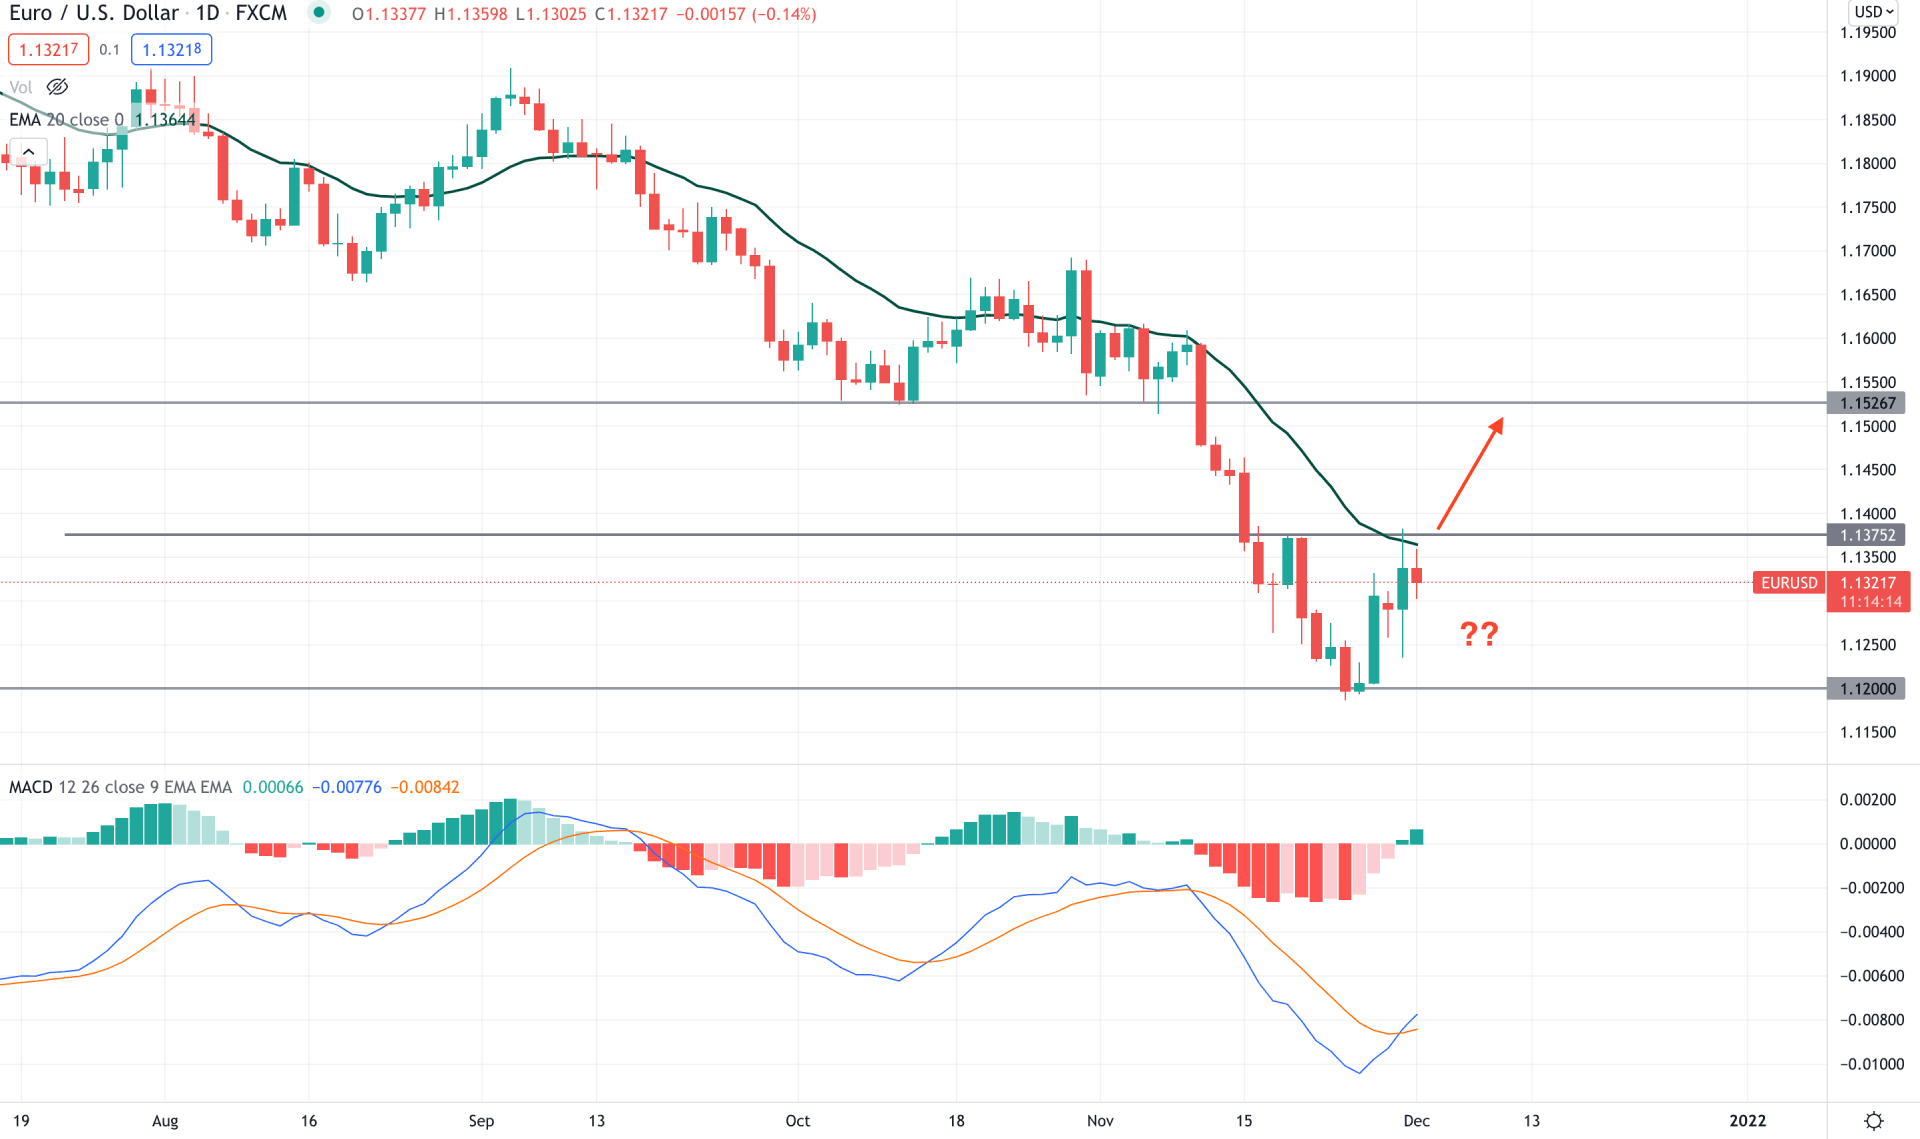
EURUSD remained within a definite bearish trend where the price made consecutive lows since the beginning of Q2. Moreover, the bearish pressure became aggressive after breaking below the 1.1526 event level, pushing the price down towards the 1.1200 level. However, the bears failed to hold the price below the 1.20 level and a bullish rejection candle appeared in the daily chart.
The above image shows that the MACD Histogram shifted to PNP formation where the current price is facing resistance from the dynamic 20 EMA. Moreover, the static resistance of 1.1375 is above the price, providing more resistance to the current buying pressure. In this market context, investors should closely monitor how the price reacts on the 1.1375 level. A break above this level, with a bullish daily candle, would open rooms for testing the 1.1526 level.
The current price is still below the dynamic resistance of 20 EMA, where a new intraday low with a negative MACD Histogram would increase the selling pressure towards the 1.1150 area.
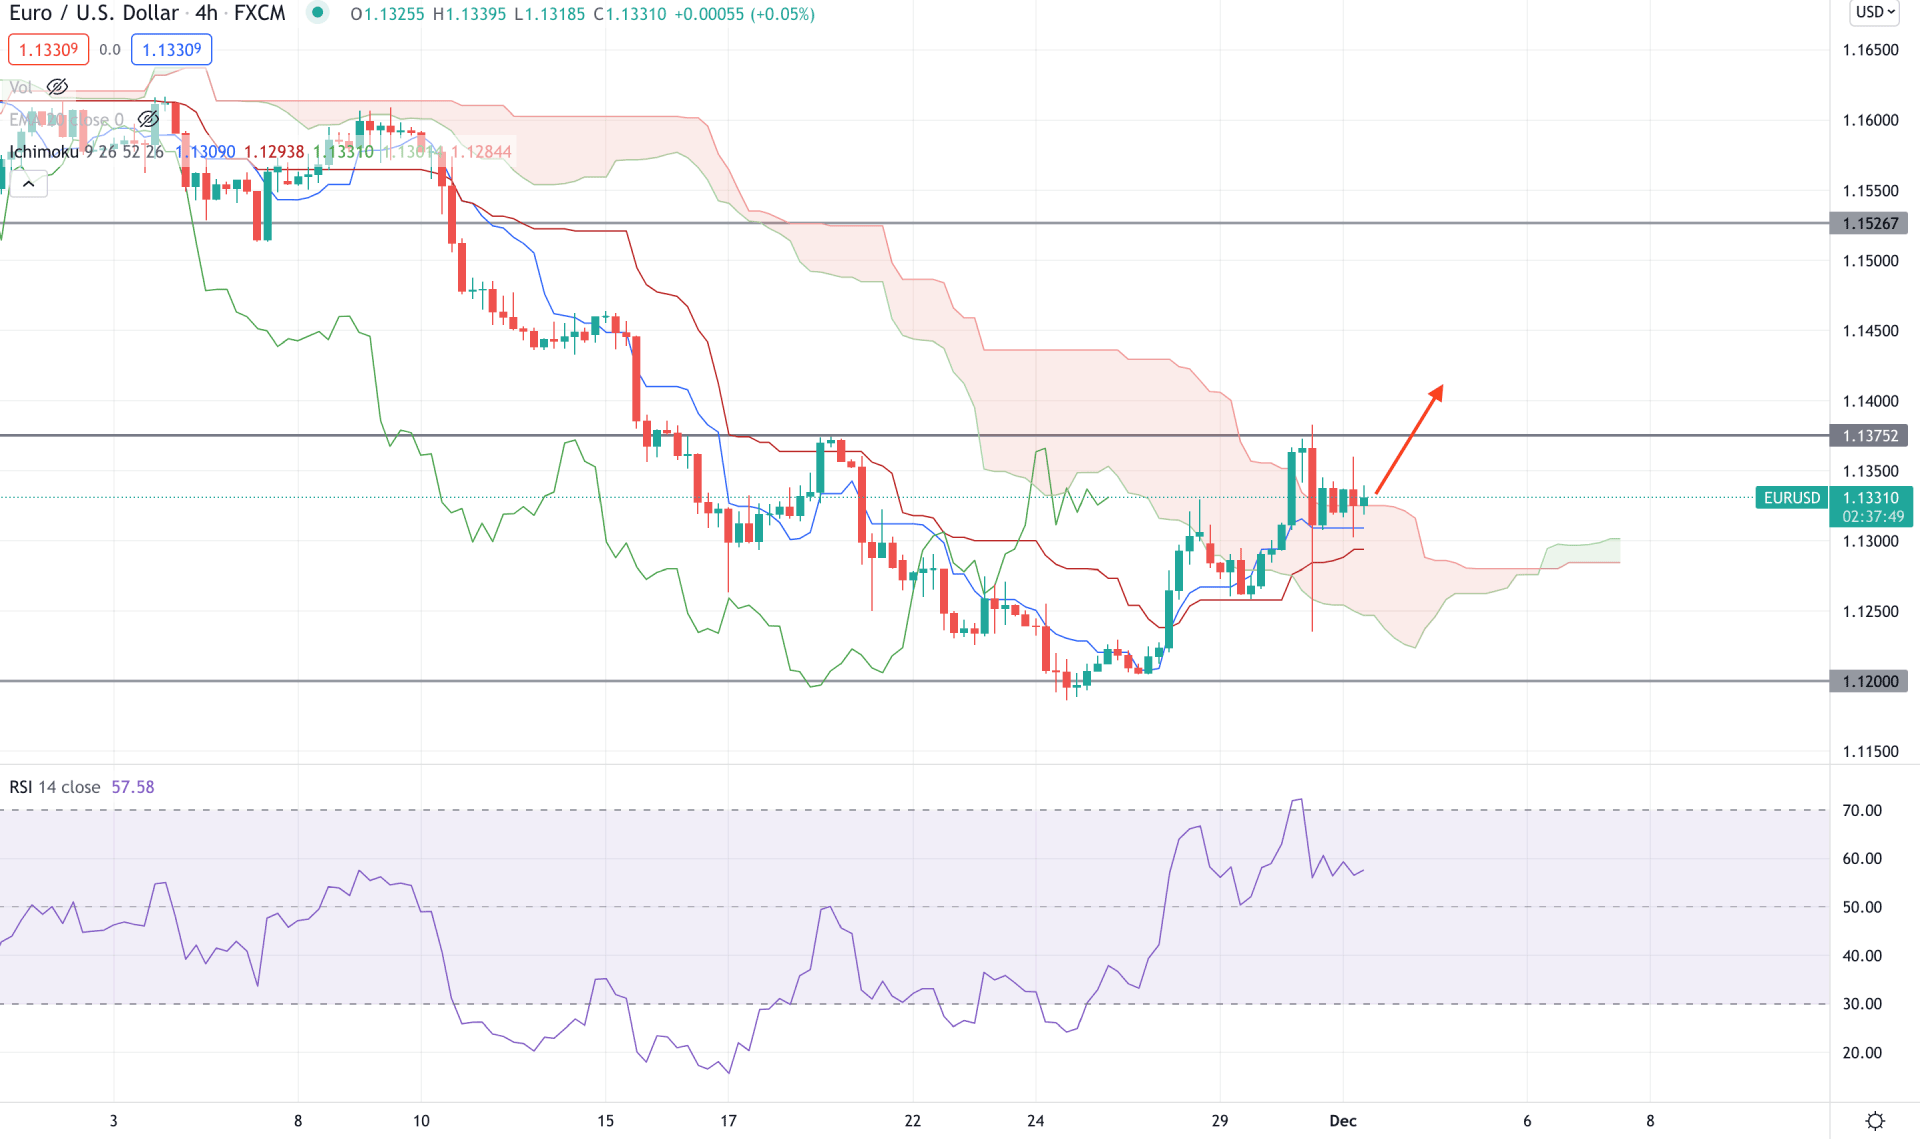
In the H4 timeframe, the market scenario is different. According to the Ichimoku Cloud, the current price moved above the Kumo Cloud, where the Future Cloud is bullish and aiming higher. Moreover, the current bullish pressure above the dynamic Kijun Sen is backed by great exhaustion, a sign of bear’s failure.
The above shows how the dynamic Tenkan sen and Kijun Sen are working to support the price. Moreover, in the indicator window, RSI is still bullish above the 50 levels, where another upside pressure towards the overbought 70 levels would increase the buying pressure.
Based on the H4 context, a bullish H4 close above the 1.1375 is more likely to take the price higher towards the 1.1526 level in the coming days. On the other hand, any bearish pressure below the 1.1260 cloud support may lower the price towards the 1.1150 area.
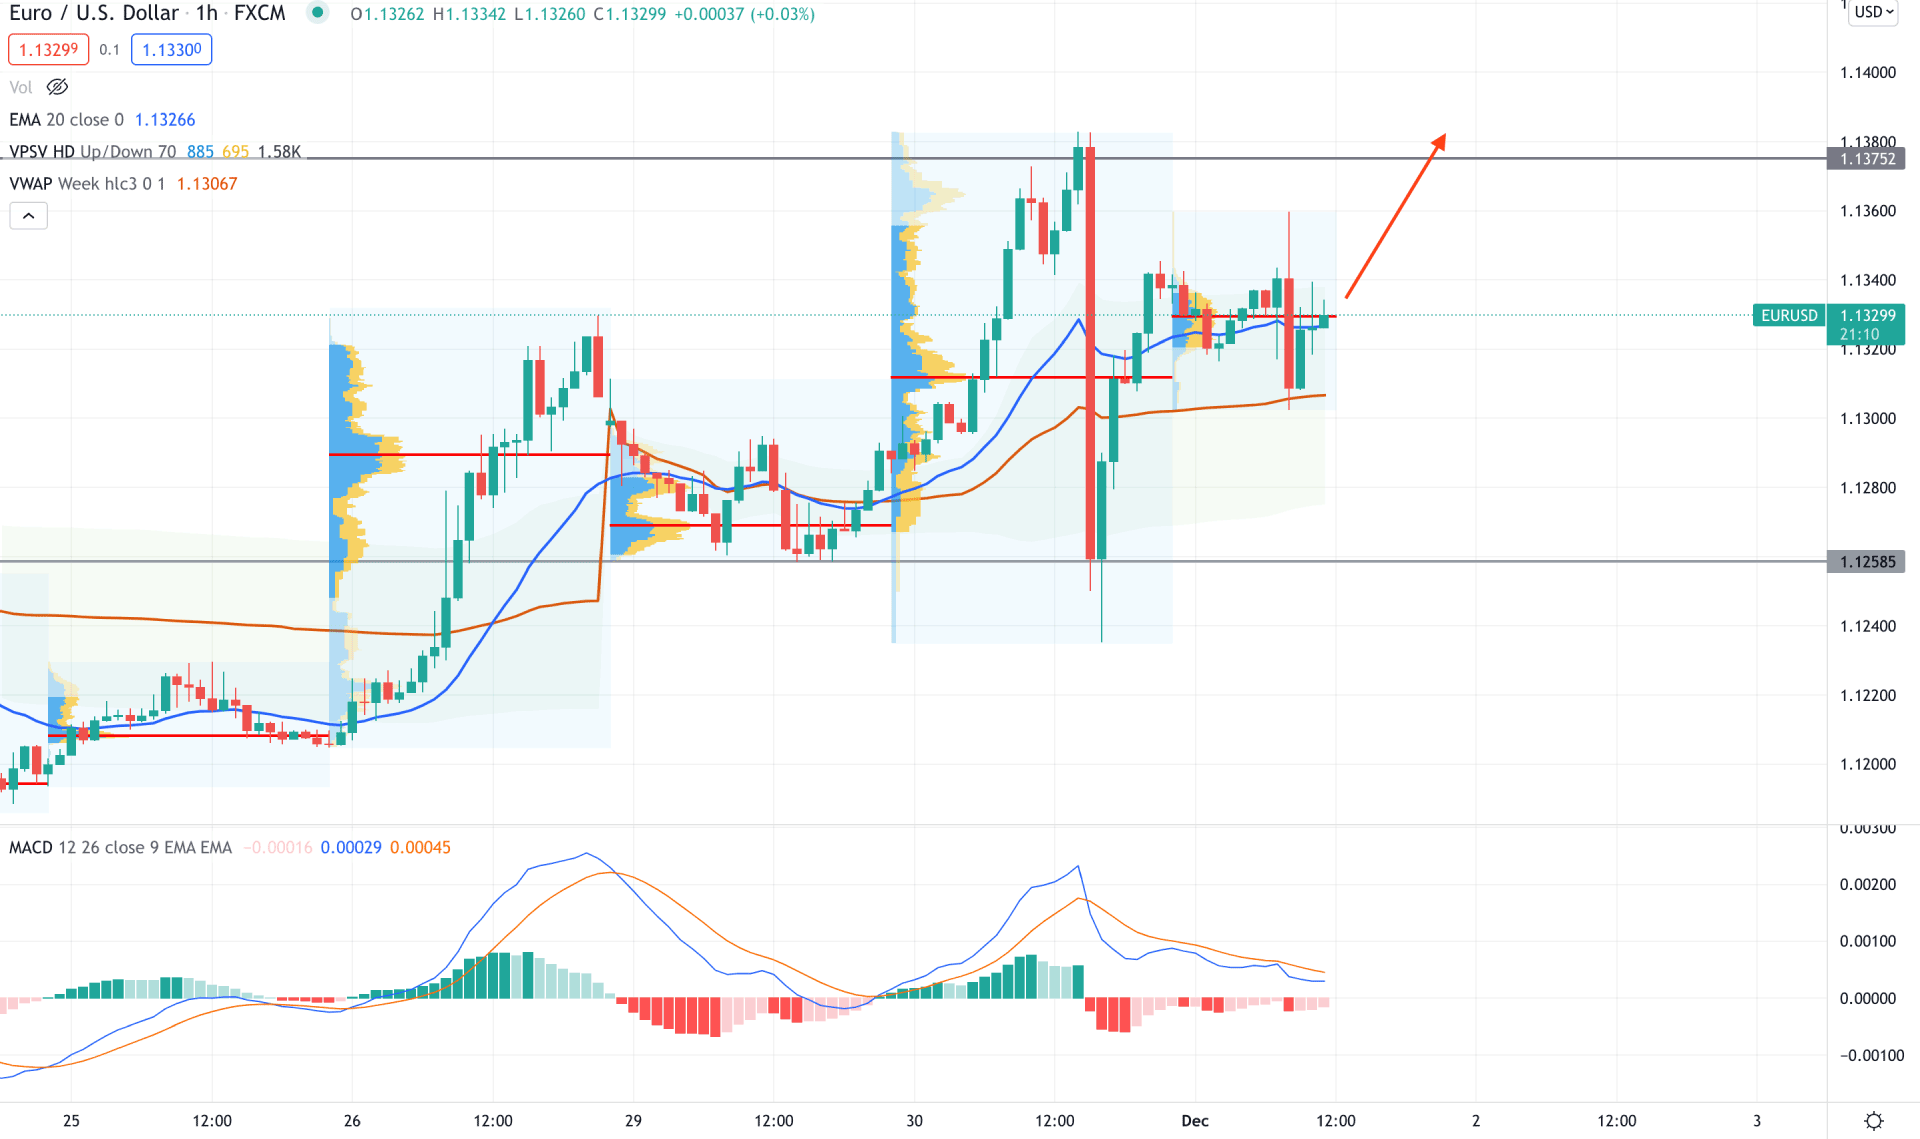
In the intraday chart, EURUSD is trading within a lot of volatility where the recent price showed an extreme selling pressure from the 1.1375 area to the 1.1258 level. Later on, the price received the 90% of the movement and held a strong position above the dynamic weekly VWAP. Therefore, investors may experience another bullish surge as long as the price holds above the dynamic VWP.
In the indicator window, the MACD Histogram is bearish, but its momentum is getting weaker. On the other hand, the dynamic 20 EMA is closer to the current price, where the most recent high volume level is at 1.1329. Therefore, based on the intraday market structure, any bullish H1 close above the 1.1360 swing is more likely to take the price towards the 1.1500 area. On the other hand, a break below the 1.1258 would eliminate the current bullish possibility and lower the price.
As per the current market condition, EURUSD is more likely to extend the current bullish pressure if the current price closes above the 1.1375 with a bullish daily candle. On the other hand, any rejection from the dynamic 20 EMA or static 1.1375 would increase the selling pressure towards the 1.1150 area.