Published: January 14th, 2025
Over the trading week, European financial information continues to be mediocre. The interest rate difference between the euro and the US dollar is expected to grow as the European Central Bank (ECB) keeps cutting interest rates. It is not anticipated that the German and Pan-ERU closing inflation figures, which are coming through the midweek meetings, will differ substantially from their initial prints.
The week's important data docket begins Tuesday with the United States Producer Price Index (PPI) data, which is predicted to increase to 3.7% YoY in December from the previous 3.4%. Retail sales in the US activity is scheduled for Thursday, while US CPI inflation, which is also expected on Wednesday, is predicted to increase slightly to 2.8% from 2.7%.
Earlier, Nonfarm Payrolls (NFP) climbed by 256K in December, according to data issued by the US Bureau of Labor Statistics (BLS) on Friday. This figure greatly exceeded market forecasts of 160K and the updated November total of 212K (originally reported as 227K).
Last week, Michelle Bowman, a member of the Federal Reserve Board of Governors, joined a group of Fed speakers as policymakers sought to calm market responses to a considerably slower pace of rate reductions in 2025 than many investors had previously expected.
Let's see the outlook of this current pair from the EURUSD technical analysis:

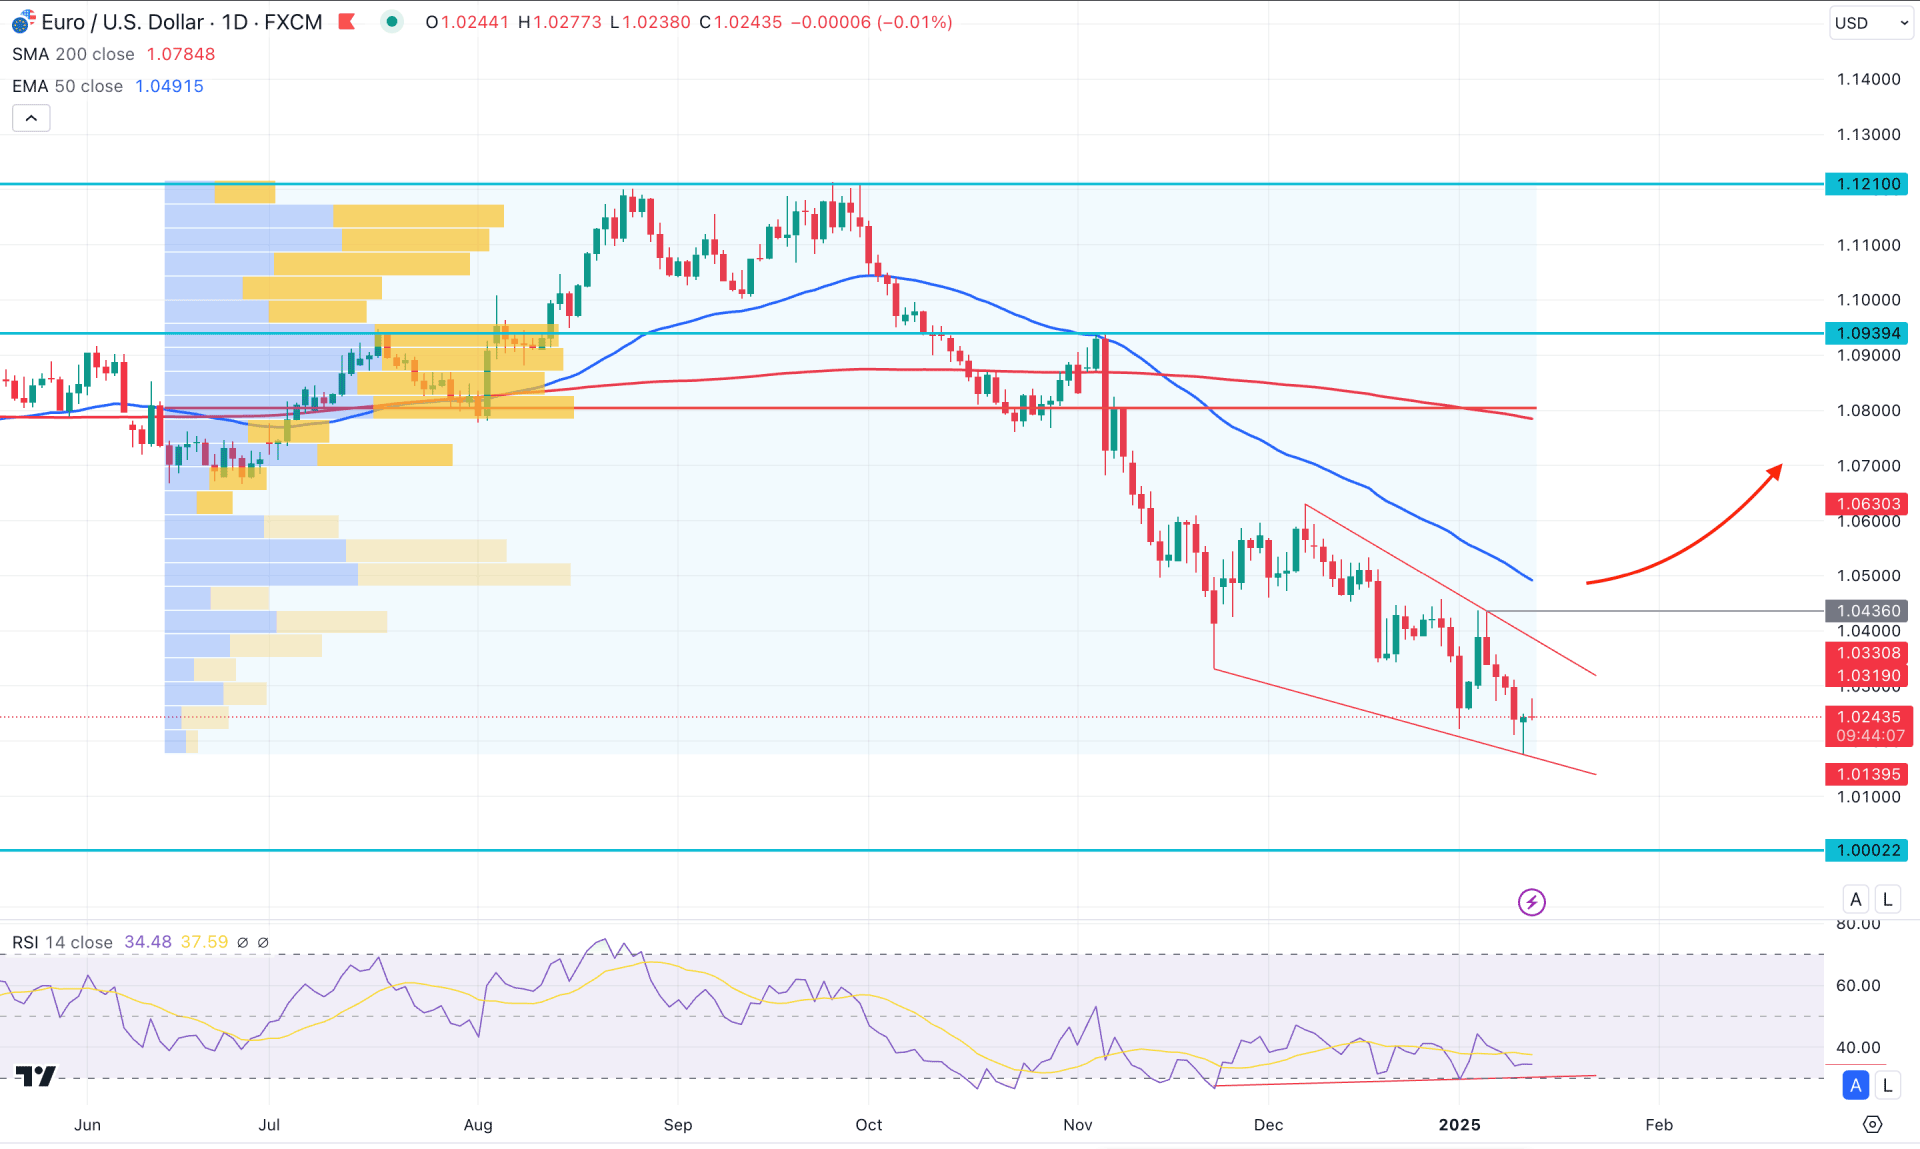
The EURUSD pair has become sideways after a 5 day losing streak. The latest market momentum signals a potential downside continuation, supported by a descending channel formation.
In the broader outlook, the monthly chart shows strong bearish pressure as the price moves down for four consecutive months. Moreover, the downside momentum is visible from the weekly chart, which came down after a minor bullish correction.
In the major structure, the bearish slope in the 50-day Exponential Resistance signals short-term selling pressure in the market. Investors might expect the downside momentum to continue as long as the 50-day EMA remains above the current price.
Moreover, the volume structure shows the same story as the largest activity level since June 2024 is above the current price and working as a resistance.
The 14-day Relative Strength Index (RSI) reached the oversold 30.00 line, from where a bullish rebound has come. Although it signals a potential recovery, more clues are needed from the main price chart before anticipating a trend reversal.
On the bearish side, the EURUSD pair is more likely to extend the selling pressure and find support at the 1.0170 level, which is a 26-month low. Moreover, a break below this line could test the psychological support from the 1.000 level before reaching the 0.9890 static line.
On the bullish side, the 14-day EMA is at the 1.0318 level, which is the immediate resistance. In that case, a breakout above this line could signal the primary bullish pressure in this pair. Moreover, overcoming the 1.0436 static level could validate the falling wedge pattern, which could validate the bullish reversal aiming for the 1.0630 level, which is the 2-month high. Overcoming this level could open the room for reaching the 1.0800 and even 1.1000 levels.

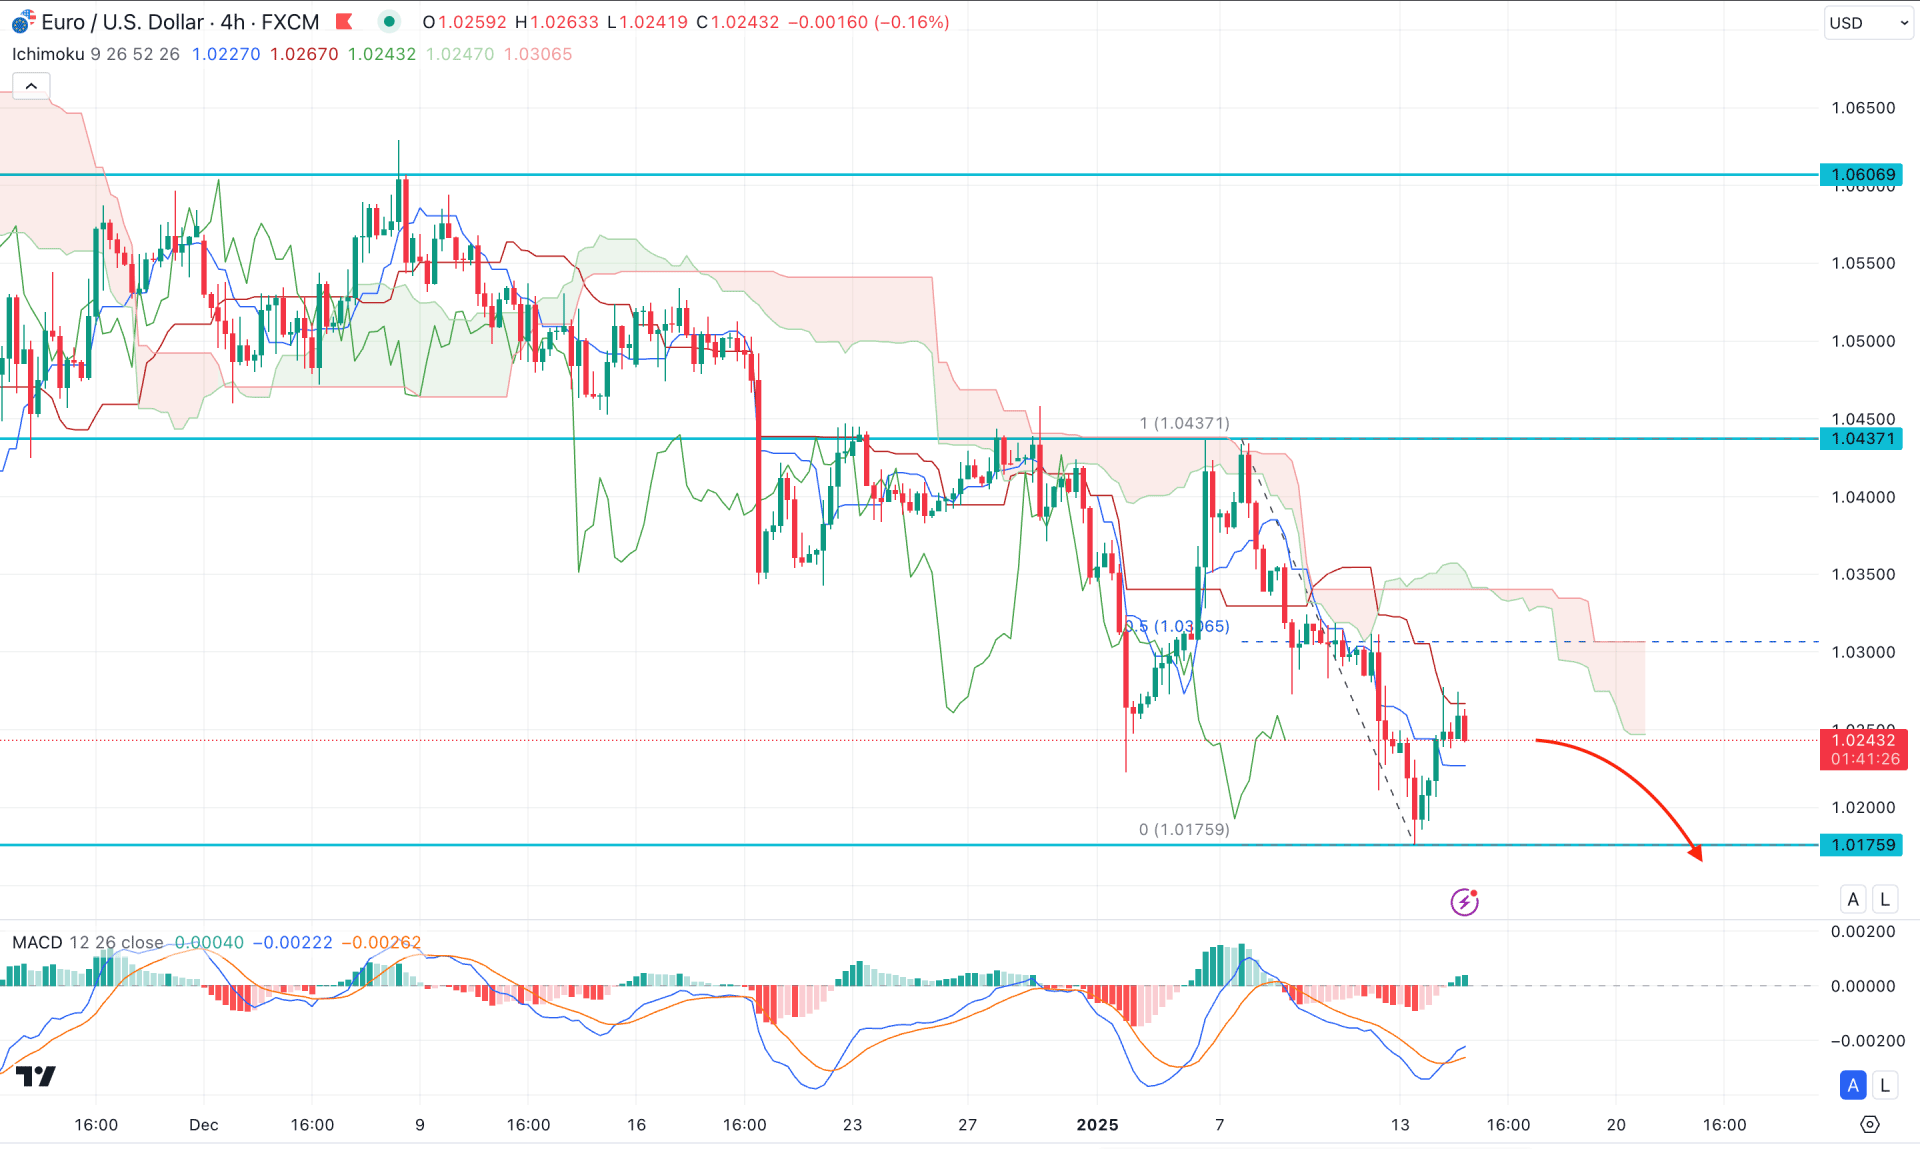
In the H4 structure of EURUSD, the ongoing bearish pressure is visible, where the current tradable range is clearly visible. The most recent selling pressure has come from the 1.0437 high and created a bullish V-shape recovery at the 1.0175 level. As the current price is still trading below this range's 50% Fibonacci Retracement level, we might have to wait a bit more before anticipating a bearish trend continuation.
As per the Ichimoku Cloud, Senkou Span A and Senkou Span B aim lower and work as a crucial resistance zone. Moreover, the dynamic Kijun Sen is acting as a resistance from where a bearish H4 candle is visible.
However, the MACD Histogram tells a different story. The Signal line has formed a bullish rebound from the oversold zone. It signals a possible upward recovery before forming a bearish signal.
Based on the H4 outlook, investors should monitor how the price trades at the 1.0300 to 1.0437 zone as it will act as a valid premium zone. A valid selling pressure from this area with an H4 candle below the Kijun Sen could extend the selling pressure.
On the other hand, a recovery above the cloud high with a consolidation could signal buyers' intervention, which might extend the gain above the 1.0450 level.

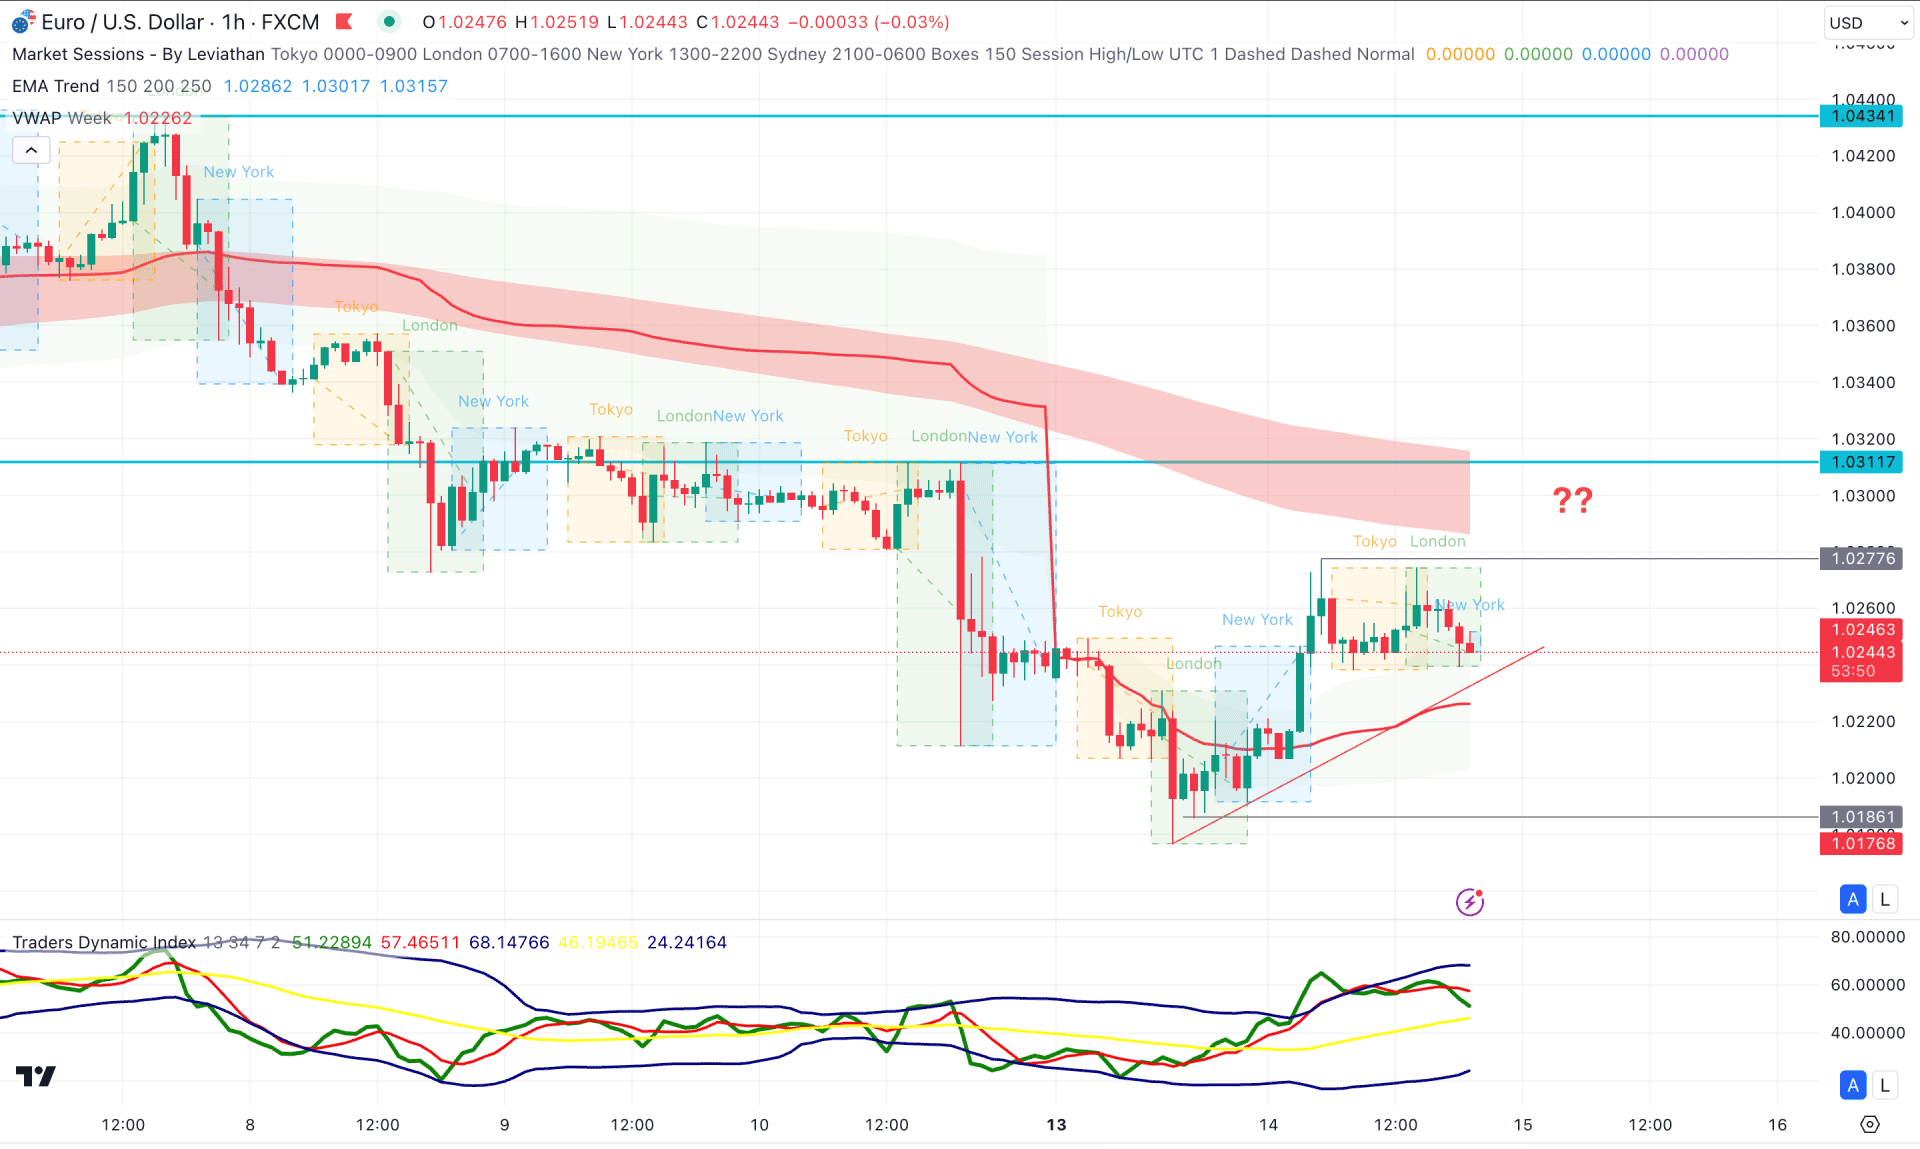
In the H1 timeframe, the recent price shows a corrective momentum, where the Moving Average wave is acting as a major resistance. Primarily, we may expect the selling pressure to extend as long as the price hovers below the MA wave area.
On the other hand, the weekly VWAP line is acting as a support as the current price remains sideways above the bullish VWAP line below the current price.
The indicator window shows a selling opportunity where the Traders Dynamic Line showed a bearish rebound from the overbought zone.
Based on this outlook, the current sideways price might continue bearish after sufficient liquidity is obtained. The London and Asian highs remain untouched, while an imbalance is present in the 1.0298 to 1.0277 area.
A bullish range extension with a buy-side liquidity sweep could be a potential short opportunity, which might find the dip below the trendline support. However, an immediate bullish recovery above the 1.0311 high might invalidate the current outlook and initiate bullish pressure.
Based on the current market structure, EURUSD is more likely to aim lower as long as the daily trend remains bearish. However, the slower market at the yearly low might rebond the price from a valid wedge breakout.