

Published: October 22nd, 2026
The US dollar's recent decline paused on Thursday as investors adopted a cautious stance ahead of several major central bank meetings scheduled for next week. Markets anticipate central banks in Japan, the United States and Europe will maintain a hawkish approach to interest rates.
Investors remain positioned in favour of the dollar, betting that the artificial intelligence (AI) boom will sustain US economic growth.
However, the recent strengthening of other major currencies suggests that some investors have reduced their dollar positions.
The EURUSD pair remained sideways despite concerns that France's fiscal outlook could restrict gains. European Central Bank (ECB) policymaker Fabio Panetta is due to speak later Thursday.
French 10-year government bond yields rose above 5% on Wednesday for the first time in 24 years. Weekend unrest across France, partly driven by proposed public service cuts. It has underscored the political challenges facing the government as it attempts to rein in budget deficits.
Analysts widely expect the ECB to keep its benchmark interest rate unchanged at 2.5% next week. However, financial markets have largely priced in a rate hike before year's end.
In the United States, traders see a relatively low probability of the Federal Reserve (Fed) raising interest rates at next week's meeting. According to the CME FedWatch tool, the next rate hike is expected in December.
Let's review the EURUSD technical analysis:
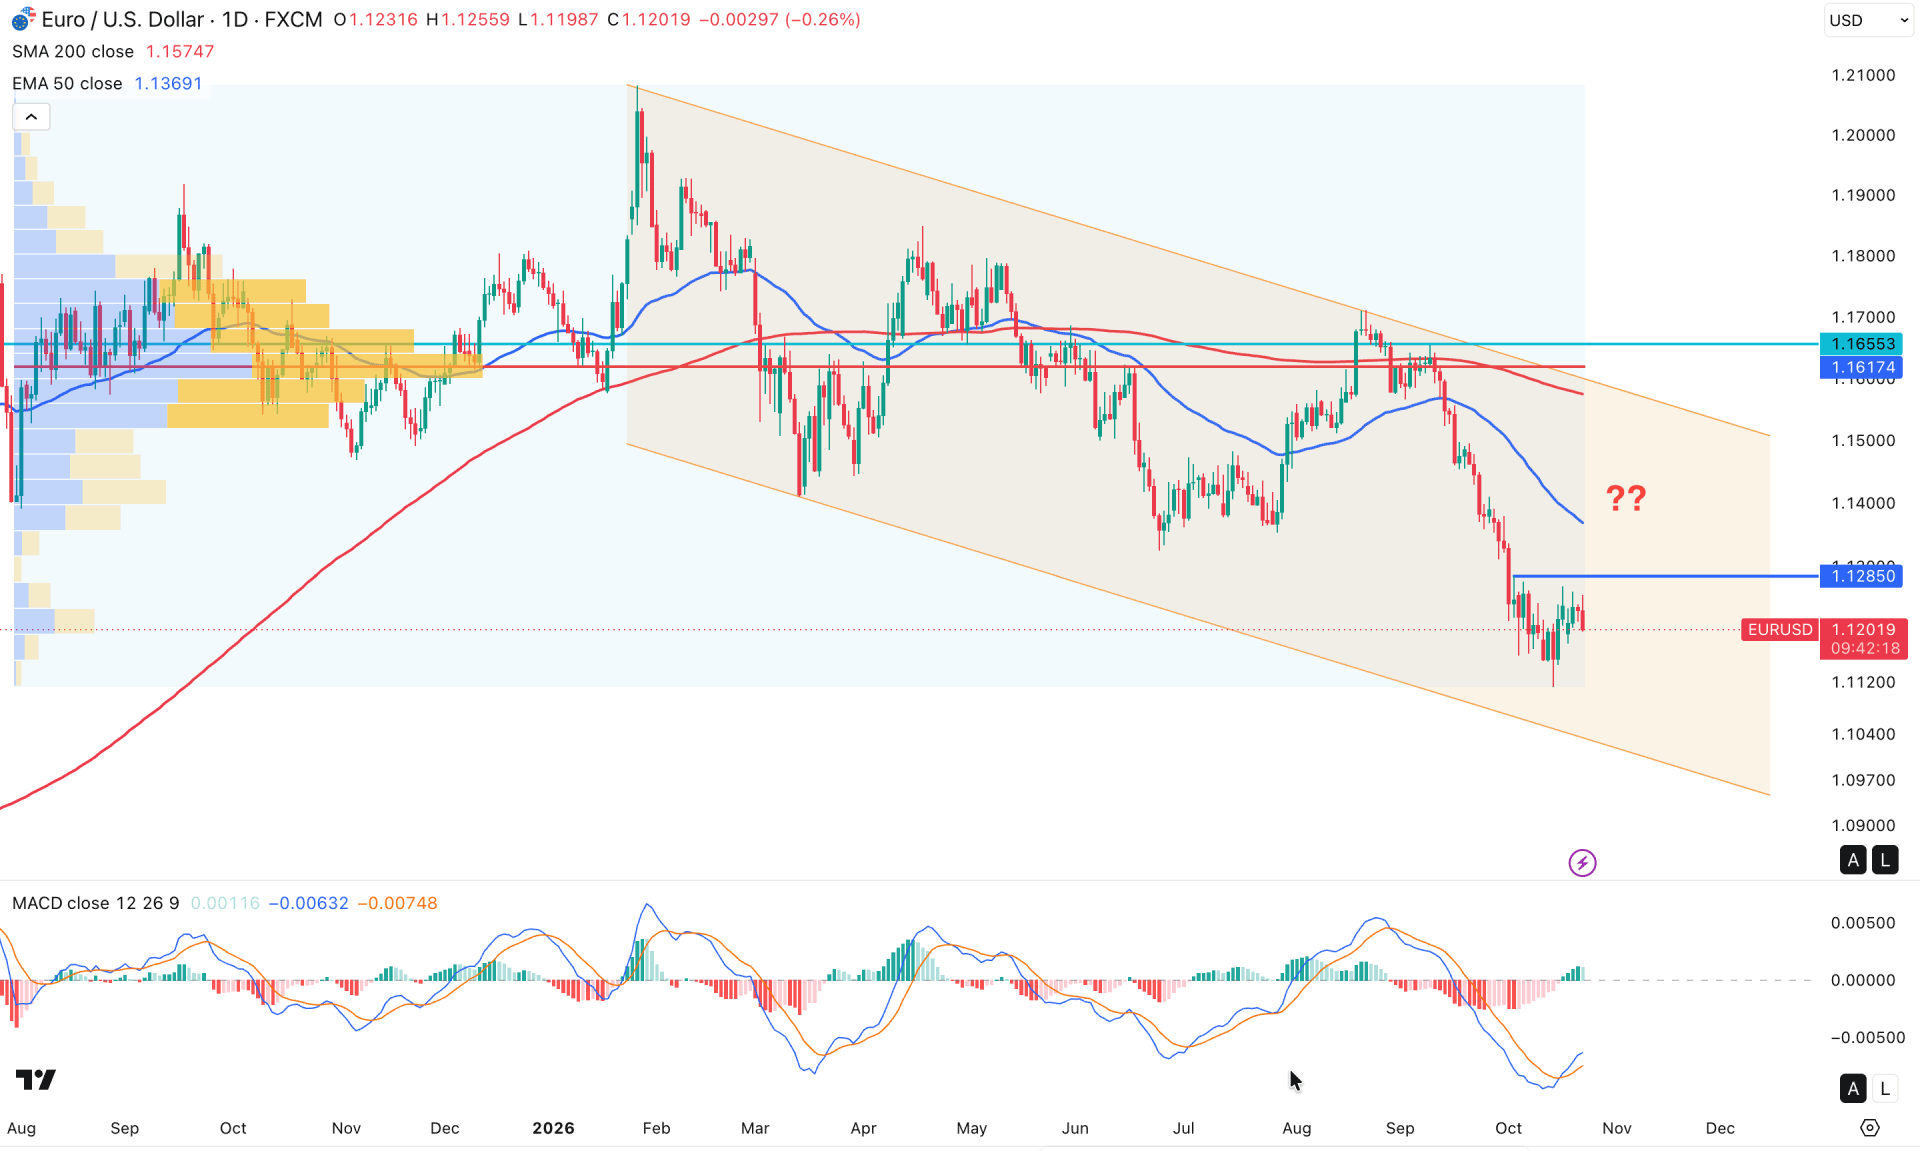
On the EURUSD daily chart, market momentum is bearish as price trades within a descending channel. However, buying pressure remains valid, as price is trading above the 50% Fibonacci retracement level of the 2025 price swing.
On the higher timeframe, corrective bearish pressure is visible as price rebounded lower after grabbing liquidity from the 1.2000 psychological level. The monthly candle suggests continuation with consecutive bearish candles, while the weekly candlestick follows the same pattern. In the recent chart, the weekly price is reaching the lowest peak area where a bullish correction is pending.
In terms of volume, sellers are still dominating the market, as the largest activity level since July 2025 is at 1.1617, well above the current price.
In the main price chart, the bearish momentum is clearer below the 50-day EMA, while the 200 SMA follows the downside momentum just below the high-volume static resistance.
Overall, price is trading below key dynamic lines and can move lower as long as downside pressure remains visible below the 50-day EMA.
On the other hand, selling pressure may be limited by the MACD signal line's position. As per the current reading, a bullish crossover is visible at the bottom with multiple vertical histogram lines above the neutral area.
Based on the overall market structure, EURUSD is trading within a bearish impulsive wave. From here, taking a bullish rebound might need additional attention. Near-term resistance level is 1.1285. Overcoming this line could increase the possibility of testing the 1.1500 area.
The alternative trading approach is to look for a bearish opportunity, even though the price approached the descending channel support. As long as the 50-day EMA is above the current price and slopes downward, a new swing low can form on a test at the 1.1000 level.
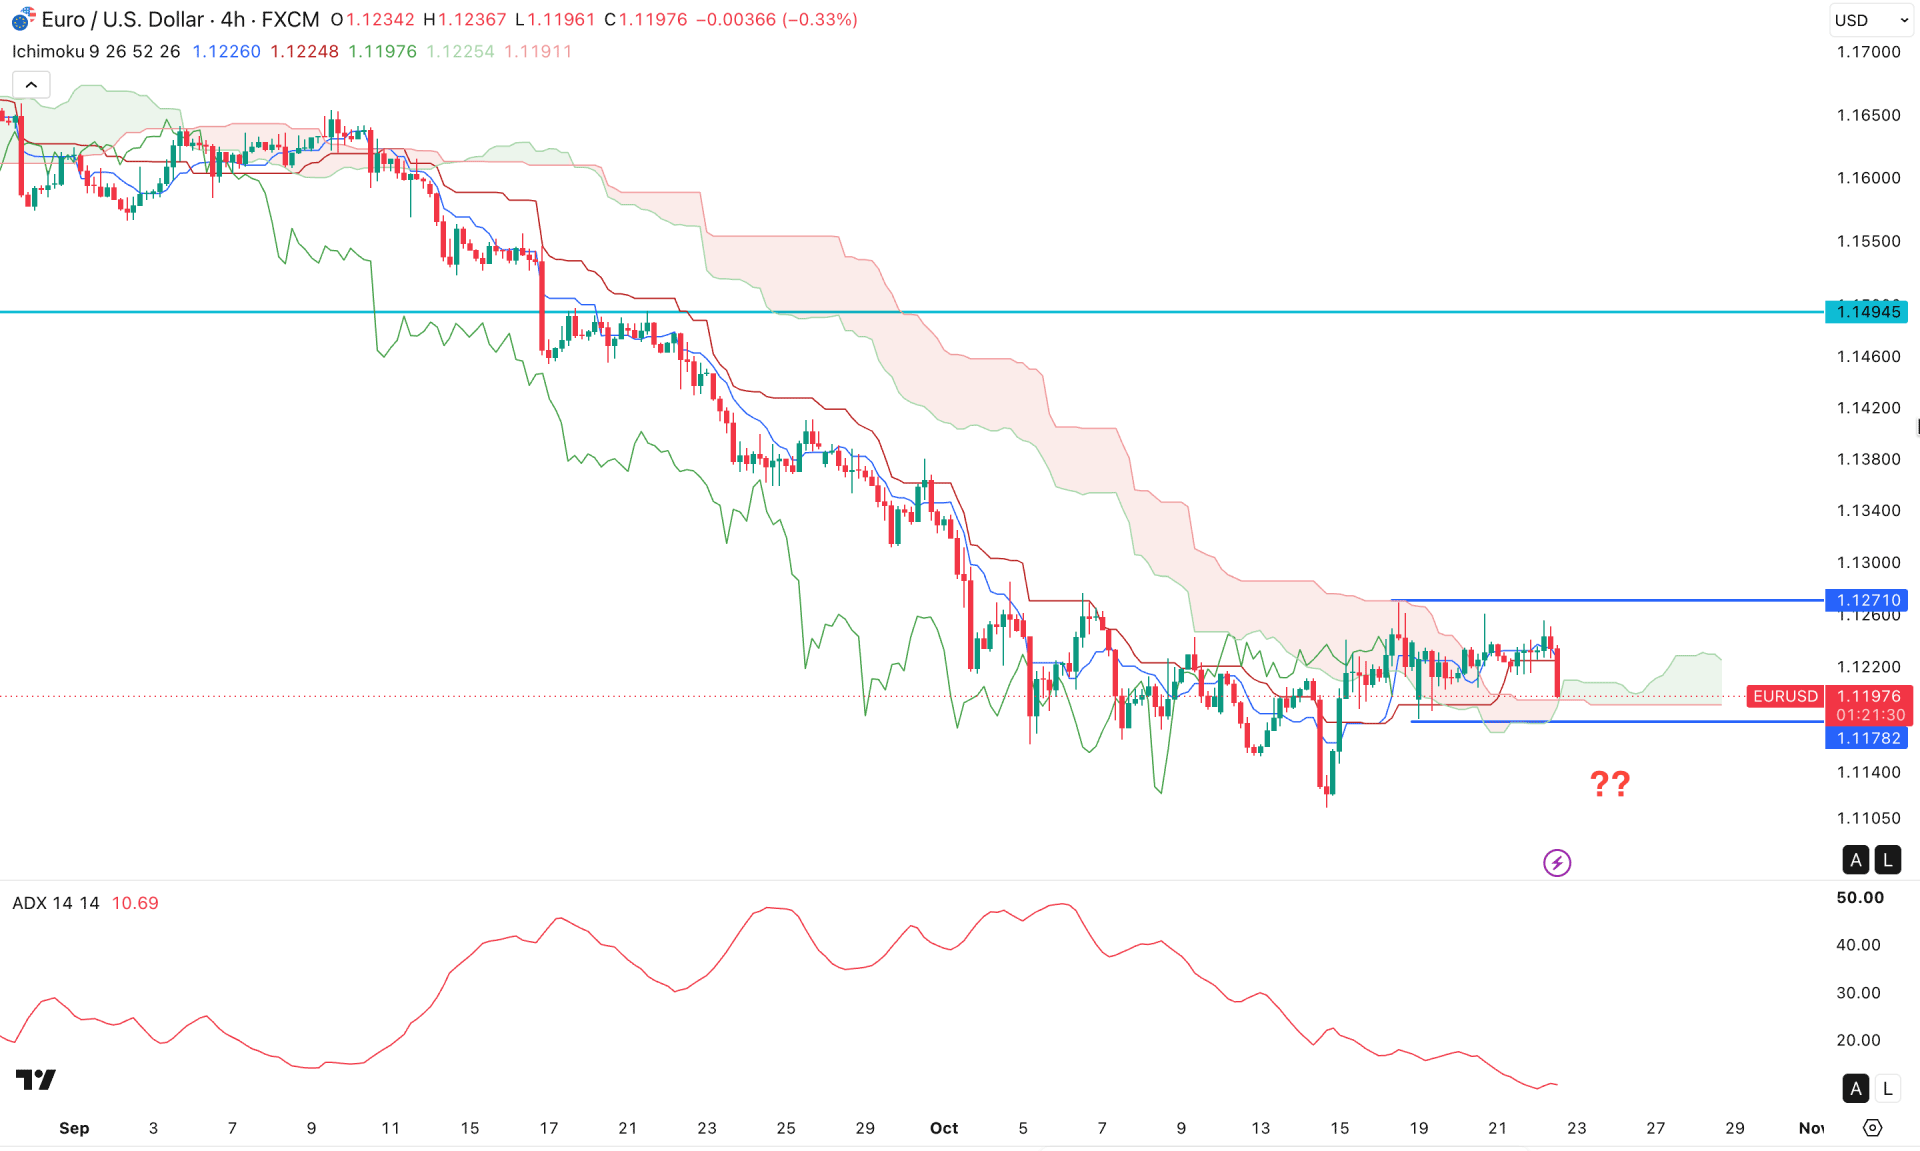
On the four-hour timeframe, EURUSD is trading in sideways momentum, with existing market momentum bearish. Price remained below the Kumo cloud area for a considerable time, then rebounded higher with sideways momentum. Based on the price action, multiple bullish candles above the cloud support are not enough to confirm a reversal rebound.
The future cloud has shifted position, but not satisfactorily enough to consider a bullish continuation. The Senkou Span A remains flat, signaling a corrective medium-term trend. However, the Senkou Span B is showing bearish traction.
In the secondary indicator window, the market trend also shows sideways movement. The Average Directional Index has been below the 20.00 satisfactory line for a considerable time.
Based on the overall market structure, EURUSD is trading within a rectangle pattern, where a failure to hold above the 1.1178 level could signal a breakdown for buyers. A sharp four-hour candle below this line could increase the possibility of a new swing below the 1.1139 area.
The alternative approach is to wait for an extension of buying pressure, validated by a bullish trend rebound. In that case, covering the near-term dynamic line, where price closes above the 1.1271 level, could extend price higher, above the 1.1450 area.
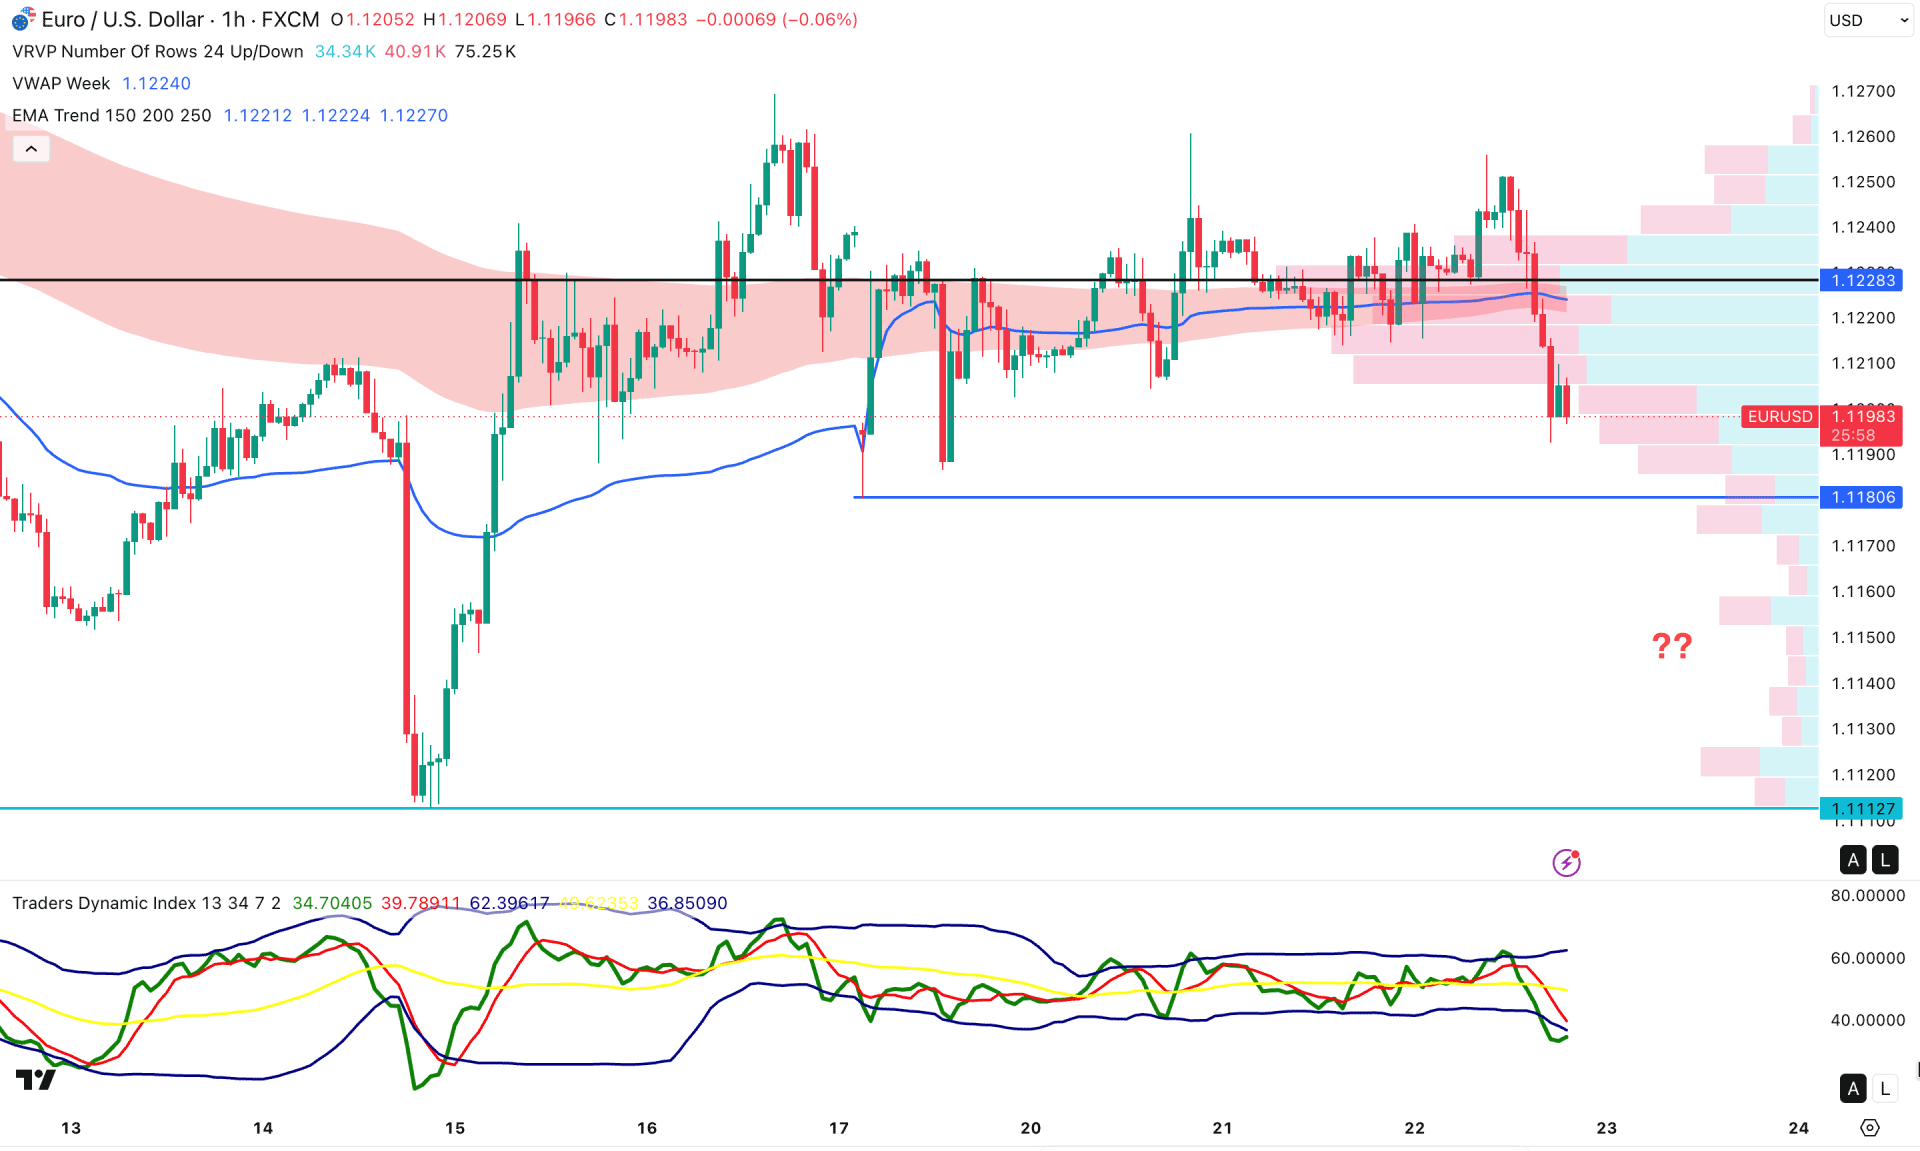
On the hourly timeframe, EURUSD is trading in a sideways pattern, with the current price below the dynamic VWAP level. Moreover, the EMA wave and high-volume lines are above the current price, signaling active selling pressure.
In the secondary indicator window, the Traders Dynamic Index reached the oversold area, where the current line has been below the 50.00 level for a considerable time.
Based on the hourly market structure, EURUSD is under intraday selling pressure, with the immediate support level to watch at 1.1180. A break below this line could trigger a broader correction toward the 1.1112 area.
On the other hand, a sell-side liquidity sweep with a recovery above the VWAP level could present an opportunity at any time.
Based on the overall market structure, EURUSD is trading within a bearish market structure, with the current price moving sideways after an impulsive bearish wave. In this case, short-term resistance is a key area to watch. Bullish rebound potential is limited as long as price trades below the near-term daily resistance line.


