Published: February 16th, 2022
European stocks opened bullish on Wednesday after the optimistic US close due to the rising tension from the Ukraine-Russia conflict. The regional benchmark, Euro Stoxx 50, showed a 0.6% gain with a positive result in all sectors. Among gainers, French lottery operator La Francaise des Jeux achieved a 6.6% gain while Swedish medical technology group Vitrolife has lost almost 10% after missing the Q4 earnings income by 70%.
According to Whitehouse, 16 February was the date when Russia was meant to invade Ukraine, but Moscow’s signal to pullback made a splash on Wall Street and fueled a sell-off to safe-haven treasuries and instruments. The US Treasury yield curve returned to the Tuesday level due to war fear. The current state of the curve indicates that the central bank may provide an immediate decision regarding higher inflation. Now, investors focus on the US Federal meeting, where the next meeting might come with a rate hike by a quarter percentage.
In the Eurozone, shares are set up to build further gain from the current tension from the Ukraine-Russia conflict.
Let’s see the upcoming price direction from the EURO STOXX 50 (EU50) technical analysis:
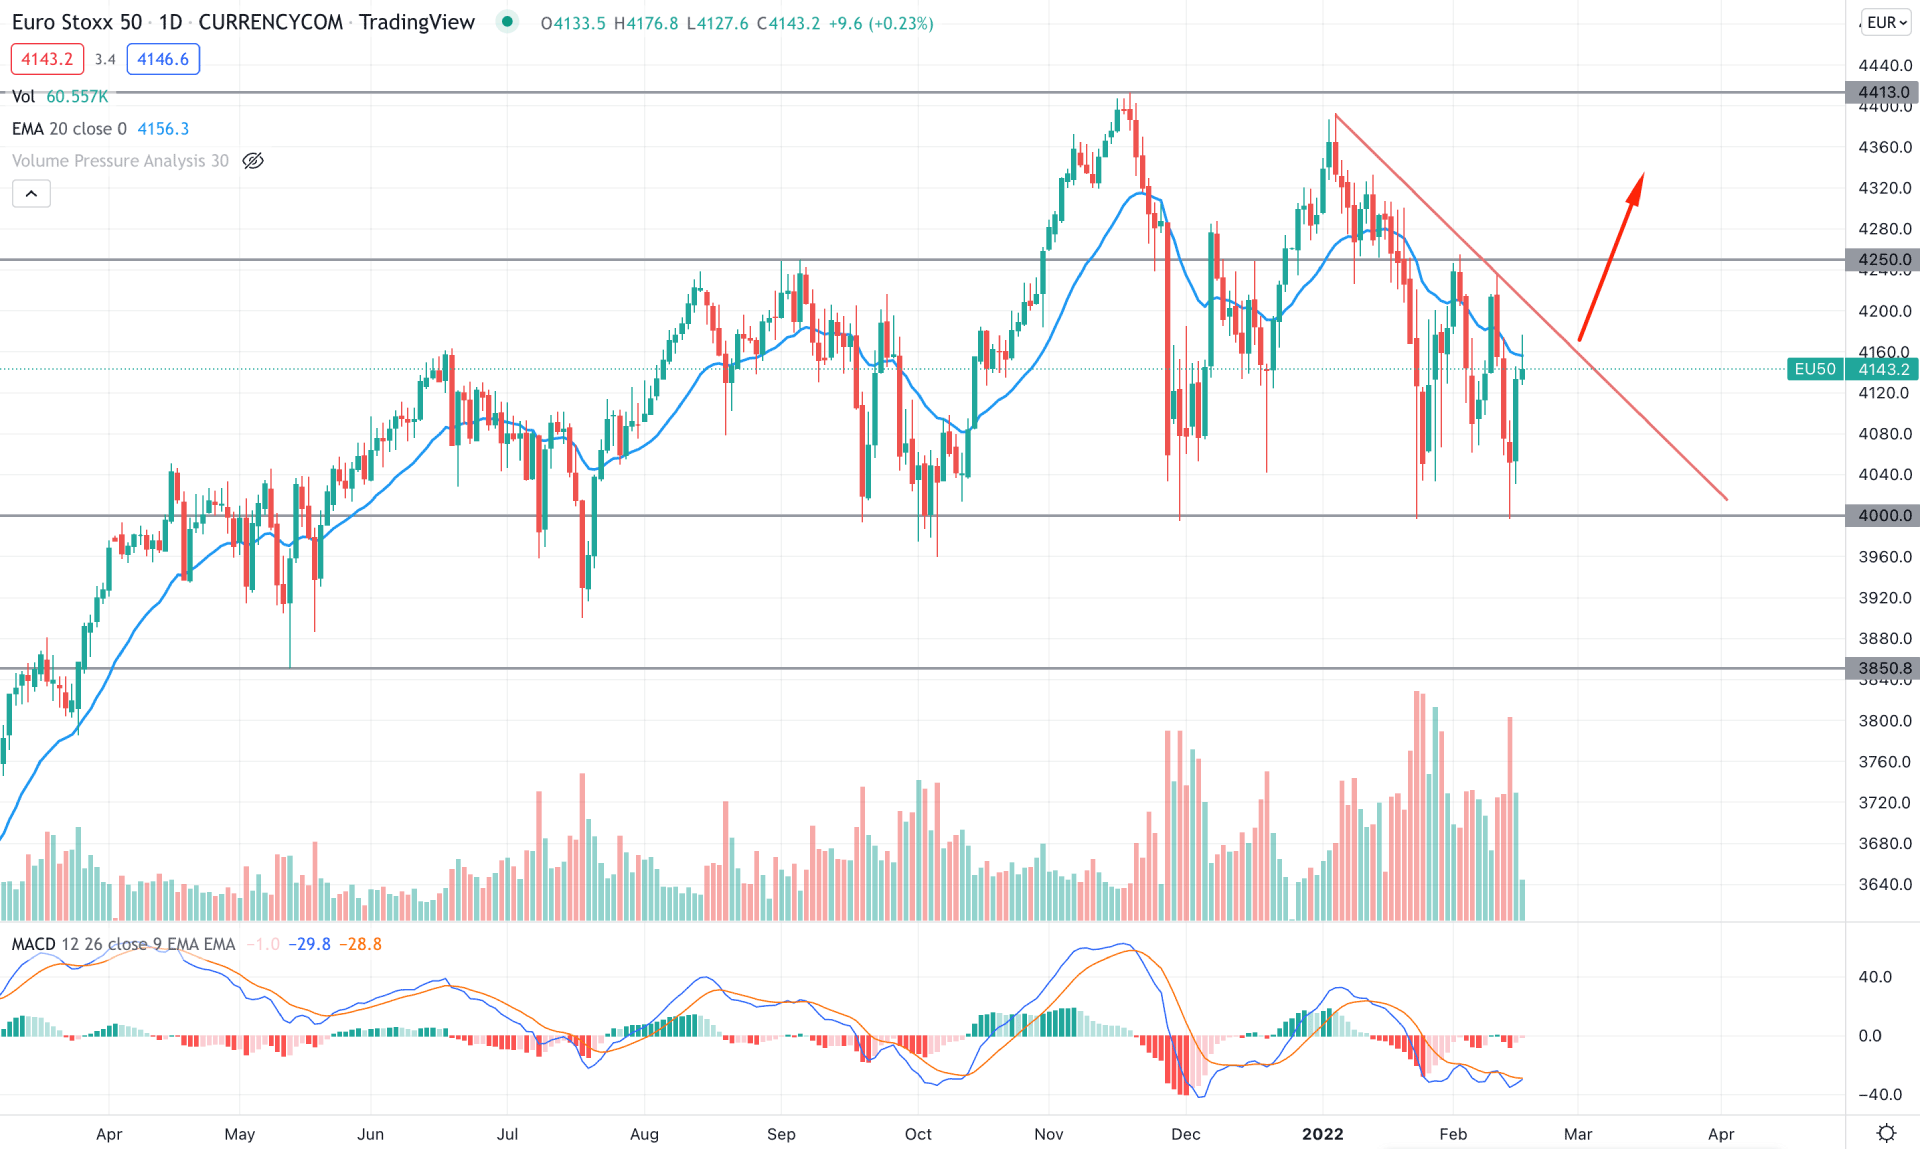
In the daily chart of EURO STOXX 50, the broader market direction is bullish from the COVID-19 crash. Moreover, the bullish structure break above the 4250.00 swing level made the market sentiment more bullish and reached 4414.50, the all-time high level. However, later on, the price remained corrective between 4250 to 4000 area for a considerable time where the most recent bullish rejection at 4000.00 level provided buyers’ interest in the price.
The above image shows how the price formed a long wicked candle at the 4000.00 level while the MACD Histogram remained corrective at the neutral level. However, the price is trading within a corrective momentum that pushed to have violations of dynamic level.
In this context, investors should find the price above the falling trendline with a bullish daily candle that may extend the buying pressure towards the 4400.00 area. Conversely, any bearish rejection from the trendline with a daily close below the 4000.00 level may open a bearish possibility towards the 3850.80 support level.
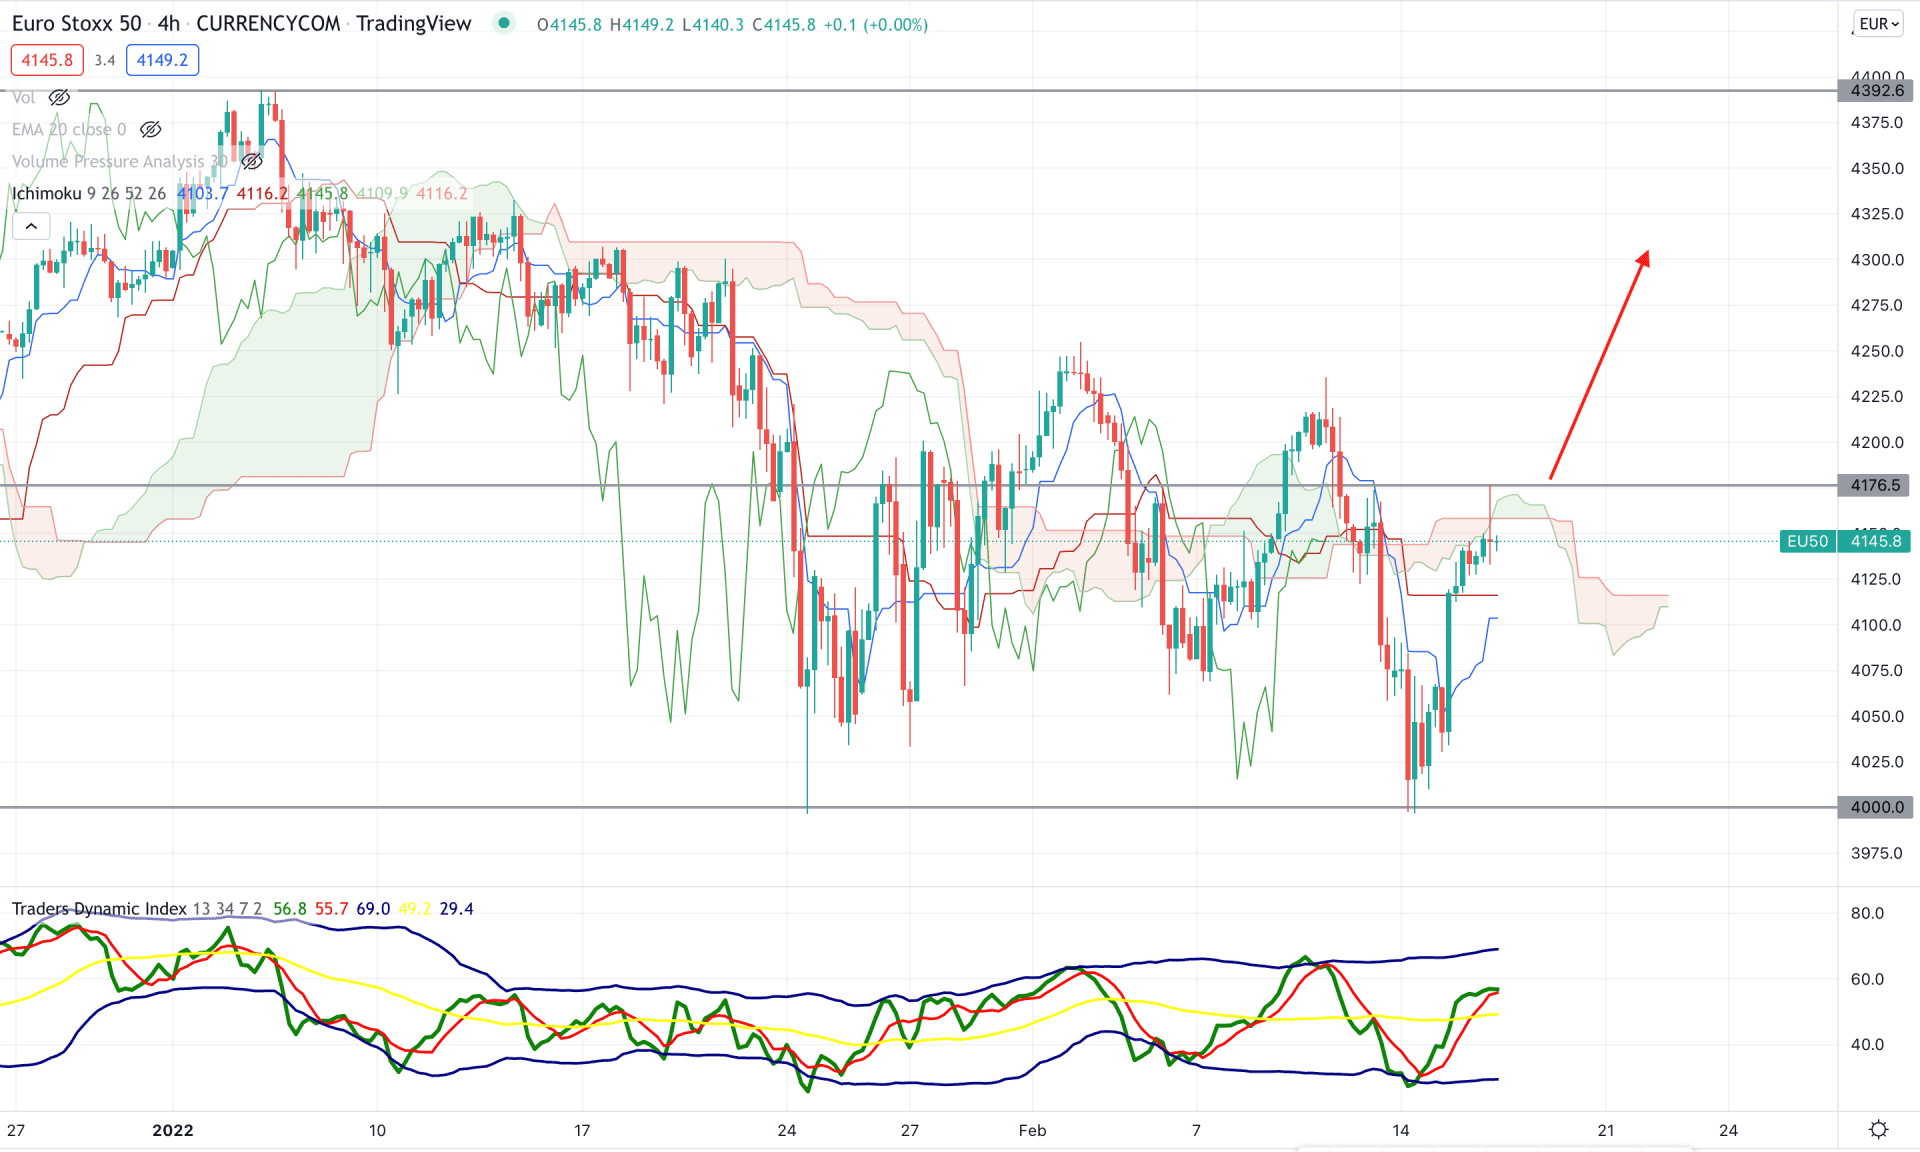
In the H4 chart, EU50 became very volatile after breaking below the Kumo Cloud and failed to hold its selling momentum below the 4000.00 level. However, the recent rebound from the 4000.00 level failed to breach the Cloud resistance where investors should remain cautious while finding the buying opportunity.
The above image shows how the price moved above the dynamic Kijun Sen with a strong bullish H4 candle while the trader's dynamic index (TDI) remained bullish above the 50 levels. In that case, if the price formed a bullish H4 candle above the cloud resistance with an upper band test in TDI would increase the possibility of the trend change.
In that case, the buying possibility in the H4 chart is valid as long as the price trades above the dynamic Kijun Sen. the primary target of the buying pressure is towards the 4392.6 resistance level. On the other hand, if the price shows sellers' interest by moving below dynamic supports, it may move down towards the 4000.00 level.
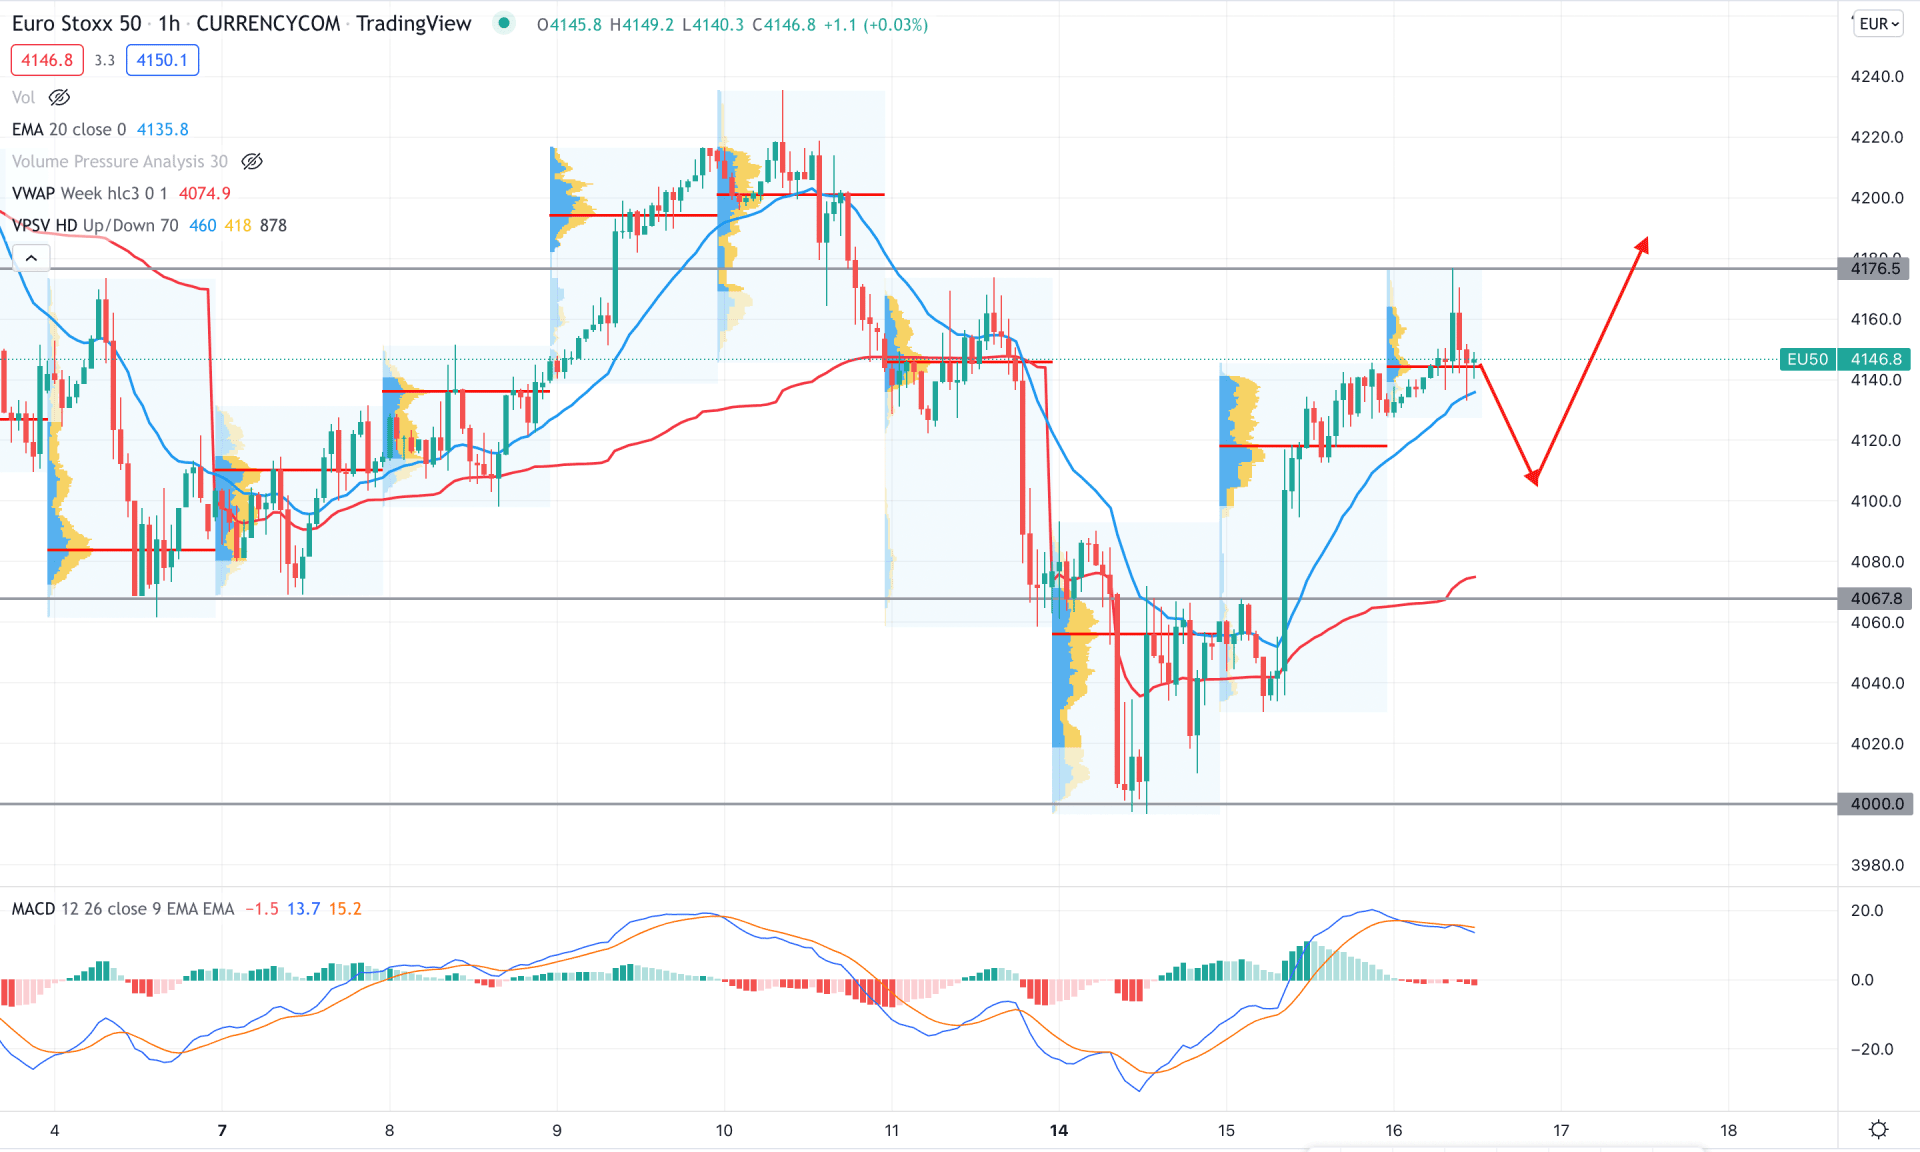
In the intraday chart, Euro Stoxx 50 showed a strong buyers’ interest as the recent price moved above dynamic 20 EMA and weekly VWAP with an impulsive bullish pressure. Therefore, as long as the price trades above the dynamic VWAP, it may extend the buying pressure in the coming days.
The above image shows how intraday high volume level showed buyers interest even if the price went higher. On the other hand, the MACD Histogram became corrective at the neutral level while the MACD line is above the histogram.
In this context, bulls have failed to breach the 4176.50 resistance level from where a bearish rejection has formed. In that case, a minor bearish correction may take the price lower where any buying sign from 4100 to 4060 would provide a potential bullish opportunity.
As per the current market context, EU50 is more likely to extend the buying pressure as long as it trades above the 4000.00 support level. However, investors should find a strong buying possibility in the H4 chart by finding the price above the Cloud resistance with a bullish H4 candle.


