

Published: September 23rd, 2026
EURNZD is trading above the 2.0000 level, eliminating the daily loss. As the New Zealand Dollar (NZD) declines due to indications that future rate increases by the Reserve Bank of New Zealand (RBNZ) will be gradual, the currency pair is under pressure to decline. Financial markets are still trading in another possible rate rise in October despite the RBNZ's cautious posture. This is mostly due to rising oil prices, which present fresh upside threats to inflation.
However, the shared currency may soon be threatened by political unrest in Germany. In Sunday's local elections in northeastern Germany, the far-right-wing Alternative for Germany emerged victorious. It left Chancellor Friedrich Merz holding onto power after his conservative party suffered its biggest regional election loss.
Global geopolitical happenings are sending conflicting signals to broader market mood. On the one hand, trade and diplomatic opportunities have increased risk appetite. Traders are keeping a tight eye on an impending US-China summit for indications of improved ties between the two biggest economies in the world.
Let's see the full price outlook from the EURNZD technical analysis:
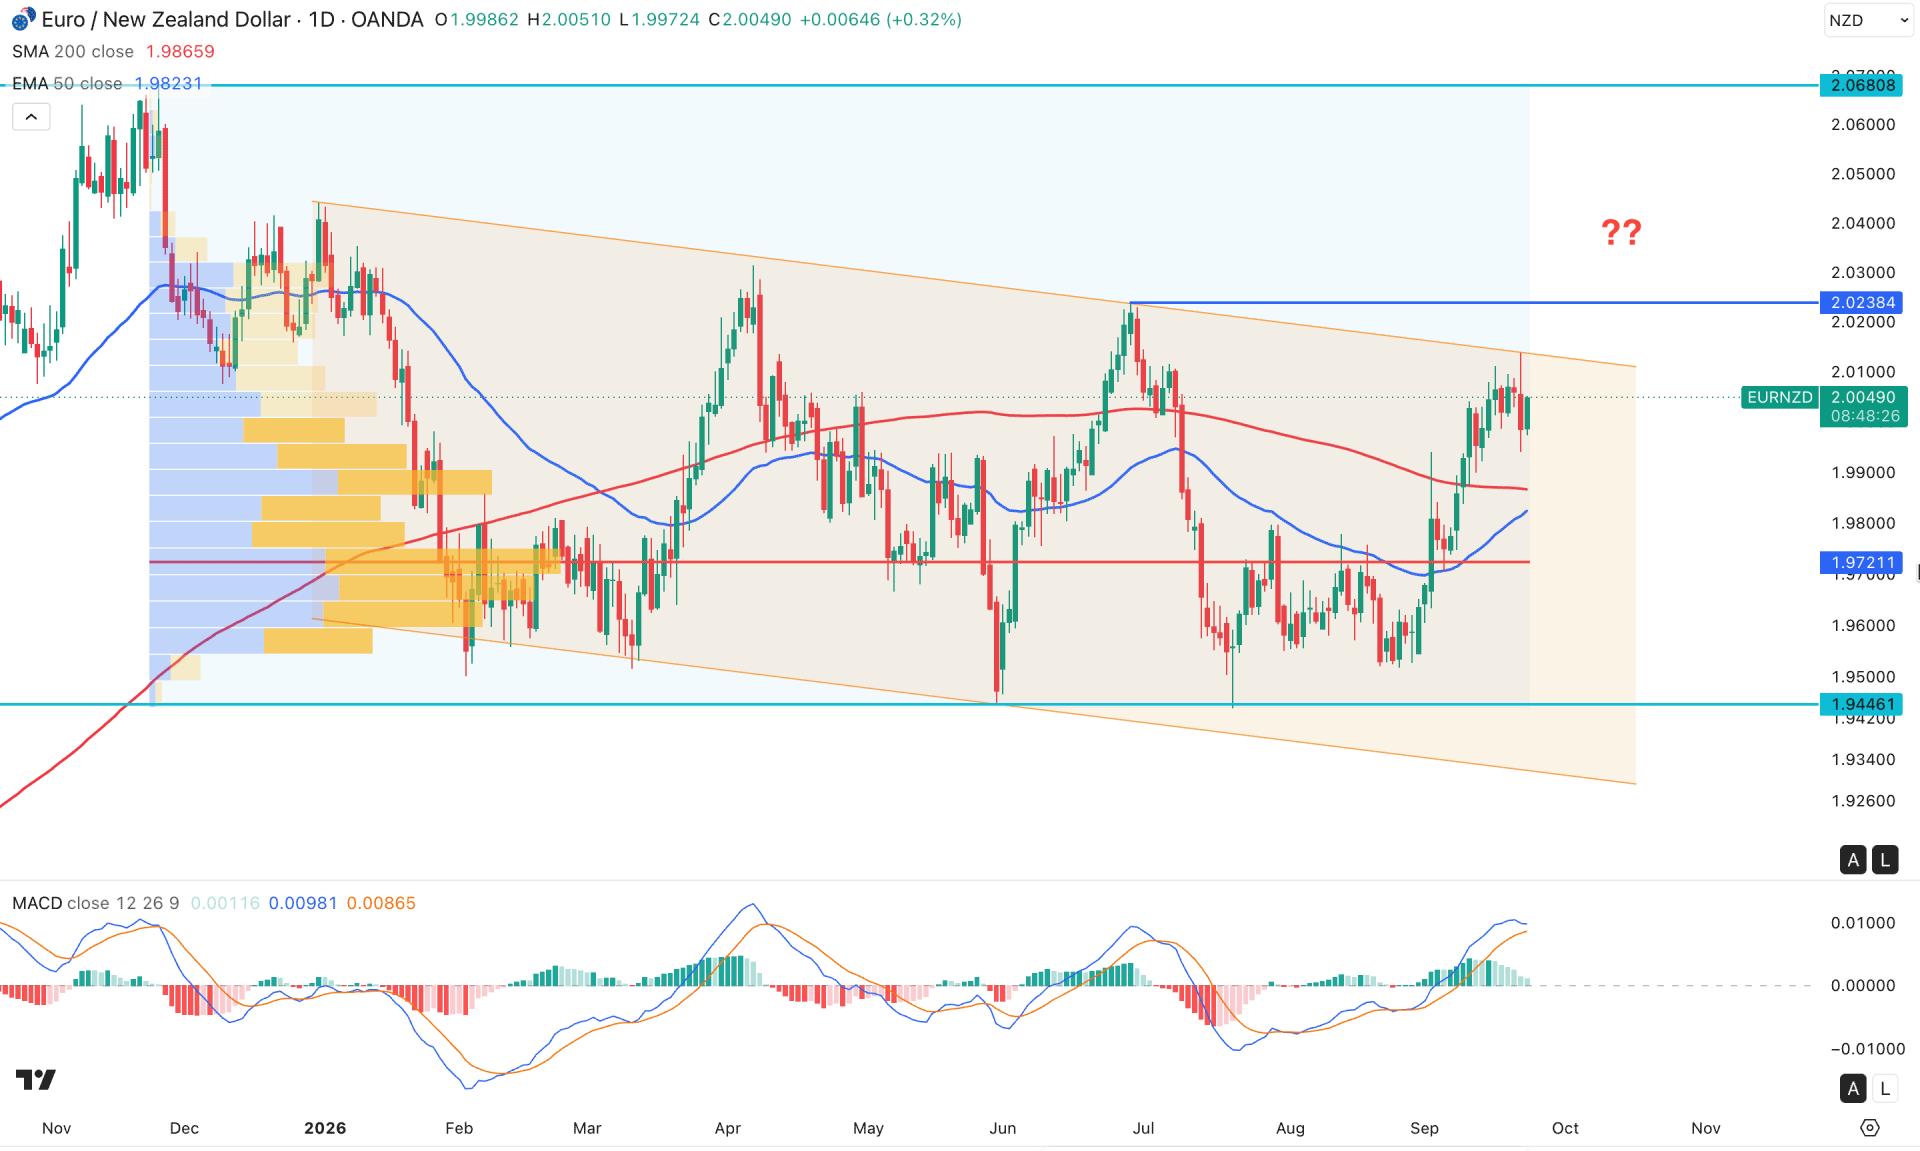
In the daily chart of EURNZD, corrective market momentum is visible. The price has been trading within a flat pattern since the beginning of 2026. As the range is wide and supported by an existing bullish trend, investors should remain cautious before opening any short opportunity from the channel resistance.
Looking at the higher timeframe, the monthly chart shows a consolidation after reaching a peak at the 2.0680 level. As the most recent price is holding bullish momentum, a break above the existing monthly resistance could create a potential bullish impulsive wave. The weekly timeframe shows a similar structure, where a ranging market after a bullish rally is visible. Technically, a bullish breakout after profit-taking is highly possible, as there is no sign of counter-momentum at the bullish peak area.
In terms of volume, buying pressure is also supported, as the largest activity level since October 2025 is at the 1.9721 level, which is below the current price.
In the main price chart, the ongoing momentum is above the 200-day Simple Moving Average, while the 50-day EMA is showing bullish pressure from the high-volume support area. Still, the 50-day EMA is yet to close above the 200-day SMA, which could validate a golden cross trading opportunity.
In the MACD indicator, a different story is visible, as the signal line has become flat after reaching the peak, with the histogram at the neutral level. It is a sign of a possible top formation at the current structure, from where a considerable downside correction might appear.
Based on the overall market structure, the recent price is moving sideways at the channel resistance, which signals a pending bearish correction as a mean reversion.
As the price is facing crucial resistance, a bullish continuation with a buy-side liquidity grab from the 2.0238 resistance level could increase the possibility of testing the 1.9721 support level.
On the other hand, the price is already testing the resistance, from where a bearish correction is possible without grabbing any buy-side liquidity. In that case, an immediate test of the 1.9721 support level with a bullish rebound above the 50-day EMA, could form a bullish pre-breakout structure from the current channel area. Further, a breakout above the channel resistance with the recovery of the 2.0238 level could initiate a long-term bullish trend.
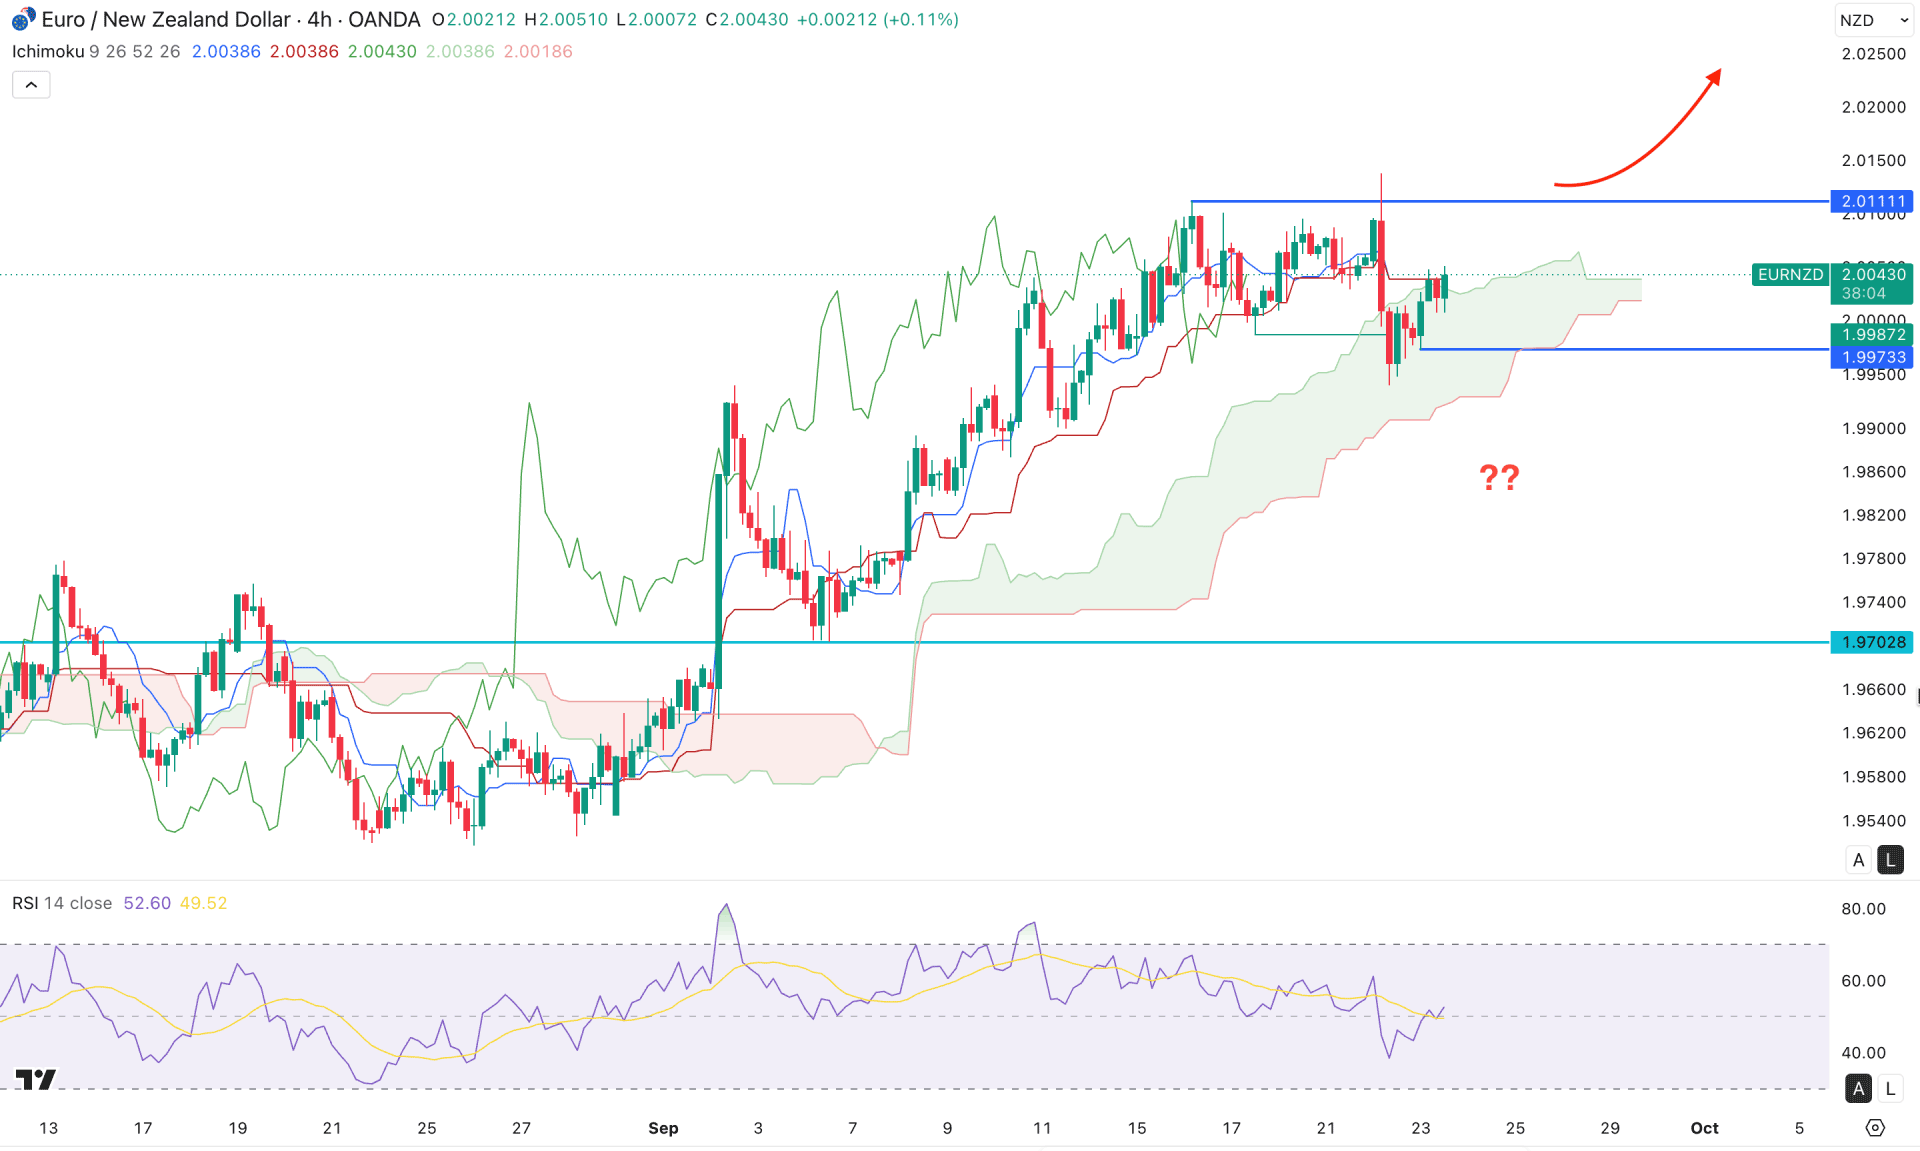
In the four-hour timeframe, a bullish continuation is visible, even though minor selling pressure came at the 2.0000 psychological line. The price went sideways and created a new swing low but was unable to break below the Kumo Cloud area. In the future cloud, the thickness is not solid, and both lines are heading sideways, signaling weaker buying pressure in the market.
In the indicator window, the Relative Strength Index rebounded below the 50.00 line but aimed higher and recovered above the 50.00 level without testing the 30.00 oversold line.
Based on this structure, the recent swing low formation at the cloud support, with the recovery above the dynamic Kijun-sen level, signals a bullish continuation opportunity toward the immediate resistance at the 2.0111 level. Primarily, overcoming the 2.0111 level could be a remarkable achievement that can resume the existing bullish trend at any time.
On the bearish side, multiple barriers are visible, where the immediate support level is at the 1.9973 level. Breaking below this line could increase the possibility of forming a bearish cloud breakout. However, a valid breakout with a retest is needed before heading toward the 1.9702 level.
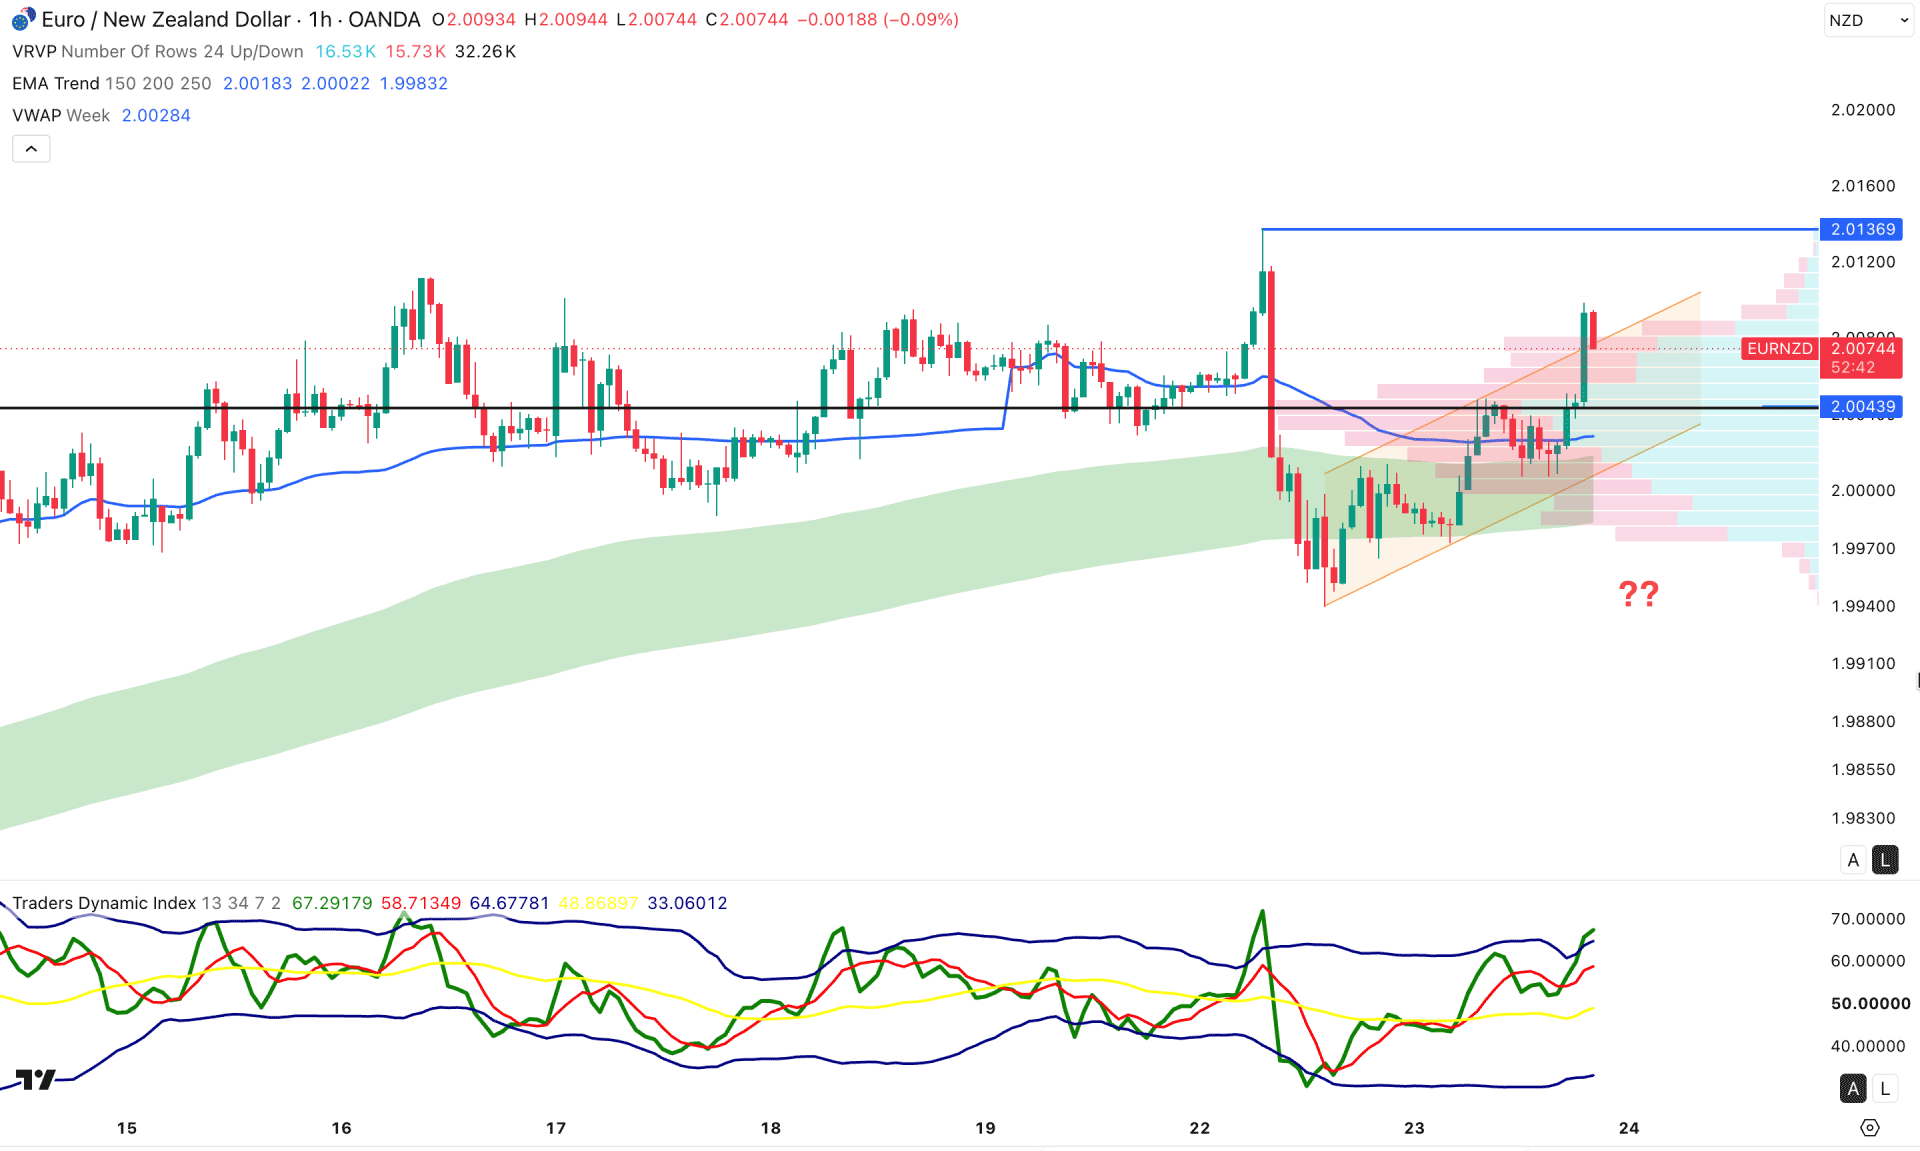
Based on the hourly market structure, the EURNZD price faced counter-bearish pressure from the 2.0000 psychological level, which is insignificant for considering a reversal.
After creating a swing low, the price aimed higher and is currently testing the 50% Fibonacci retracement level of the bearish swing. However, the recent buying pressure with a swing low formation signals a possibility of recovery, as the price rebounded above the high-volume line, supported by the weekly VWAP.
In this structure, the EMA wave is working as a major support, even though it remains flat in the near-term section. The Traders Dynamic Index is signaling a possible overbought condition, as the current line is heading above the 60.00 line.
Based on the overall market structure, a recovery above the 2.0000 level is a remarkable sign for buyers, which increases possibility of recovering the loss incurred from the 2.0136 swing high.
On the other hand, the price is aiming higher within an ascending channel formation, from where a channel break, with a new swing low formation below the EMA wave could signal for more downside possibilities toward the 1.9810 area.
Based on the overall market structure, EURNZD is trading within a crucial premium zone, where a considerable correction is pending. Although the price is trading at the channel resistance, a possible breakout is present, but investors should closely monitor the price action under the channel resistance. A valid breakout with the recovery of the existing swing high could resume the bullish impulse at any time.


