
Published: April 12th, 2022
The New Zealand Central bank will sit this week where the possibility of a rate hike is high. Moreover, while other major countries struggle with the interest rate adjustment, RBNZ has already raised the rate three consecutive times.
Market participants believe that the bank will lift the cash rate by a quarter percentage to 1.25% at tomorrow’s meeting. Moreover, many economists believe that the possibility of increasing the rate to 1.5% is high. If the actual rate comes at 1.5%, we may expect immediate selling pressure in the EURNZD price.
On the other hand, the EUR failed to show a bullish momentum as the German ZEW survey declined modestly from -39.3 to -41. Although the result came at better than expected -48, it is still below the last consequence of -39.3. Finally, the EU economic sentiment index also moved down from -38.7 to -43, indicating a weaker economic outlook for the Eurozone economy. EURNZD price remained choppy during the news release, but a sharp movement may come after the RBNZ rate decision.
Let’s see the future price direction from the EURNZD technical analysis.
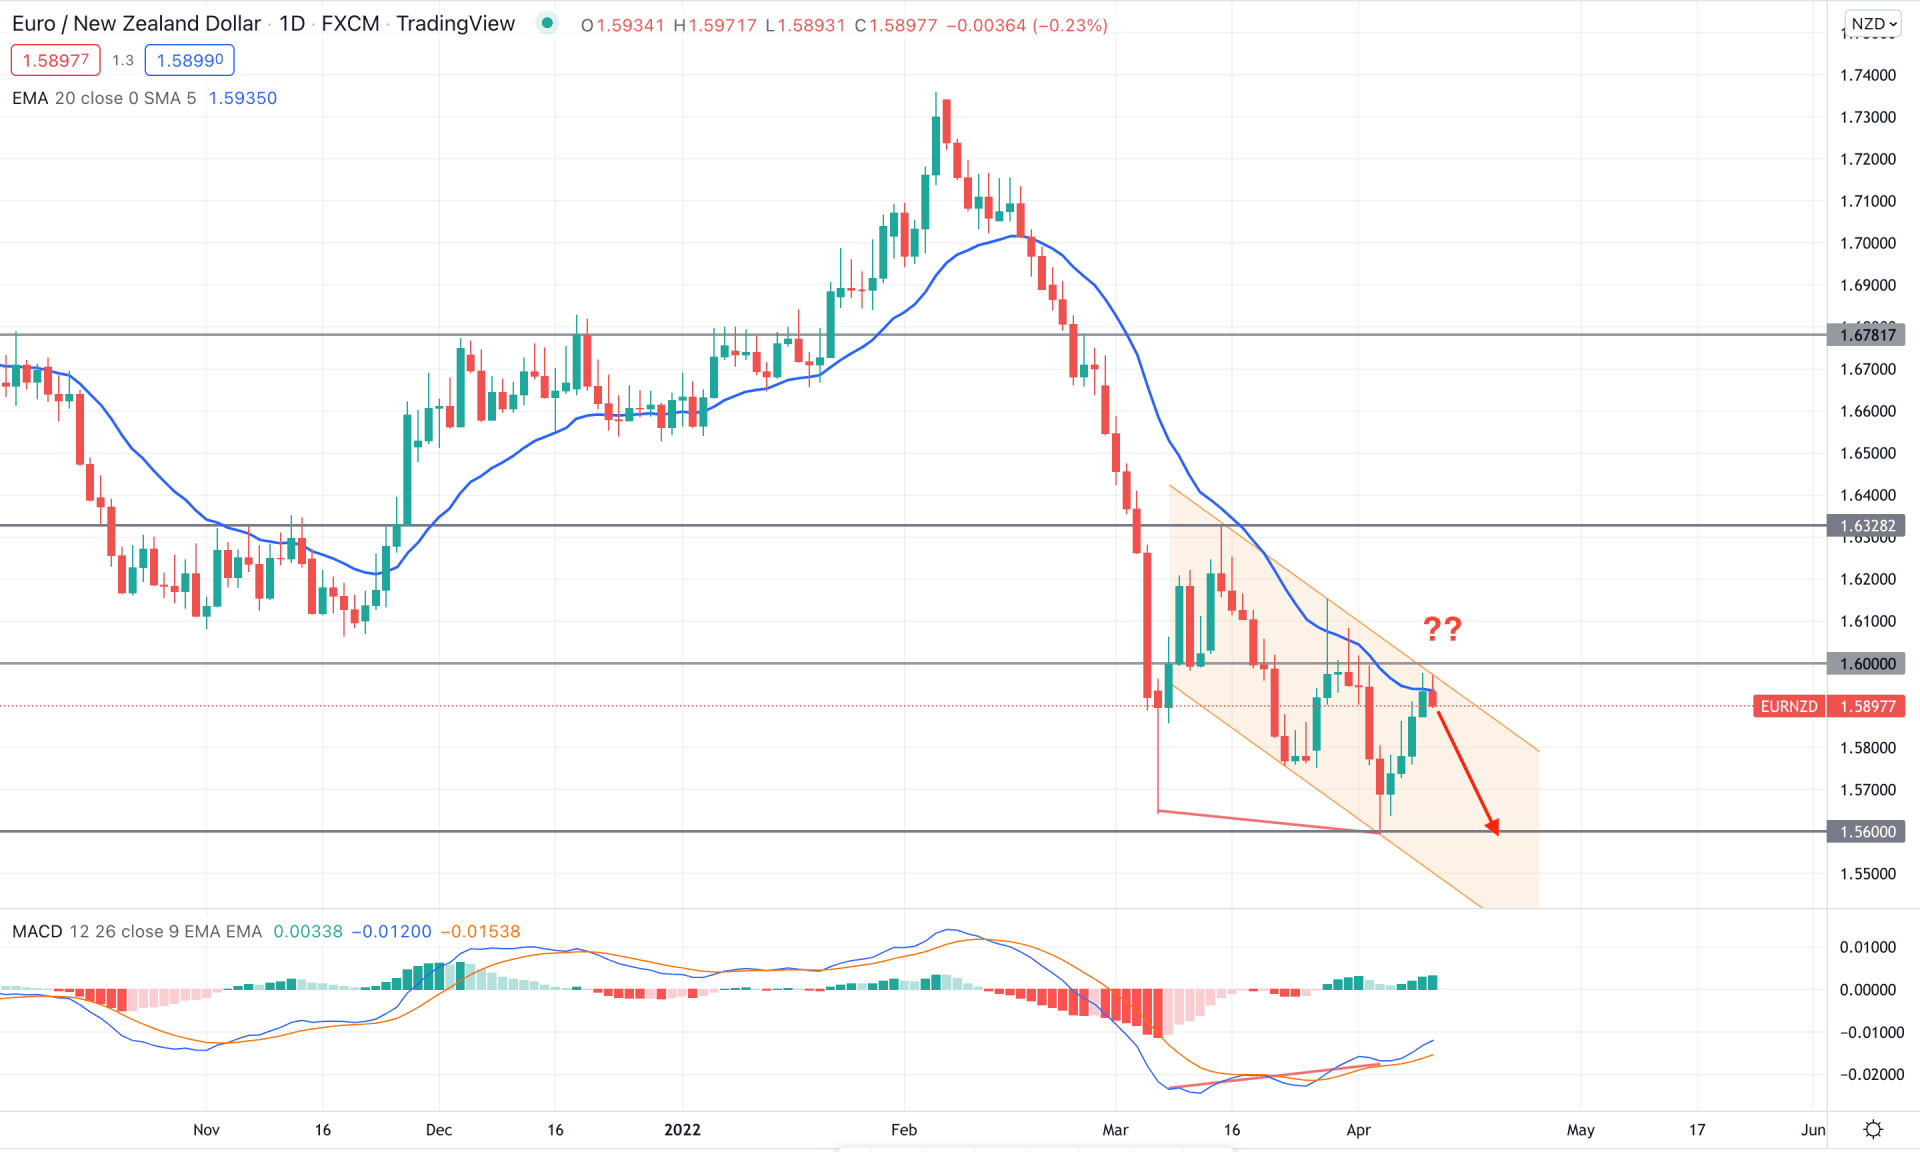
EURNZD daily touched the peak of 1.7357 level at the beginning of 2022 and moved lower with an impulsive bearish pressure. As a result, the price moved below the dynamic 20 EMA and retested the dynamic level after 934 pips bearish movement. Moreover, the most recent chart shows that the price is trading within a bearish channel where the dynamic 20 EMA works as minor resistance.
The above image shows how the price trades at the dynamic 20 EMA while the 1.6000 works as important static resistance. Moreover, in the indicator window, the MACD Histogram turned bullish with a divergence between the MACD line and the price. Therefore, the corrective bearish pressure after an impulse is the primary sign of a possible trend reversal.
In that case, bulls should wait for the bearish channel breakout and a daily candle above the 1.600 key level before going long in this pair. On the other hand, as the current price is still bearish with a break of the structure of 1.5753 swing low, a bearish daily close below the dynamic 20 EMA might extend the current selling pressure towards the 1.5600 level.
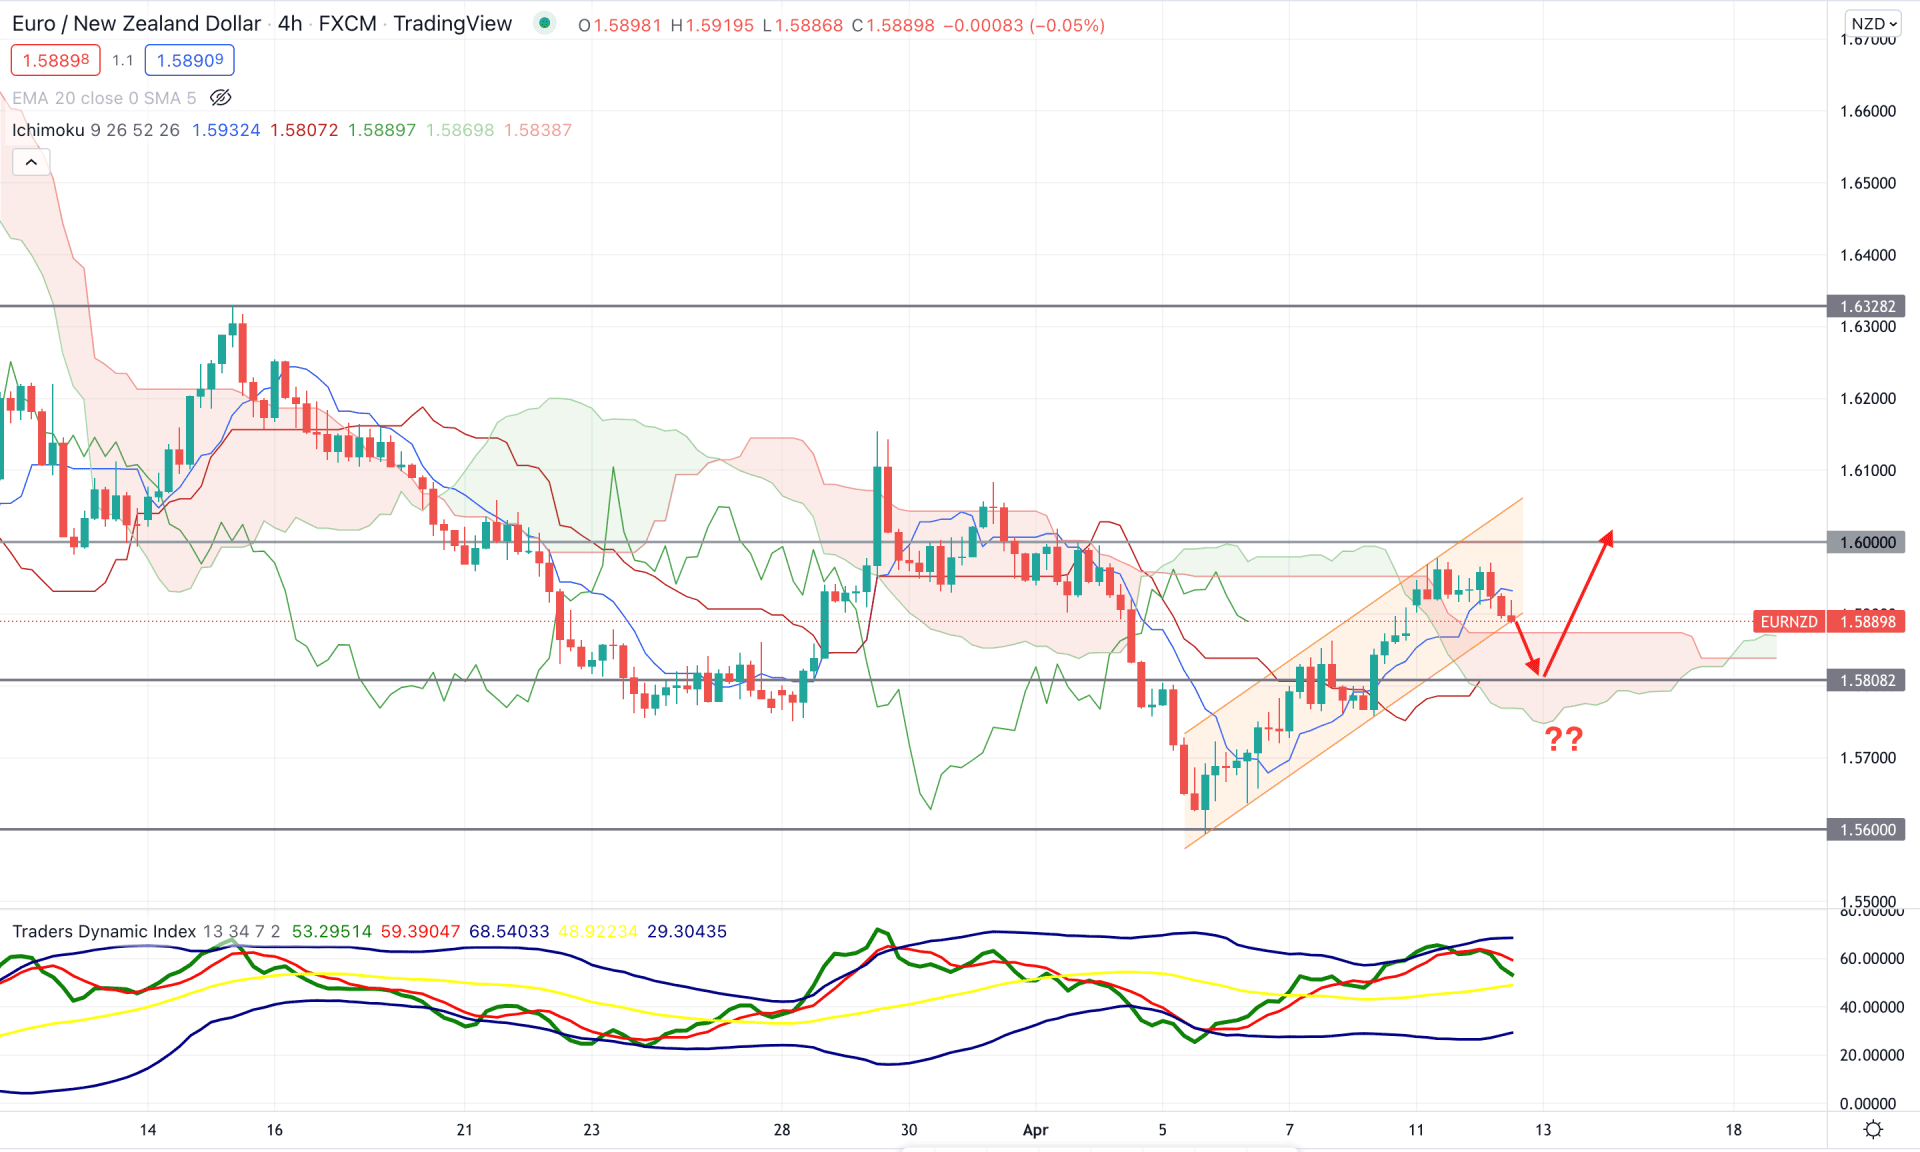
The broader market context in the EURNZD H4 chart is corrective; the price reached above the Kumo Cloud several times but failed to hold the momentum. Moreover, in the future cloud, Senkou Span A is above Senkou Span B, which is a sign of a possible buying pressure on the price. However, the corrective price action and bullish channel breakout might be a bearish factor for the EURNZD price.
The above image shows how sellers’ sentiment changed its position from bullish to bearish as the TDI indicator reached the upper band. However, the current TDI line is still above the 50 level while the dynamic Kijun Sen is below the price. The bearish opportunity is potent if the TDI reaches below the 50 level with a bearish H4 candle below the 1.5808 level.
Based on the current price behavior, investors should wait for multiple confirmations to go short in this pair starting from channel breakout and violation of dynamic Kijun Sen. In that case, the primary bearish would be 1.5600 level from where a bullish pressure may come.
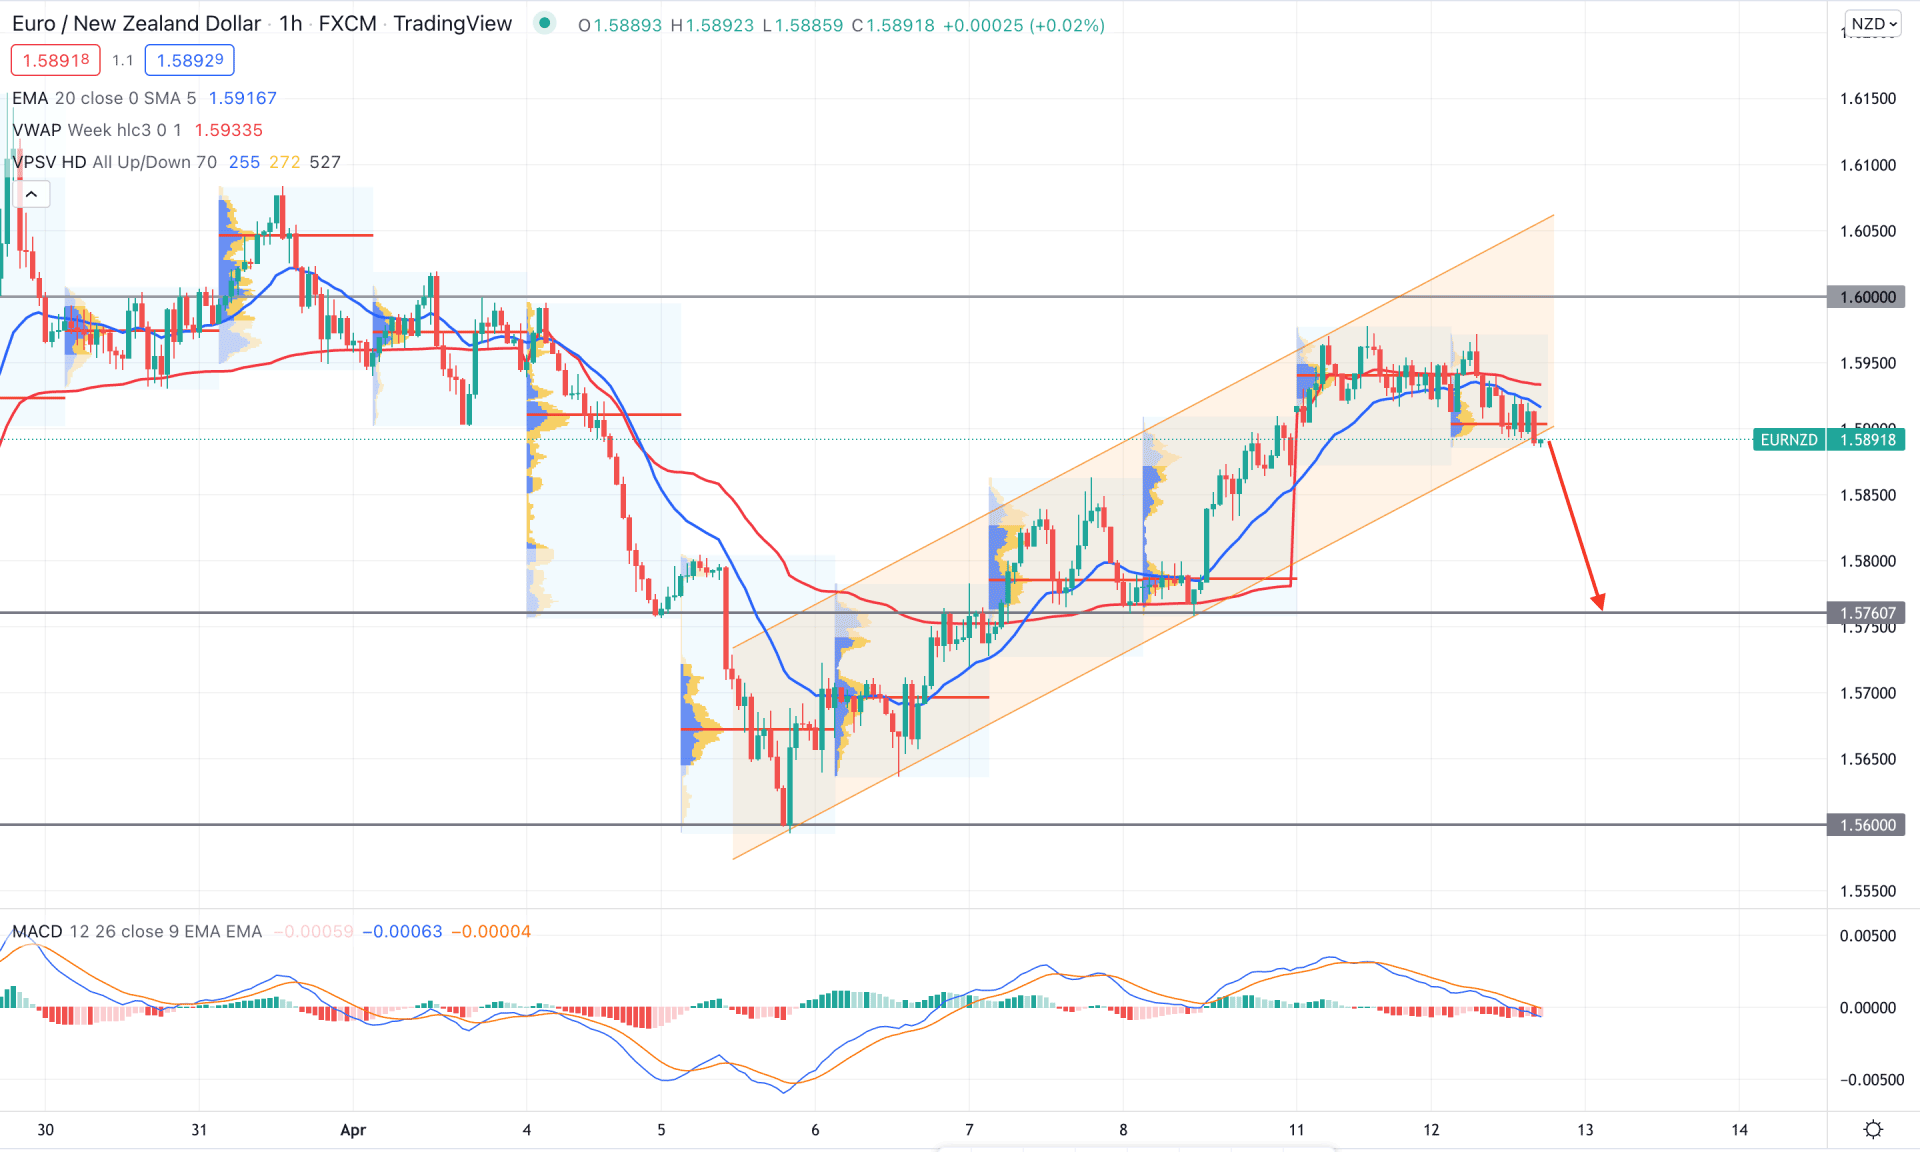
In the intraday chart, EURNZD is trading within a bearish pressure in the intraday chart as the current price is below the dynamic 20 EMA and weekly VWAP. Moreover, the latest intraday high volume level is at 1.5903, where the current barrier for bears is the trendline support.
The above image shows how the MACD Histogram changed its direction from bullish to bearish while the MACD line is above the histogram. Moreover, the dynamic weekly VWAP is above the price which may create additional selling pressure on the price. Therefore, a new H1 candle below the bullish channel support would activate the bearish opportunity towards the 1.5760 support level. On the other hand, the bearish opportunity is valid as long as the price trades below the 1.600 key resistance level.
Based on the current multi-timeframe analysis, EURNZD bears are still active in the price where the extension of the current bearish channel is likely to happen. Moreover, the hawkish sentiment from the RBNZ rate decision might increase the selling pressure where the ultimate target is to test the 1.5600 psychological level.


