
Published: May 8th, 2025
Although there is still volatility, financial markets have partially recovered from their severe decline in early April, according to remarks made by New Zealand Prime Minister Christopher Luxon on Thursday. Luxon voiced optimism in New Zealand's economic revival while underscoring the significance of the global environment.
Christian Hawkesby, the governor of the Reserve Bank of New Zealand (RBNZ), cautioned that the nation is still susceptible to interruptions in international trade brought on by US tariff policy. Hawkesby cited persistent global market breakdowns and inadequate labour market statistics as key issues.
According to the federal statistics agency Destatis, industrial output in the Eurozone's economic powerhouse increased 3% month over month, compared to a 1.3% decline in February and an anticipated 0.8% growth.
In March, German industrial production fell 0.2% year-over-year (YoY), compared to -4.1% in February.
In addition, Germany's March trade balance was EUR 21.1 billion, down from EUR 17.9 billion and EUR 19.1 billion predicted.
The ECB, meanwhile, set a dovish stance in its guidelines and dropped its base rate by 25 basis points the previous month, bringing it to 2.25%. The discrepancy between both central banks is growing, and the medium-term outlook for the euro is being hampered by the fact that markets are now factoring in another drop as early as June.
According to positioning data, market participants are still favoring the euro despite dovish ECB indications. As of April 29, CFTC data showed that net long positions had increased to a multi-month record of 75.8K contracts. Additionally, open interest jumped above 730K, which was the highest since September 2024.
Let's see how the EURO can perform against the Kiwi from the EURNZD technical analysis:
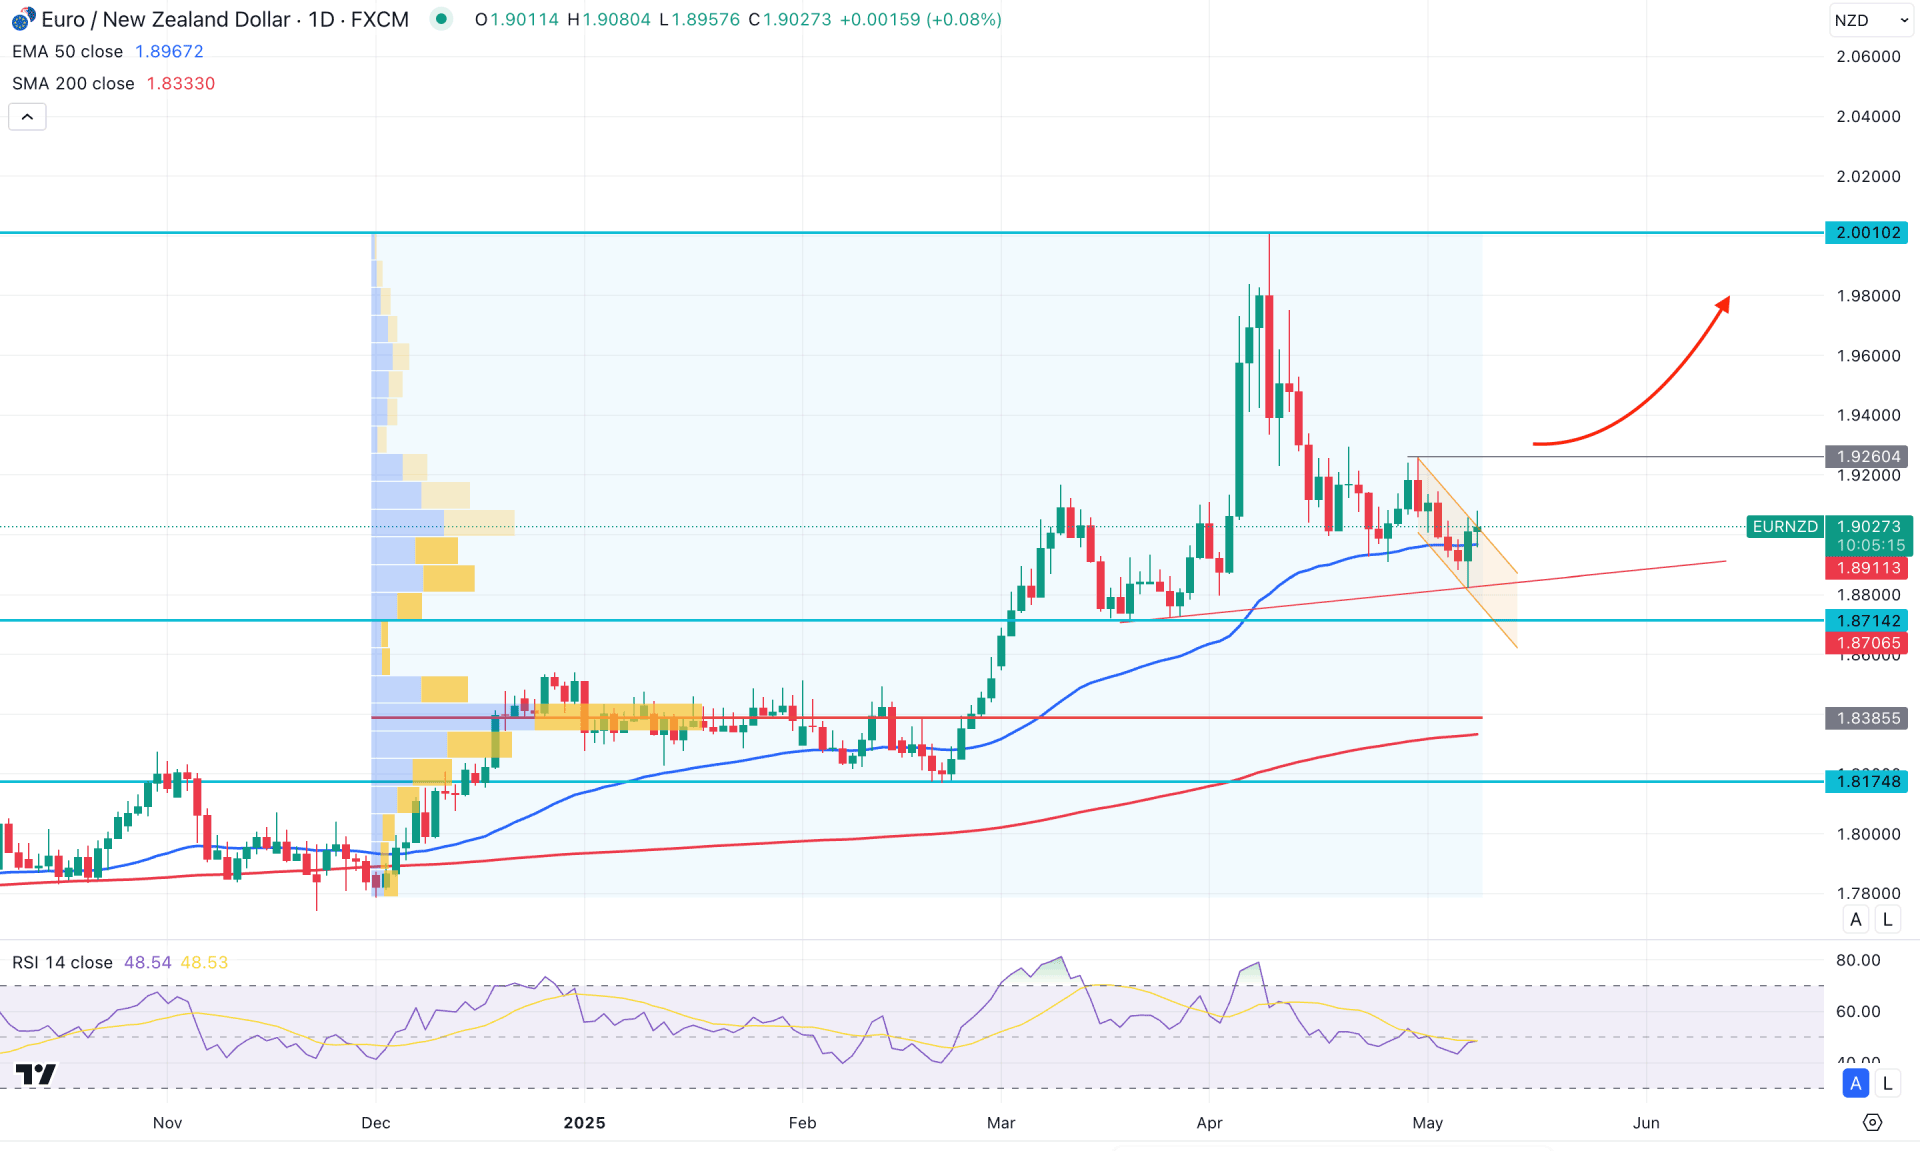
On the daily chart of EURNZD, the recent price action shows a decent recovery after reaching a multi-year high. As the current price finds support from the rising trendline, any rebound could resume the ongoing bullish trend.
On the higher timeframe, the price briefly spiked above the 15-year high but failed to maintain momentum. As a result, the recent monthly candle closed as a large gravestone doji, signalling indecision. This liquidity sweep from the yearly high suggests a possible market reversal, but further confirmation is required.
The recent weekly candles also indicate a recovery from the 2.0000 peak, although no clear signs of a counter-trend reversal are yet visible.
Looking at the volume structure, the price is trading in the buyer's zone. The active support level since December 2024 lies at 1.8395, which is below the current price. Another high-volume area from April 2025 also sits in line with the market, indicating confluence buying pressure. As long as the price remains above the 1.9046 high-value area, a new bullish leg could be initiated.
In the main price chart, the 50-day Exponential Moving Average is currently acting as immediate support, with a recovery evident from the daily candles. The most recent daily candle shows that the price grabbed liquidity from the 1.8886 low—the lowest level in the past 24 days.
However, the price is now facing minor resistance from a descending channel, while the gap between the current price and the 200-day SMA is approximately 600 pips.
In the indicator window, the Relative Strength Index (RSI) remains sideways around the 50.00 line, following multiple tests of the 70.00 overbought level.
Based on the current market outlook, a daily candle breakout above the 1.9260 level could offer a conservative long entry. However, failure to hold above this channel resistance could lead to medium-term selling pressure, with another bullish rejection possibly emerging from the 1.8800–1.8600 zone. In both cases, a stable price action above the 50 EMA is essential.
Conversely, if the existing indecision from the higher timeframe leads to a daily close below 1.8790, the buying pressure may be invalidated. This scenario could result in a consolidation phase after forming a new monthly low, potentially extending the bearish pressure towards the 1.8174 level.
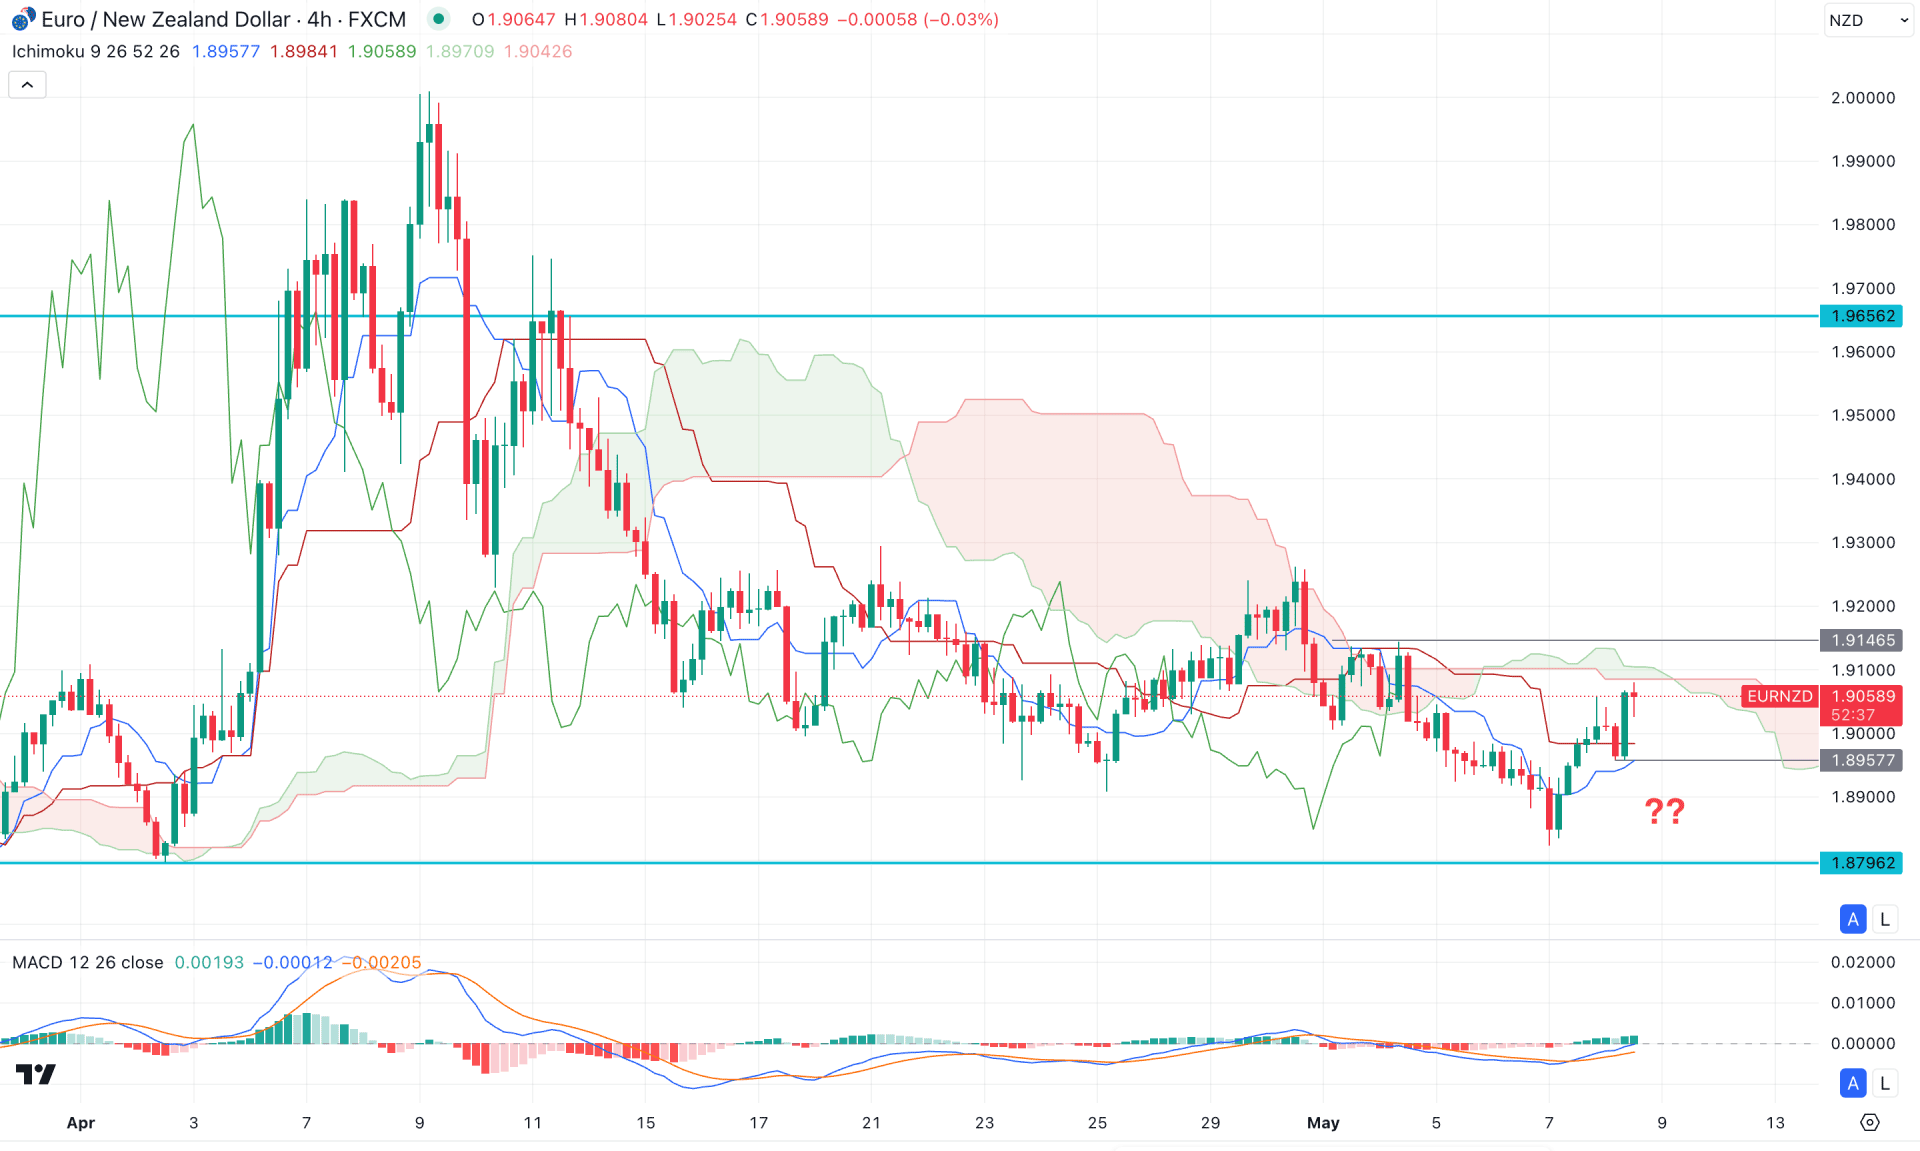
In the 4-hour timeframe, the current price is trading within a seller's zone, as the Kumo cloud area is located above it. However, the most recent recovery from the 1.8823 level came with counter-impulsive momentum, creating a bullish price action above the dynamic support.
As long as the price remains above this dynamic key level, the bullish structure remains intact. On the other hand, the future cloud remains bearish, suggesting that the medium-term trend is still indecisive.
In the secondary indicator window, the MACD signal line shows a bullish rebound, while the histogram has remained steady for more than seven and a half periods.
Based on this outlook, any immediate bearish breakout with a 4-hour candle close below the 1.8957 level could trigger a bearish trend continuation opportunity, targeting the 1.8790 level.
On the other hand, an extended buying pressure above the 1.9146 level, followed by consolidation, could indicate further bullish momentum. In that case, valid price action confirmation would be needed before aiming for the 1.9600 level.
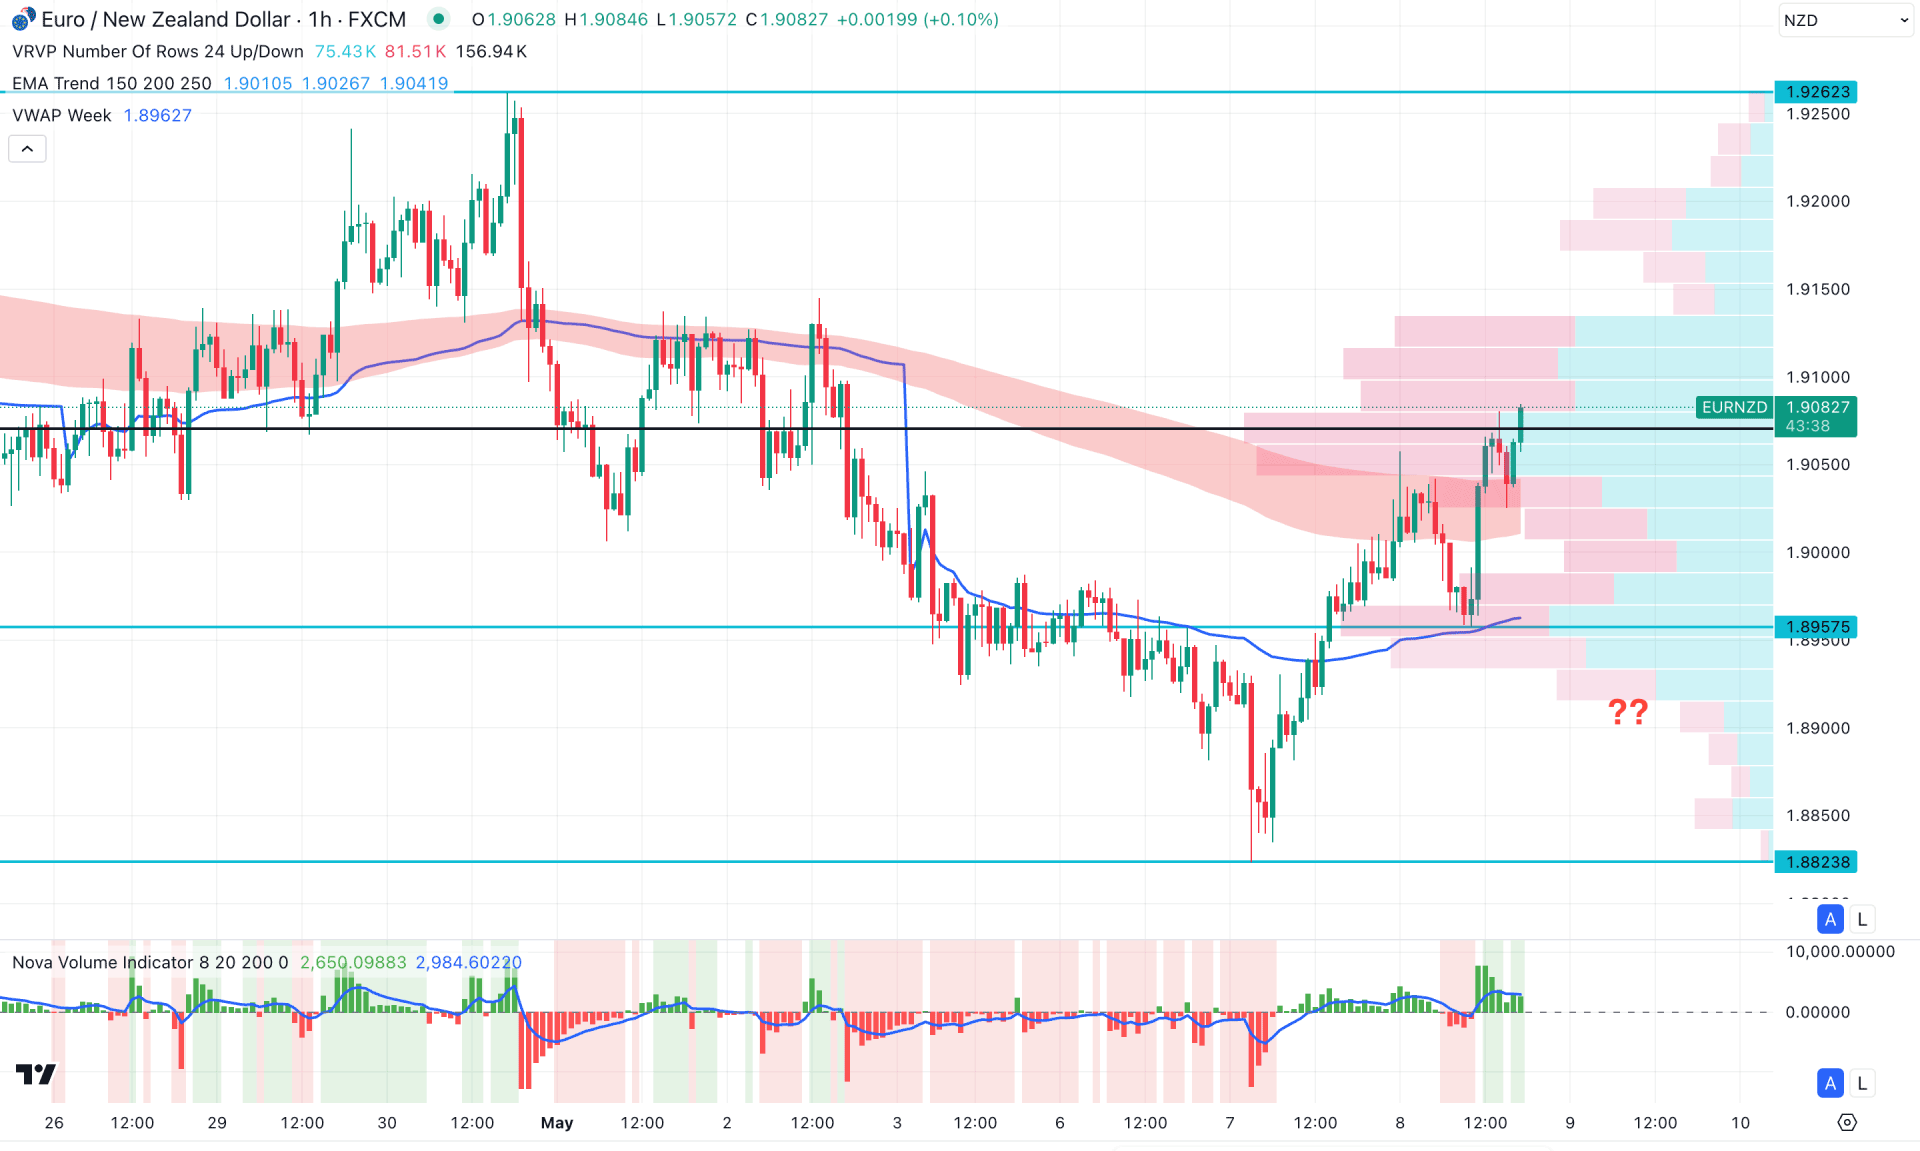
On the hourly time frame, bullish price action is visible as the current price is trading above the moving average wave. However, the high-volume node is close to the current price, which suggests that more confirmation is needed before anticipating further upward pressure.
On the other hand, the volume histogram indicates a strong buyer presence in the market, supported by bullish alignment with the weekly VWAP line.
Based on this outlook, investors might find a bullish continuation opportunity after a confirmed consolidation above the moving average wave. Conversely, an immediate bearish reversal with an hourly close below the VWAP level could invalidate the bullish outlook and create a new swing low below the 1.8823 level.
Based on the current market outlook, the EURNZD price is trading in the premium zone from where the bullish continuation needs sufficient confirmation. The intraday price is already bullish, from where a trend trading opportunity could come after revisiting the support area.


