
Published: June 4th, 2026
Fresh skirmishes in the Gulf raised oil prices and reduced risk appetite, which may affect the NZD-related pair anytime.
However, the Reserve Bank of New Zealand's (RBNZ) hawkish indications might support the Kiwi. The Governor of the Reserve Bank of New Zealand (RBNZ), Anna Breman, stated this past week that the Official Cash Rate (OCR) is expected to rise sooner and more than previously anticipated.
She cited weaker growth, increased input costs throughout New Zealand and its trade partners, and inflation caused by the Middle East crisis. The New Zealand policy outlook has been repriced by markets, and traders now anticipate further increases until early 2027.
On the other hand, the Eurozone Retail Sales report for April shows a steeper fall of 0.4%. Retail sales, a crucial indicator of consumer spending, increased by 0.8% in March after a 0.1% dip. The consumer spending indicator increased by 1% on an annualized basis, which was quicker than predictions of 0.3% but weaker than the prior figure of 2.1%, which was revised up from 1.2%.
Even though monthly retail sales in the Eurozone have declined sharply, the Euro (EUR) has seen a significant increase across European commerce.
Let's see the upcoming price direction from the EURNZD technical analysis:
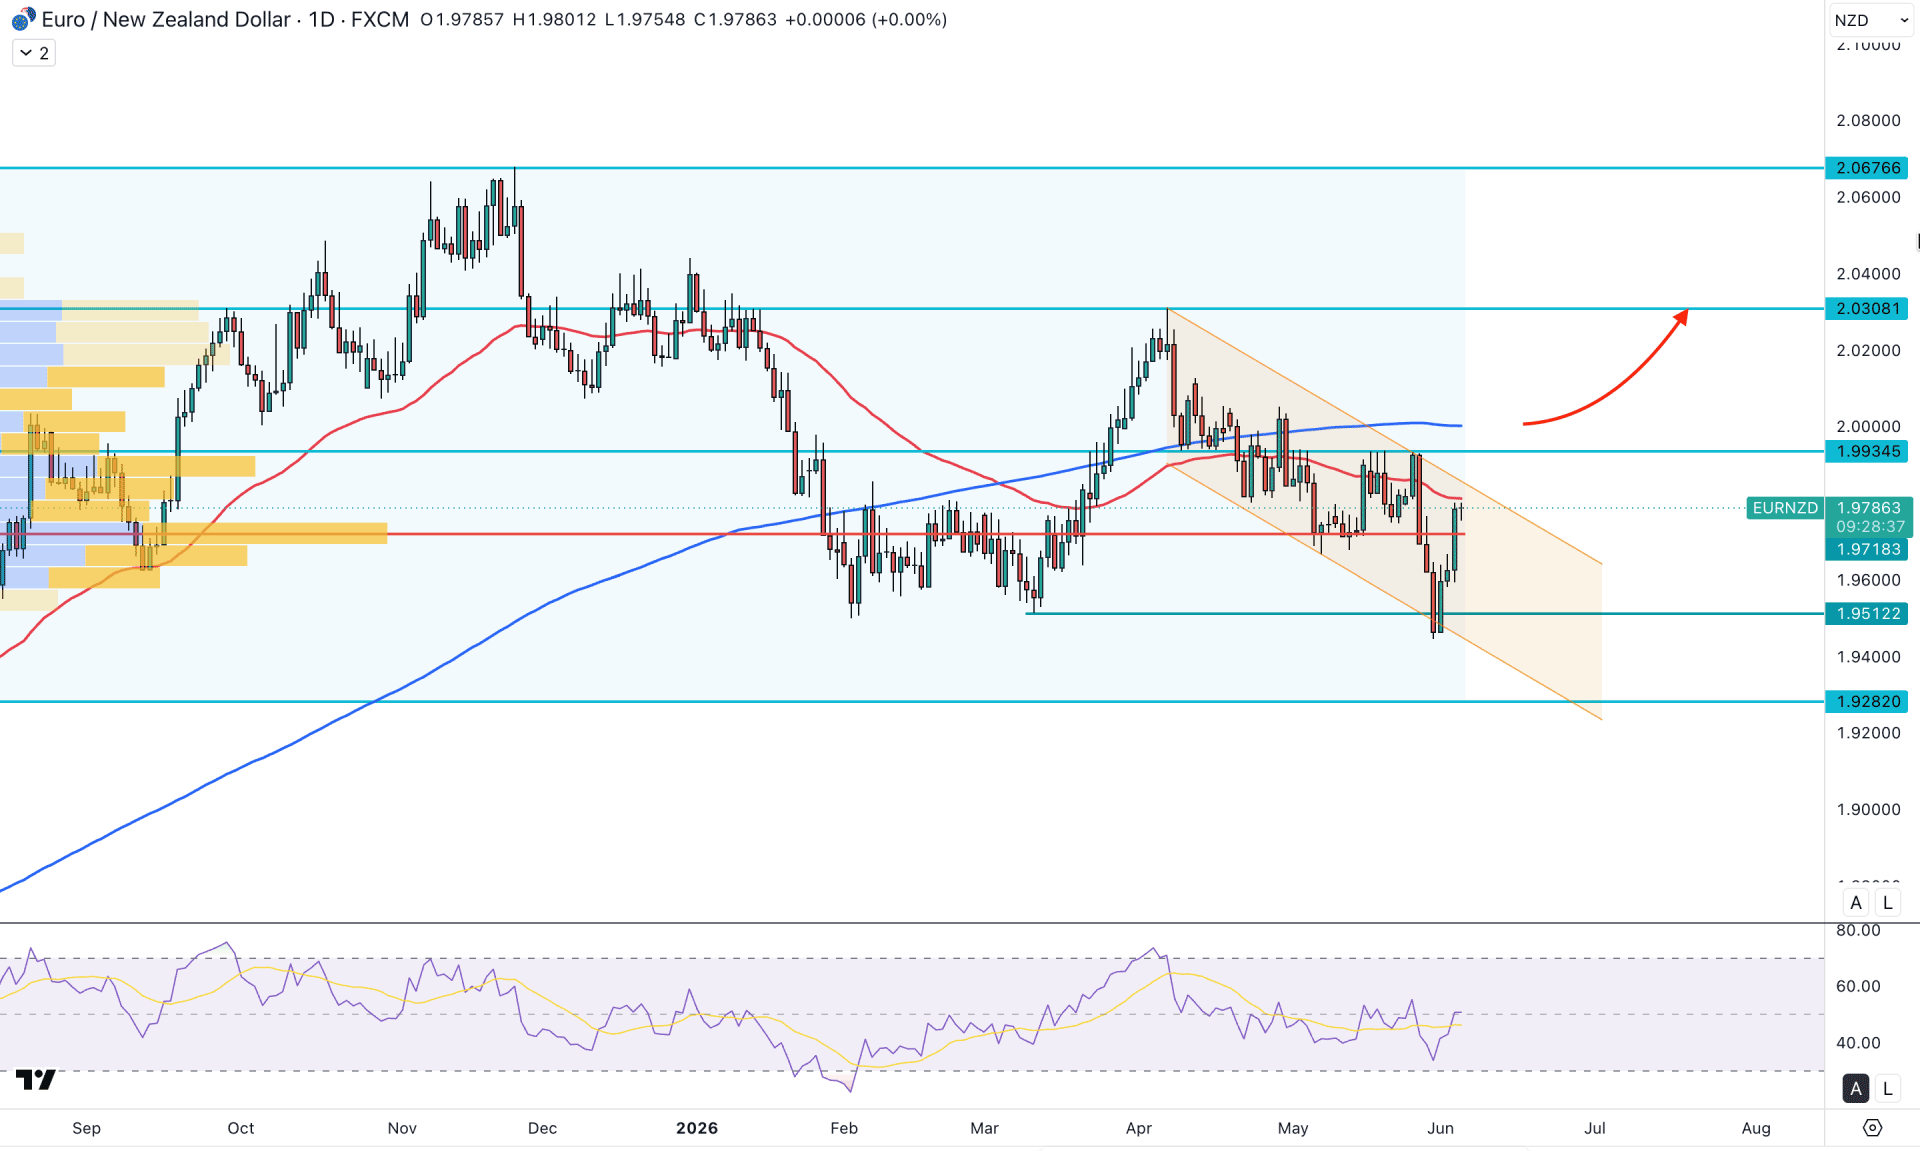
In the daily chart of EURNZD, a strong sell-side liquidity sweep is visible before forming a bullish rebound with an impulsive momentum. As the primary trend is corrective, a valid bullish channel breakout could open a long opportunity.
Looking at the higher timeframe, the existing market momentum is corrective on the monthly chart, with two consecutive bearish monthly closes. However, the current price action is bullish from the monthly open, but more confirmation is needed before anticipating a bullish trend validation. The weekly price shows an immediate buying pressure from the existing weekly close, from where a bullish recovery is still pending before forming a rebound.
In terms of volume, the recent buying pressure is solid, as the largest activity level since August 2025 is just below the current price. Primarily, a bullish daily candle is present from the high volume line, but the descending channel level has yet to break.
Despite the bullish recovery from the 1.9512 key support level, there are several barriers to overcome. The price is immediately facing resistance from the 50-day Exponential Moving Average, which is just above the current price and within the descending channel. Moreover, the 200 SMA is flat above the 1.9934 resistance level, signaling further barriers to buyers.
Looking at the price chart, a bullish recovery initiated from March 2026 is having a decent correction with a liquidity sweep before forming a rebound above the high line. It is a primary sign of buyers' interest in the market from the discounted zone. Despite that, the existing price action could work as a bullish pre-breakout structure from the descending channel. A valid confirmation should occur after the upcoming channel resistance.
In the indicator window, a valid rebound is in the RSI, as the current line is hovering at the 50.00 neutral area with more room to grow.
Based on the overall market structure, investors should closely monitor how the price reacts to the descending channel resistance. A bullish break with a close above the 1.9935 level will validate the long-term bullish opportunity targeting the 2.0308 level. Moreover, overcoming this line could open the room for moving beyond the 2.0676 level.
The alternative trading approach is to find a valid bearish rebound from the 50-day EMA. In that case, a sell-side liquidity sweep from the 1.9934 level with a daily close below the 50-day EMA could increase the possibility of channel extension. In that case, the immediate support to look at is the 1.9512 level before moving to the 1.9282 area.
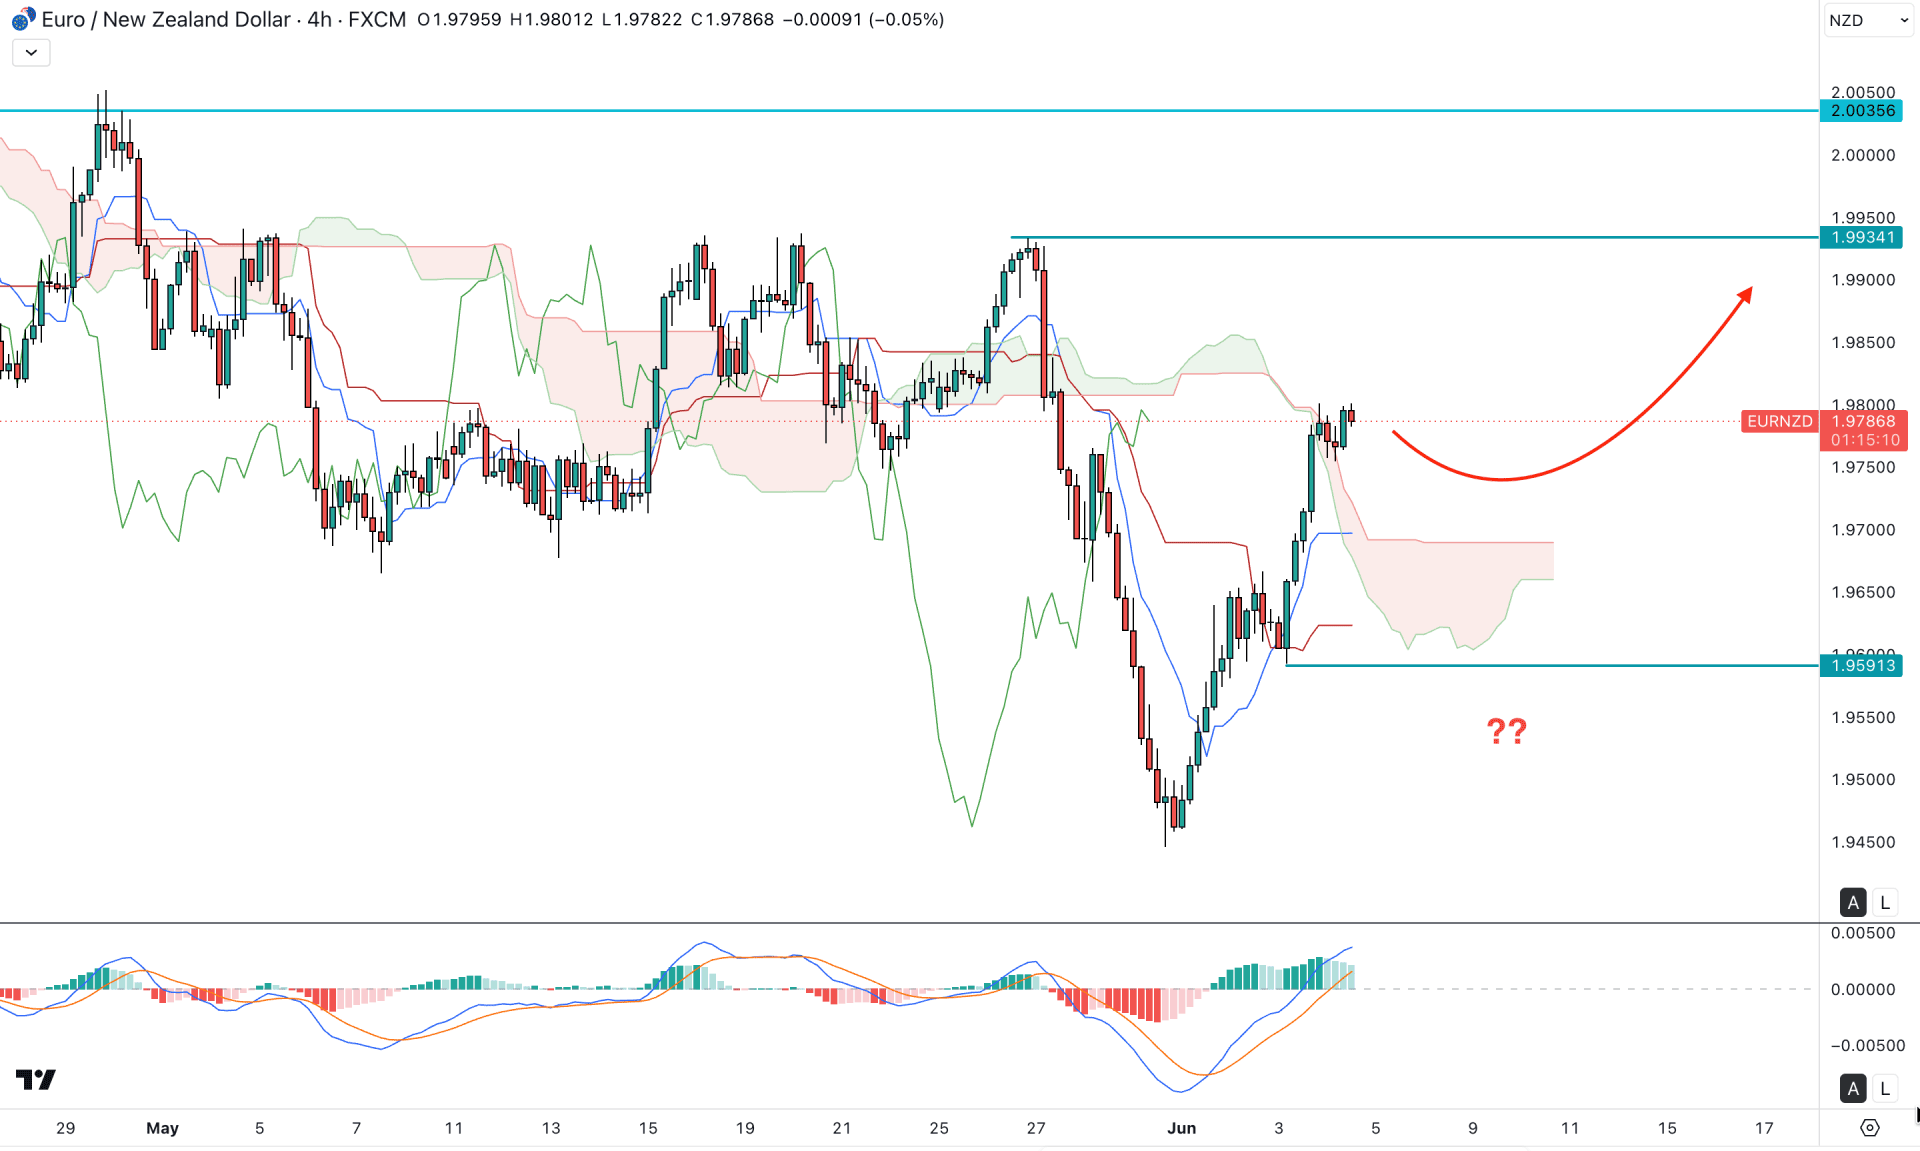
In the H4 timeframe, the most recent price is trading above the Kumo Cloud area with a minor bullish signal. Even though the price showed a long rally from the 1.9450 low, a sufficient bearish correction is pending before validating the breakout.
In the future cloud, both lines are running parallel, signalling indecisive momentum in the future price action. However, the ongoing market pressure is above dynamic lines followed by a bullish crossover, signalling a bullish rebound after a minor recovery.
Based on the overall market structure, EURNZD is likely to form a decent downside correction as signalled by the bearish signal in the MACD signal line.
The immediate support level to look at is the 1.9591 level, which is the ultimate barrier for the bullish driver. Any rebound from the 1.9702 to 1.9591 area could validate the long opportunity targeting the 2.0000 psychological line.
On the other hand, a break below the 1.9591 level with a bearish four-hour close could limit the bullish opportunity and lower the price below the 1.9450 level.
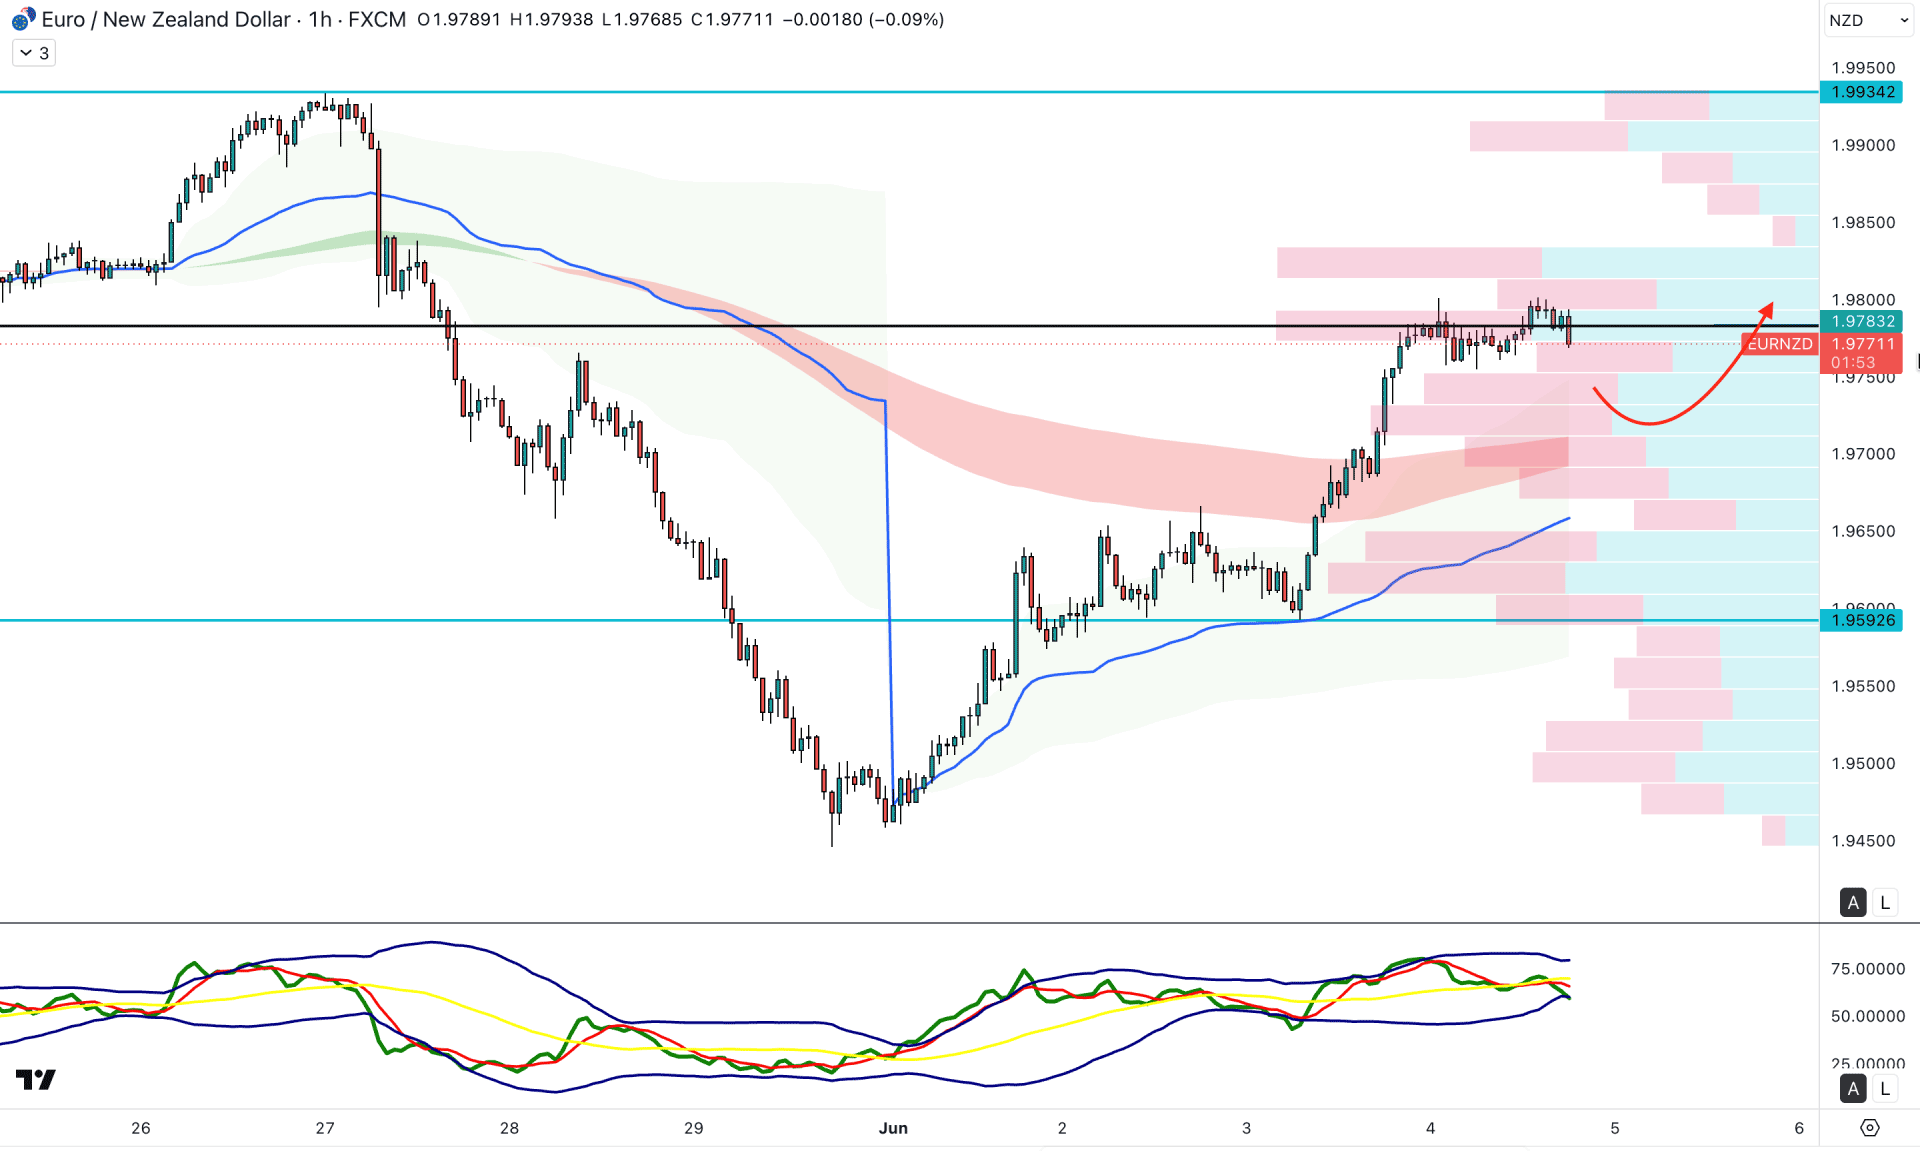
In the hourly timeframe, an ongoing bullish momentum is visible in the EURNZD chart. Higher and higher trading activity is seen at the top. The high volume line is closer to the current price, signaling a potential range breakout. The weekly VWAP level is still below the current price.
In the secondary indicator window, the Traders Dynamic Index has flipped its position and moved below the 50.00 neutral line, suggesting an initial bearish momentum in the price chart.
Based on this outlook, a minor downside recovery is possible, where the immediate support is at the 1.9700 level. In that case, a bullish bounce with solid price action above the 1.9800 level could take the price towards the 1.9934 resistance area.
On the other hand, a failure to hold the price above the weekly VWAP level would initiate a strong bearish pressure targeting the 1.9500 level.
Based on the overall market structure, EURNZD is trading with a bullish pre-breakout structure. The price is trading within a sideways range. Downside pressure from the channel resistance is a crucial level to look at.
As the intraday price is still peaking, a minor correction is highly possible. Moreover, a strong breakout above the channel resistance with a consolidation could be the first sign of a long-term bullish continuation.


