

Published: August 20th, 2026
EURNZD continues to move lower for the second day in a row. The pair weakens as the New Zealand Dollar (NZD) rises on anticipation that the Reserve Bank of New Zealand will raise interest rates again in September.
The Kiwi is circulating with a tiny tailwind, according to strategists, as the NZD is currently trading a bit above the 12-month moving average. The current market valuation is still questionable as the RBNZ is expected to deliver two consecutive rate hikes this year. Although domestic activity remains robust, inflation expectations remain relatively well-anchored.
Meanwhile, Financial markets are optimistic that the European Central Bank (ECB) will hike interest rates at its September meeting. Moreover, the Federal Reserve (Fed) is expected to keep rates unchanged that month.
Let's see the further outlook from the EURNZD technical analysis:
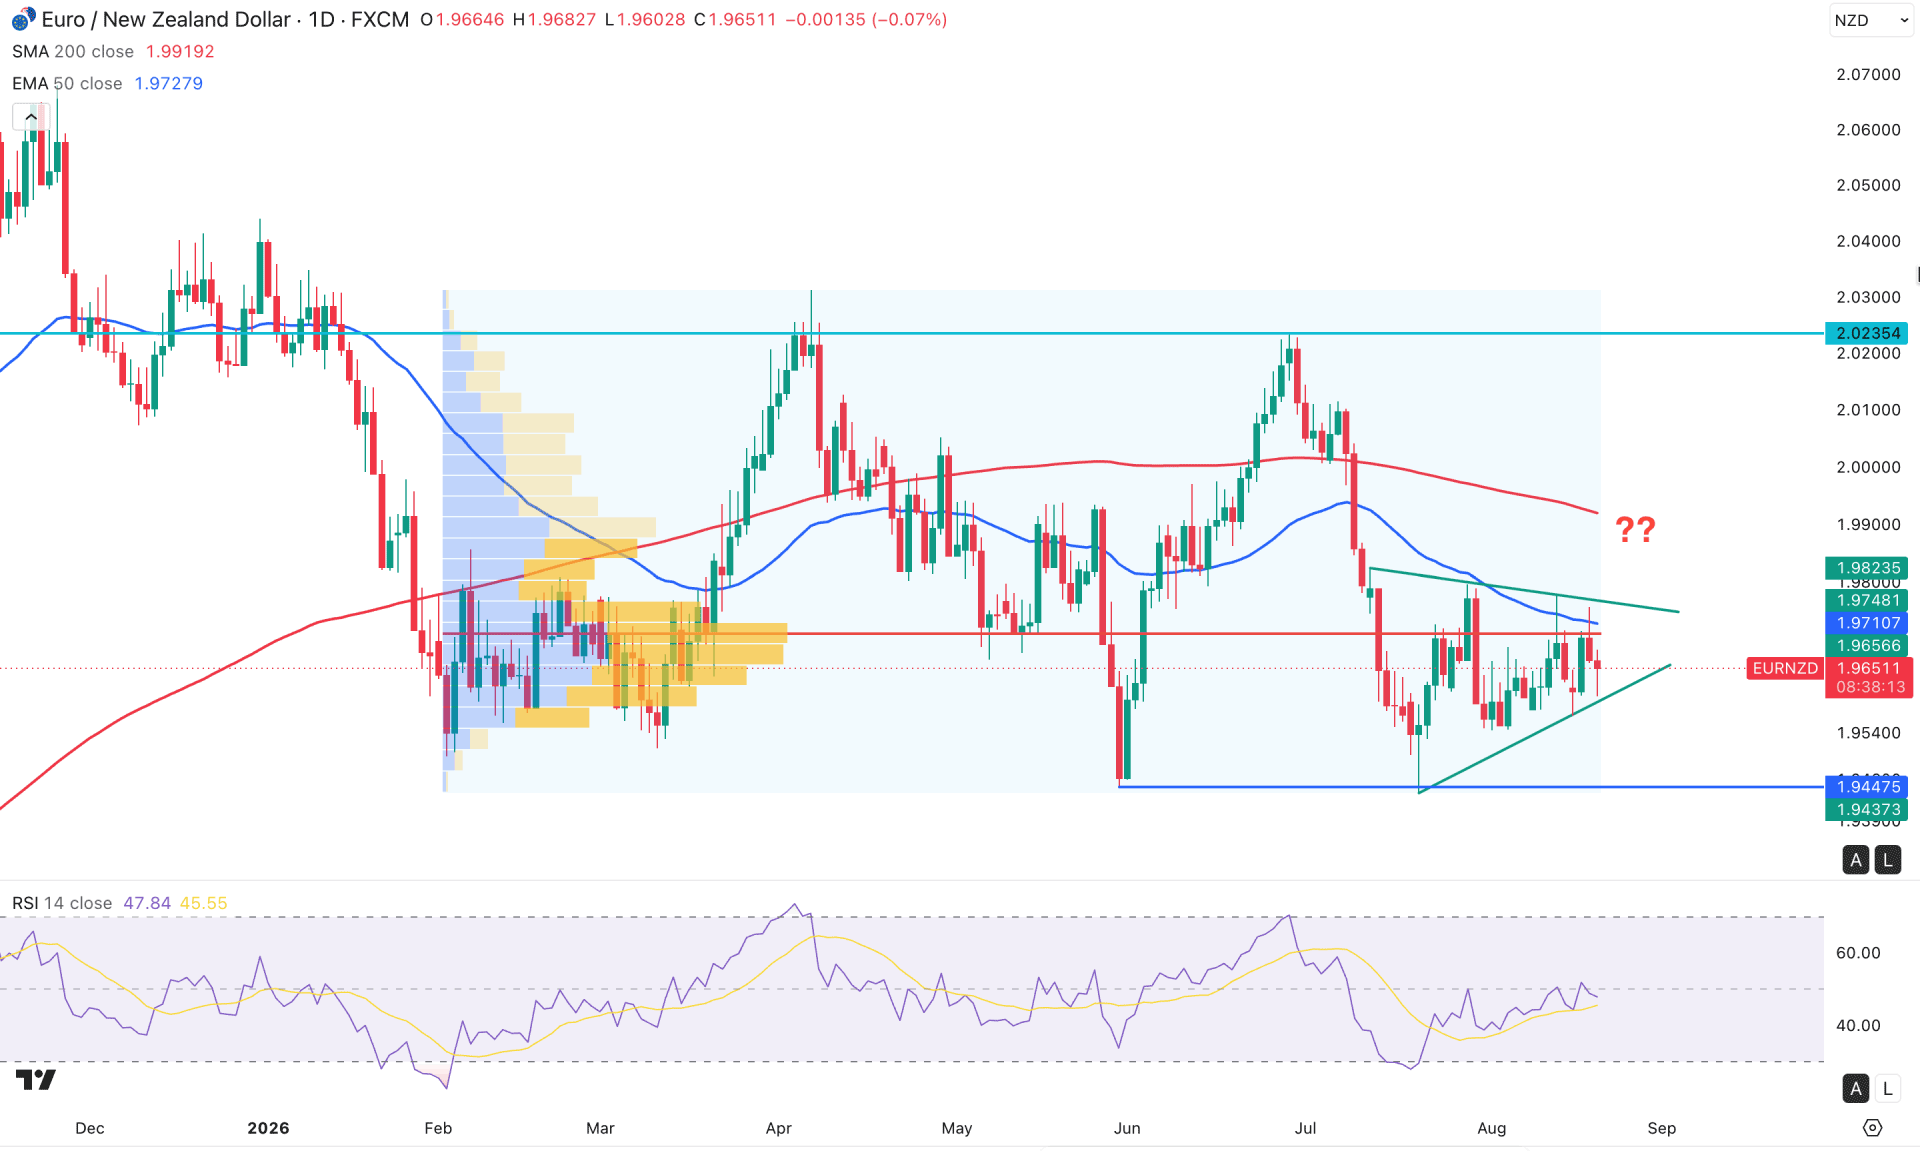
On the daily chart, EURNZD has removed gains after reaching the April 2025 resistance area and formed a bottom. However, after grabbing the sell-side liquidity at the 1.9447 level, price is now consolidating.
From a higher-timeframe perspective, price is trading within a crucial premium zone, where previous attempts to continue higher have failed. Although buying pressure is visible, the current monthly candle is moving sideways after an immediate bearish reversal following the bullish close in June 2026. This suggests that selling pressure remains active. Price is currently trading near the monthly discount area, so further confirmation is needed before expecting a bearish continuation.
The weekly timeframe shows a corrective structure, as several doji candles have formed following the recent sharp upward and downward movement.
In terms of volume, sellers still appear to dominate. The largest volume activity since February 2026 is located around 1.9710, slightly above the current price. Multiple bearish closes from this high-volume area, together with rejection wicks near the key resistance zone, suggest that bearish order building may be underway.
On the main price chart, the 50-day EMA is acting as immediate resistance and maintains a downward slope above the high-volume level. In addition, the 200-day SMA remains above the overall price structure. Its downward slope indicates that it may continue to act as a major resistance level.
The Relative Strength Index shows a similar outlook. The RSI recently rebounded from the 30.00 oversold level but failed to move above the 50.00 neutral line, indicating that bullish momentum remains limited.
Based on the broader market structure, price is trading within a symmetrical triangle pattern. A valid breakout is needed before confirming the next market direction. As current momentum remains bearish, a confirmed break below the triangle support could create a high-probability short opportunity. A daily close below 1.9520 would increase the likelihood of a new swing low below 1.9447, with potential downside toward the 1.8839 support area.
On the other hand, the 1.9447 level remains an important swing low, as price has already swept liquidity below this area. If price grabs sell-side liquidity near the symmetrical triangle support and then recovers above the 50-day EMA, a long opportunity may develop, targeting the psychological 2.0000 level.
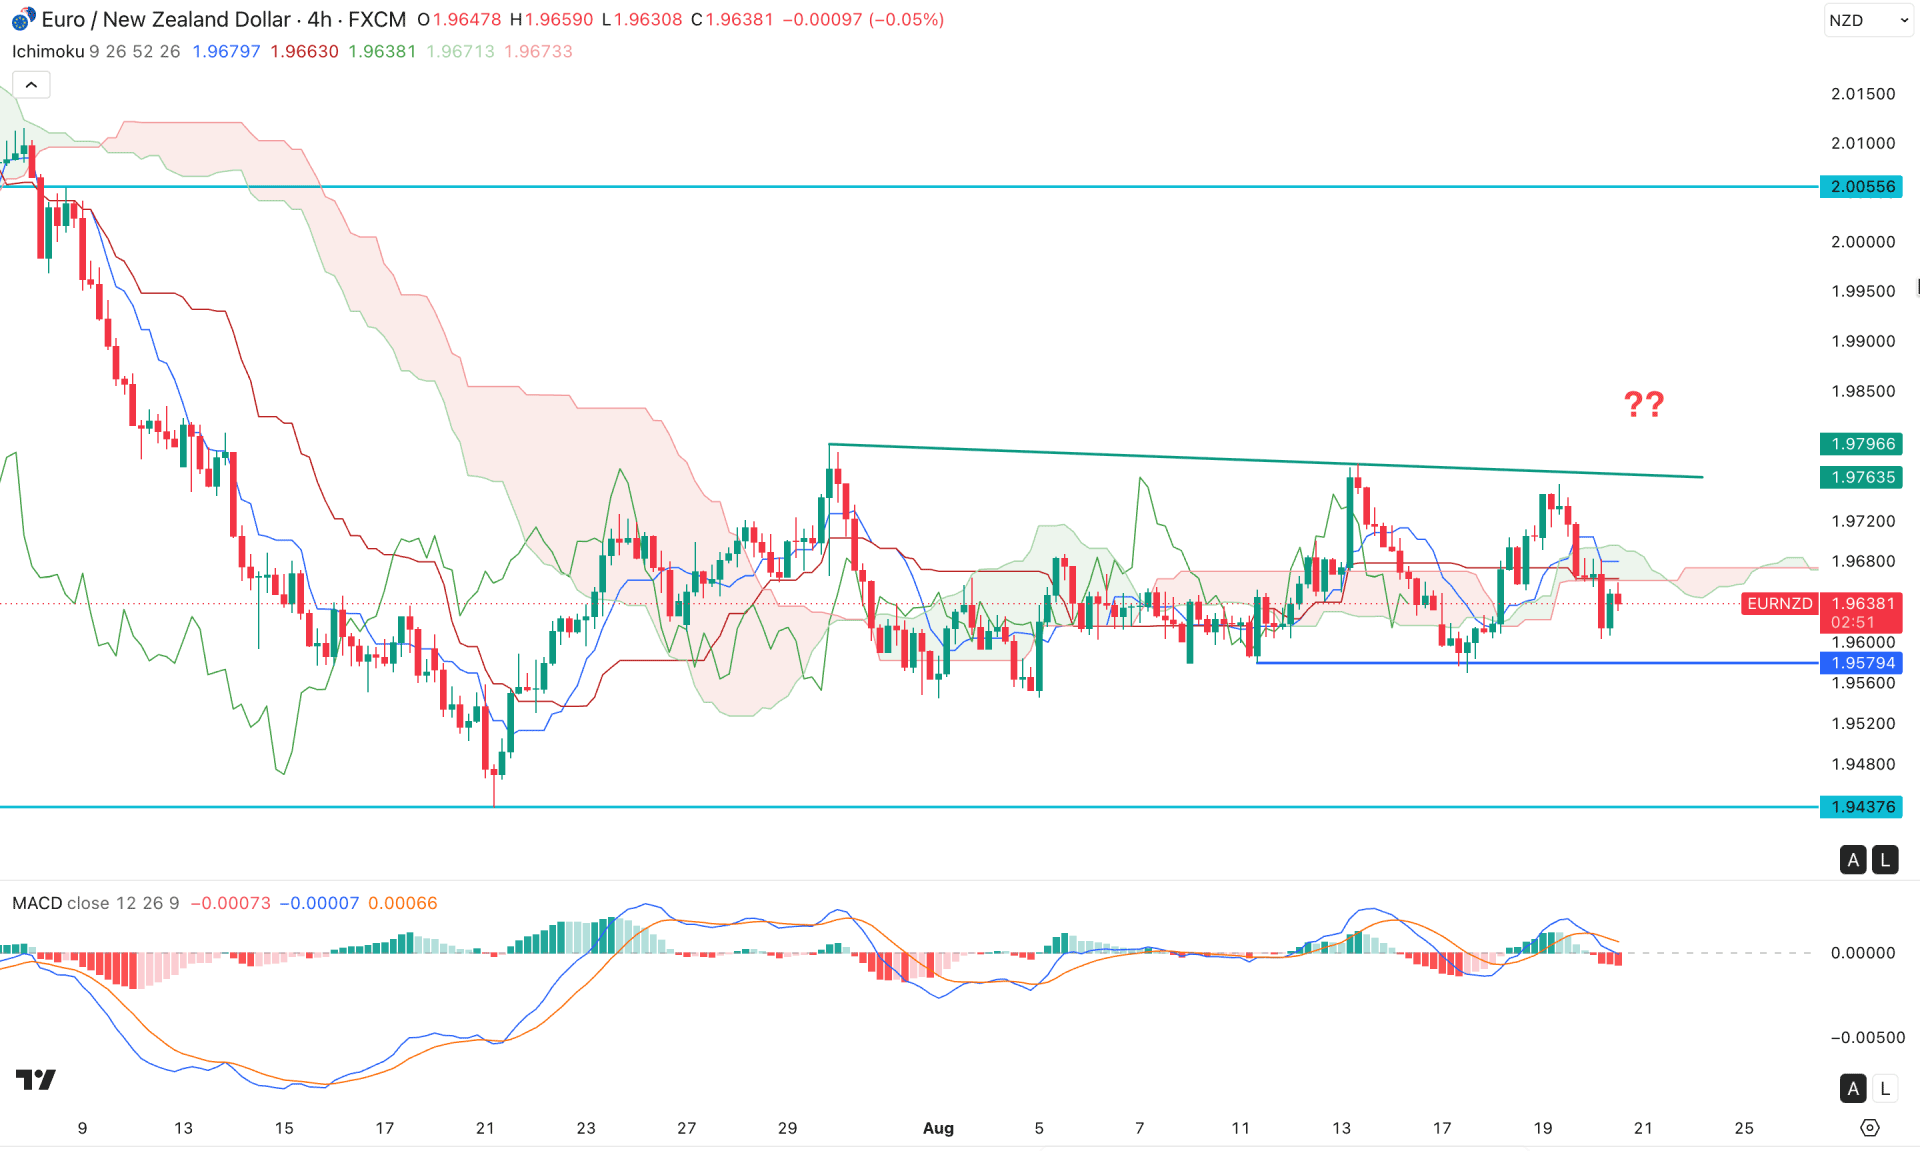
On the four-hour timeframe, EURNZD is moving sideways, with several price reactions around the Ichimoku Cloud. The future cloud is also relatively flat, while repeated cloud flips indicate indecision and the absence of a clear directional trend.
In the secondary indicator window, the MACD histogram has remained below the neutral line for several consecutive sessions, indicating active selling pressure even though the main price chart remains within a range.
Based on this outlook, recent selling pressure below the Ichimoku Cloud, followed by a retest of key resistance, supports a bearish bias. However, downside momentum may remain limited as long as price holds above 1.9579. This level needs to be breached decisively before price can move toward the 1.9437 area.
Alternatively, an immediate bullish recovery and a strong move above the Ichimoku Cloud resistance could shift the short-term outlook. In that case, a new swing high above 1.9757 could open the way toward the psychological 2.0000 level.
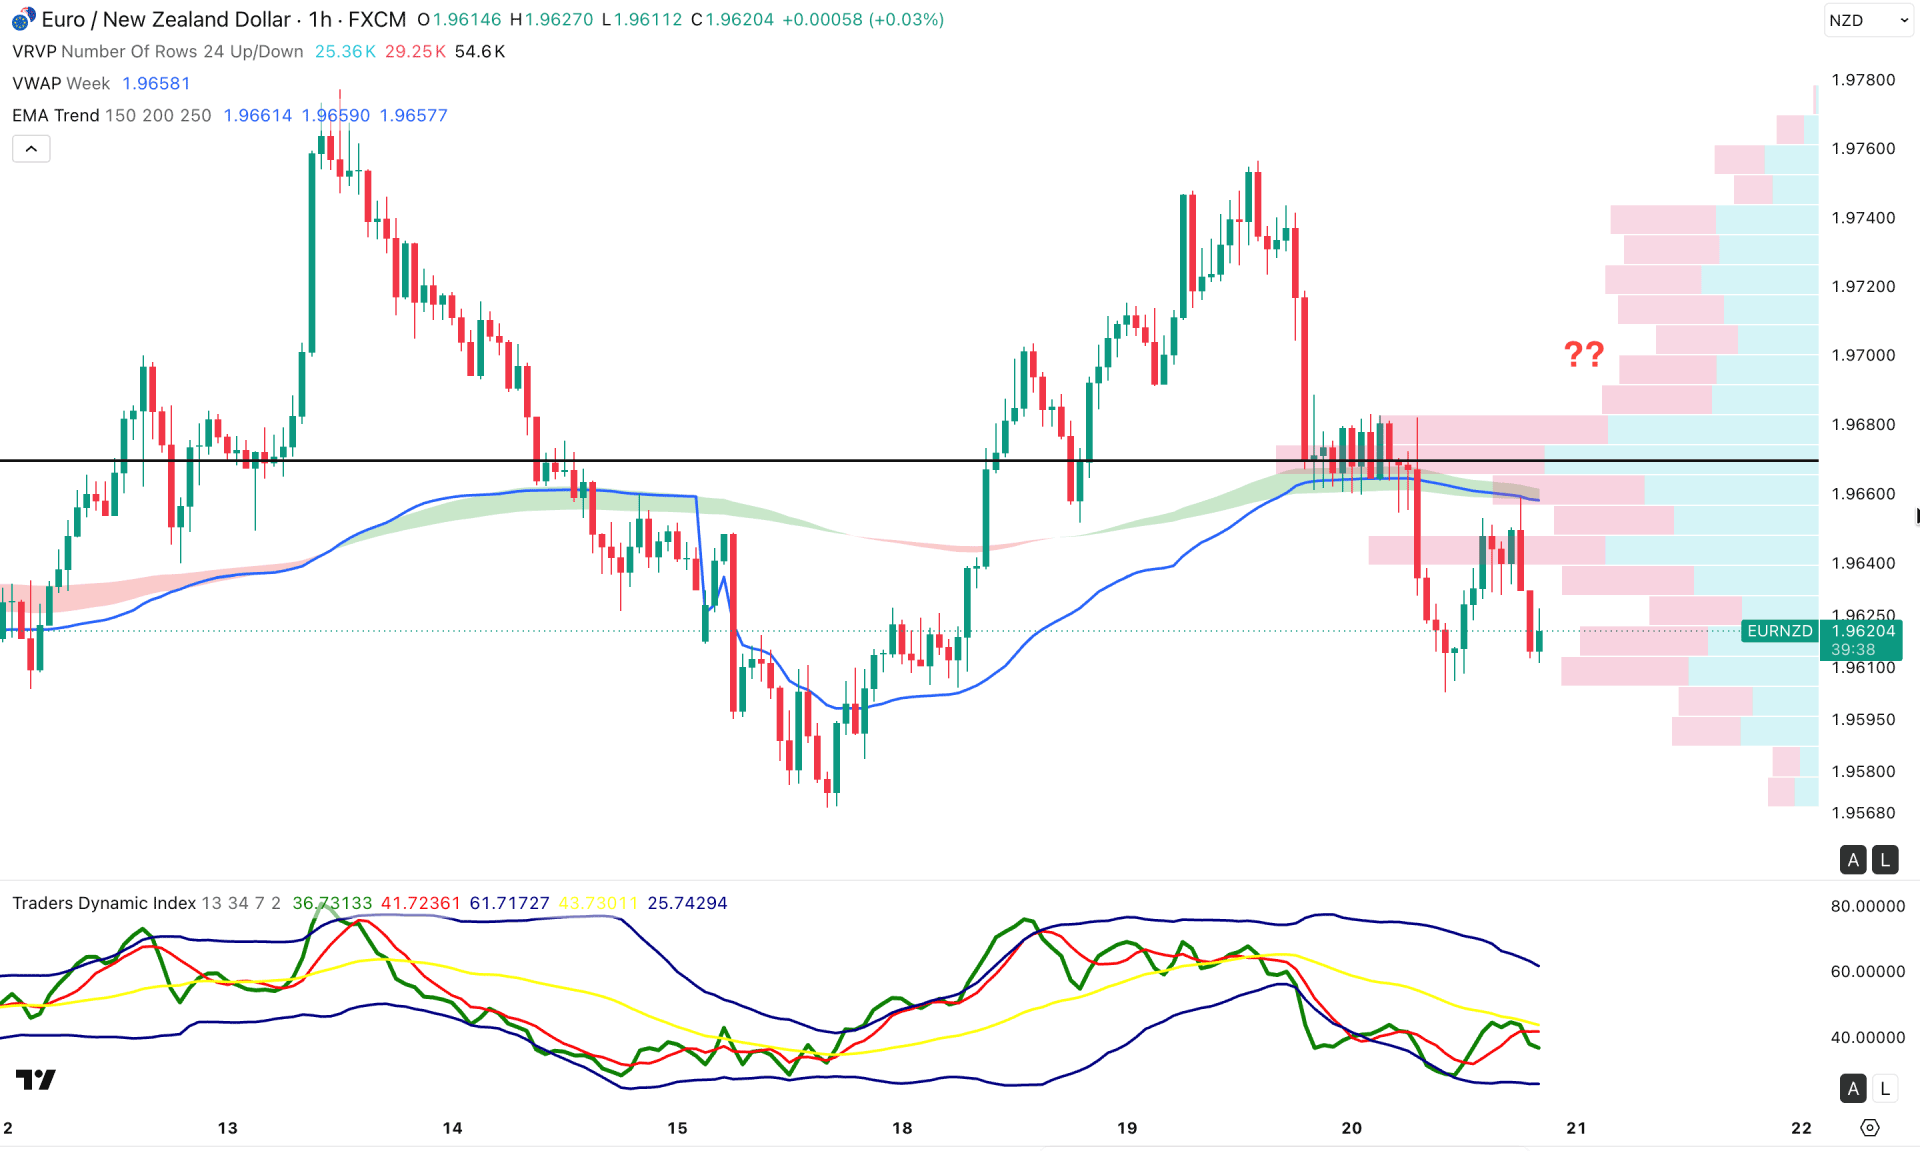
On the hourly timeframe, price is trading below key dynamic resistance levels, which remain above the current price and slope downward. This supports the possibility of continued bearish momentum. The most recent price action is hovering near a bearish trendline resistance, while the weekly VWAP and the high-volume level around 1.9669 are acting as immediate resistance zones.
In the indicator window, the Traders Dynamic Index remains below the 50.00 neutral level, indicating sustained bearish pressure. Selling momentum is likely to remain active as long as the bearish structure is maintained.
Based on the hourly outlook, the weekly VWAP is the main resistance level to monitor. Price needs to break above this level to weaken the current selling pressure. A bullish breakout and hourly candle close above 1.9669 could increase the probability of a move toward the 1.9756 high.
Conversely, as long as price remains below the weekly VWAP, bearish continuation remains possible. The immediate support is located around 1.9569. A decisive break below this level could open the way for a retest of the 1.9438 low.
Overall, EURNZD remains in a sideways structure, while the recent bullish rebound has shown relatively weak momentum compared with the existing selling pressure. Since price is consolidating inside a symmetrical triangle, a confirmed break below the triangle support could validate a bearish continuation setup. However, traders should wait for a clear breakout and confirmation before entering a position.


