
Published: September 25th, 2025
The EURJPY price went sideways after the announcement of the dismal top German IFO Business Environment Index, which surprisingly dropped from 89.0 in August to 87.7.
In the meantime, the present Economic Assessment Index missed the predicted 86.5 reading and fell to 85.7 from 86.4 for the same time period. After reading 91.6 and 92.0 in September, the IFO Predictions Index, which shows businesses' expectations for the upcoming six months, fell to 89.7.
Amid growing concerns about the economic crisis in France, the second-biggest economy in the Eurozone, the Euro confronts challenges from its peers. According to Tuesday's docket, the HCOB Fast France Composite buying Managers' Index (PMI) experienced its worst drop in five months, falling from 49.8 in August to 48.4 in September. This number was lower than the anticipated 49.9. In the meantime, September saw a significant drop in both the service and manufacturing industries.
But when the Japanese yen weakens in the wake of Wednesday's release of Japan's PMI data, the EURJPY cross's decline may be limited. Businesses remained cautious about the prospects in the face of changing international trade regulations and domestic instability.
In order to obtain new momentum on the policy route, traders are expected to watch the Tokyo Consumer Price Index (CPI) data on Friday.
Let's see the future price direction of this pair from the EURJPY technical analysis:
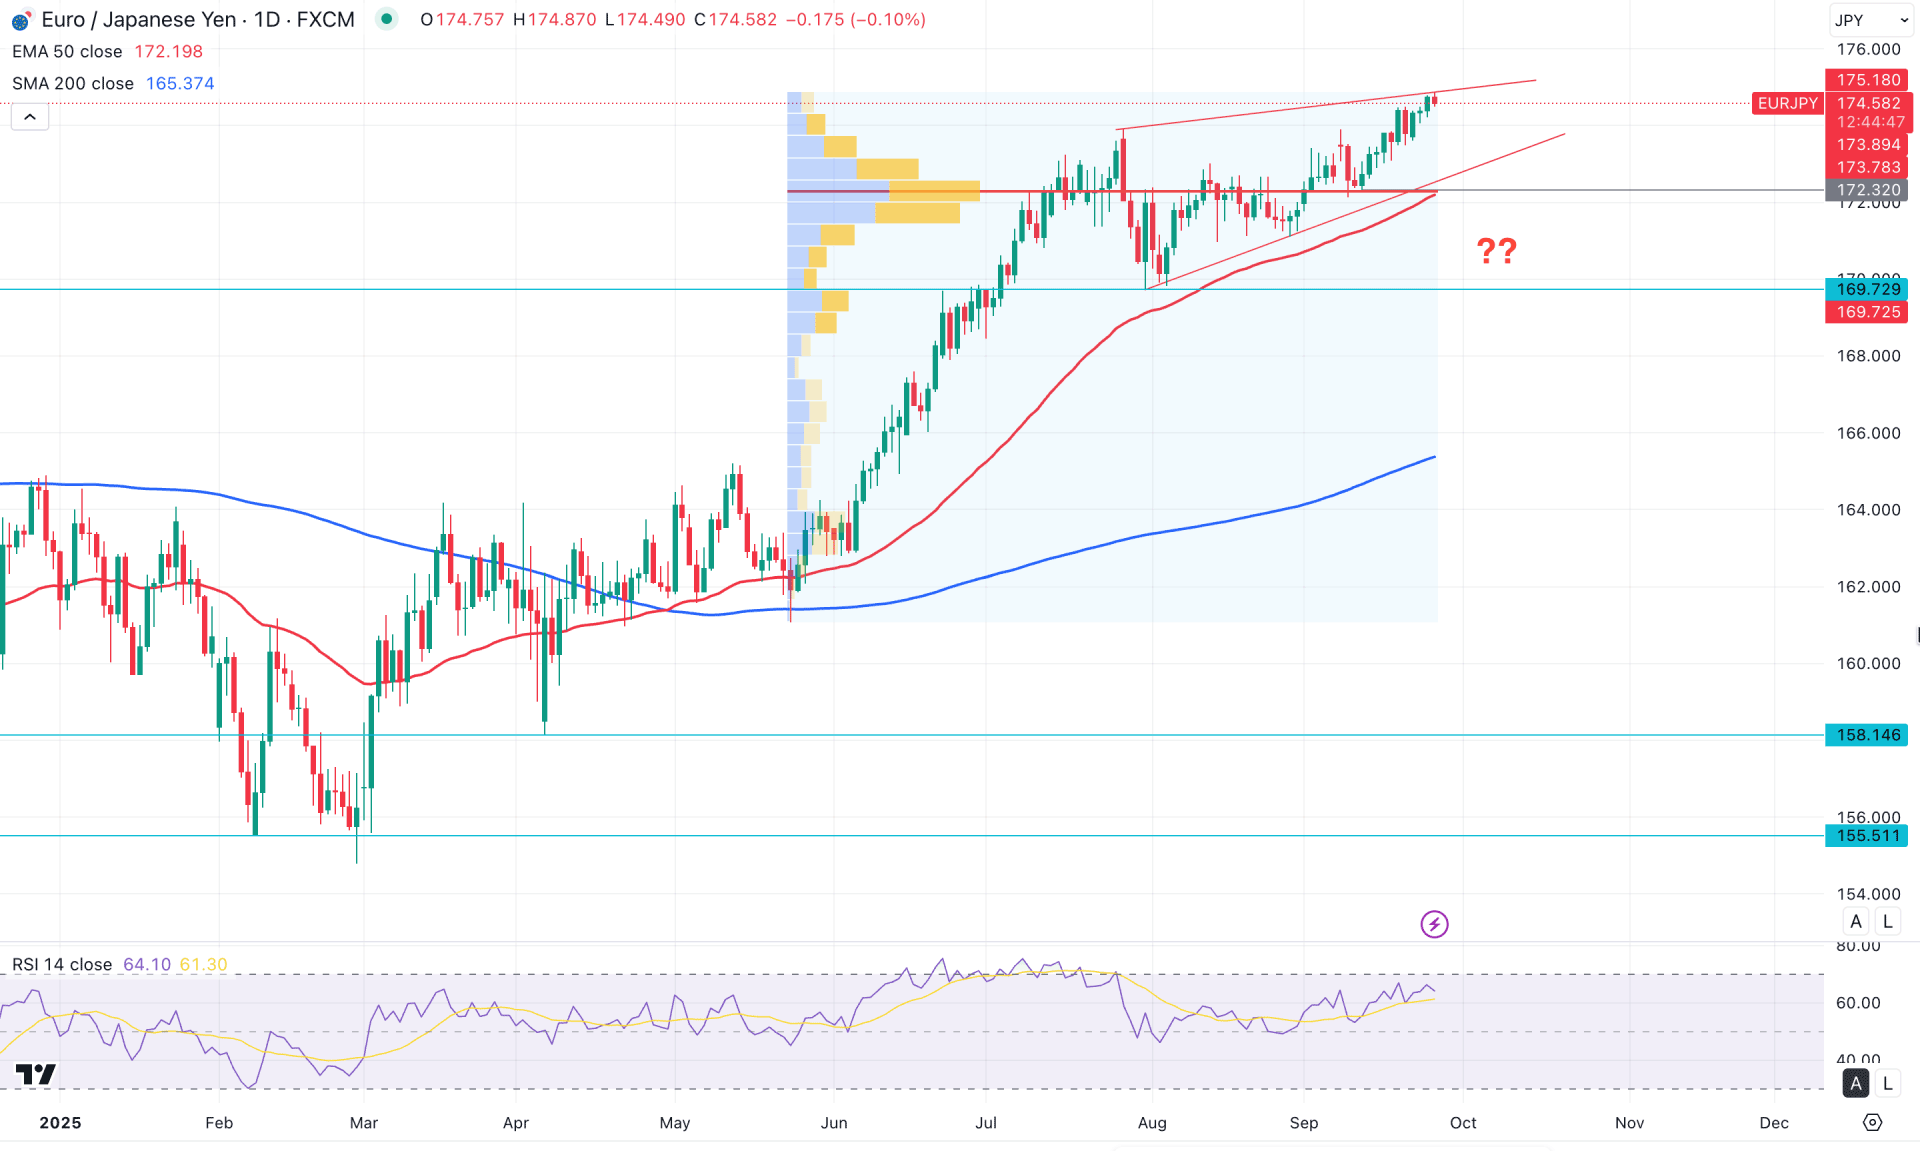
On the daily chart of EURJPY, a prolonged bullish trend continuation is visible, as no significant bearish attempt has been seen since August 2025. Currently, the price is trading within a rising wedge pattern, suggesting that a proper bearish structure needs to form before considering short positions.
In the higher timeframes, the long-term momentum remains bullish, with the current price trading higher following an inside bar breakout. Although the price has reached the July 2024 high, the buying pressure may continue until clear bearish momentum appears at the top.
From the volume's perspective, buying pressure remains valid. The largest activity level appears to be June 2024, which is now below the current price. This suggests a bullish continuation is likely as long as the price remains above the key resistance-turned-support level, despite a potential downside correction being on the horizon.
On the daily chart, the 200-day Simple Moving Average is well below the current price, indicating strong bullish extension potential. Moreover, the 50-day Exponential Moving Average is aligned closely with current price action and is acting as immediate support. Even if the price pulls back towards the 50 EMA, the overall bias remains bullish, though a corrective move may occur.
The Relative Strength Index (RSI) shows corrected buying pressure, with the current RSI line moving just below the 70.00 overbought threshold. A minor bearish divergence between the RSI and the price swing is visible, indicating a short-term opportunity for a pullback.
Based on the overall market outlook, the major trend in EURJPY remains bullish, as dynamic support levels are still holding below the price, maintaining a bullish slope. Although the price is facing resistance within the rising wedge, a potential breakout is pending. A minor target would be to test the 173.78 level, which serves as the wedge support.
However, an extended bearish pressure below the 172.32 level could confirm a wedge breakdown, with the primary bearish target set at 169.70. Further consolidation below the 50-day EMA, followed by a range breakout, could open the door for short opportunities, targeting the 165.67 support level.
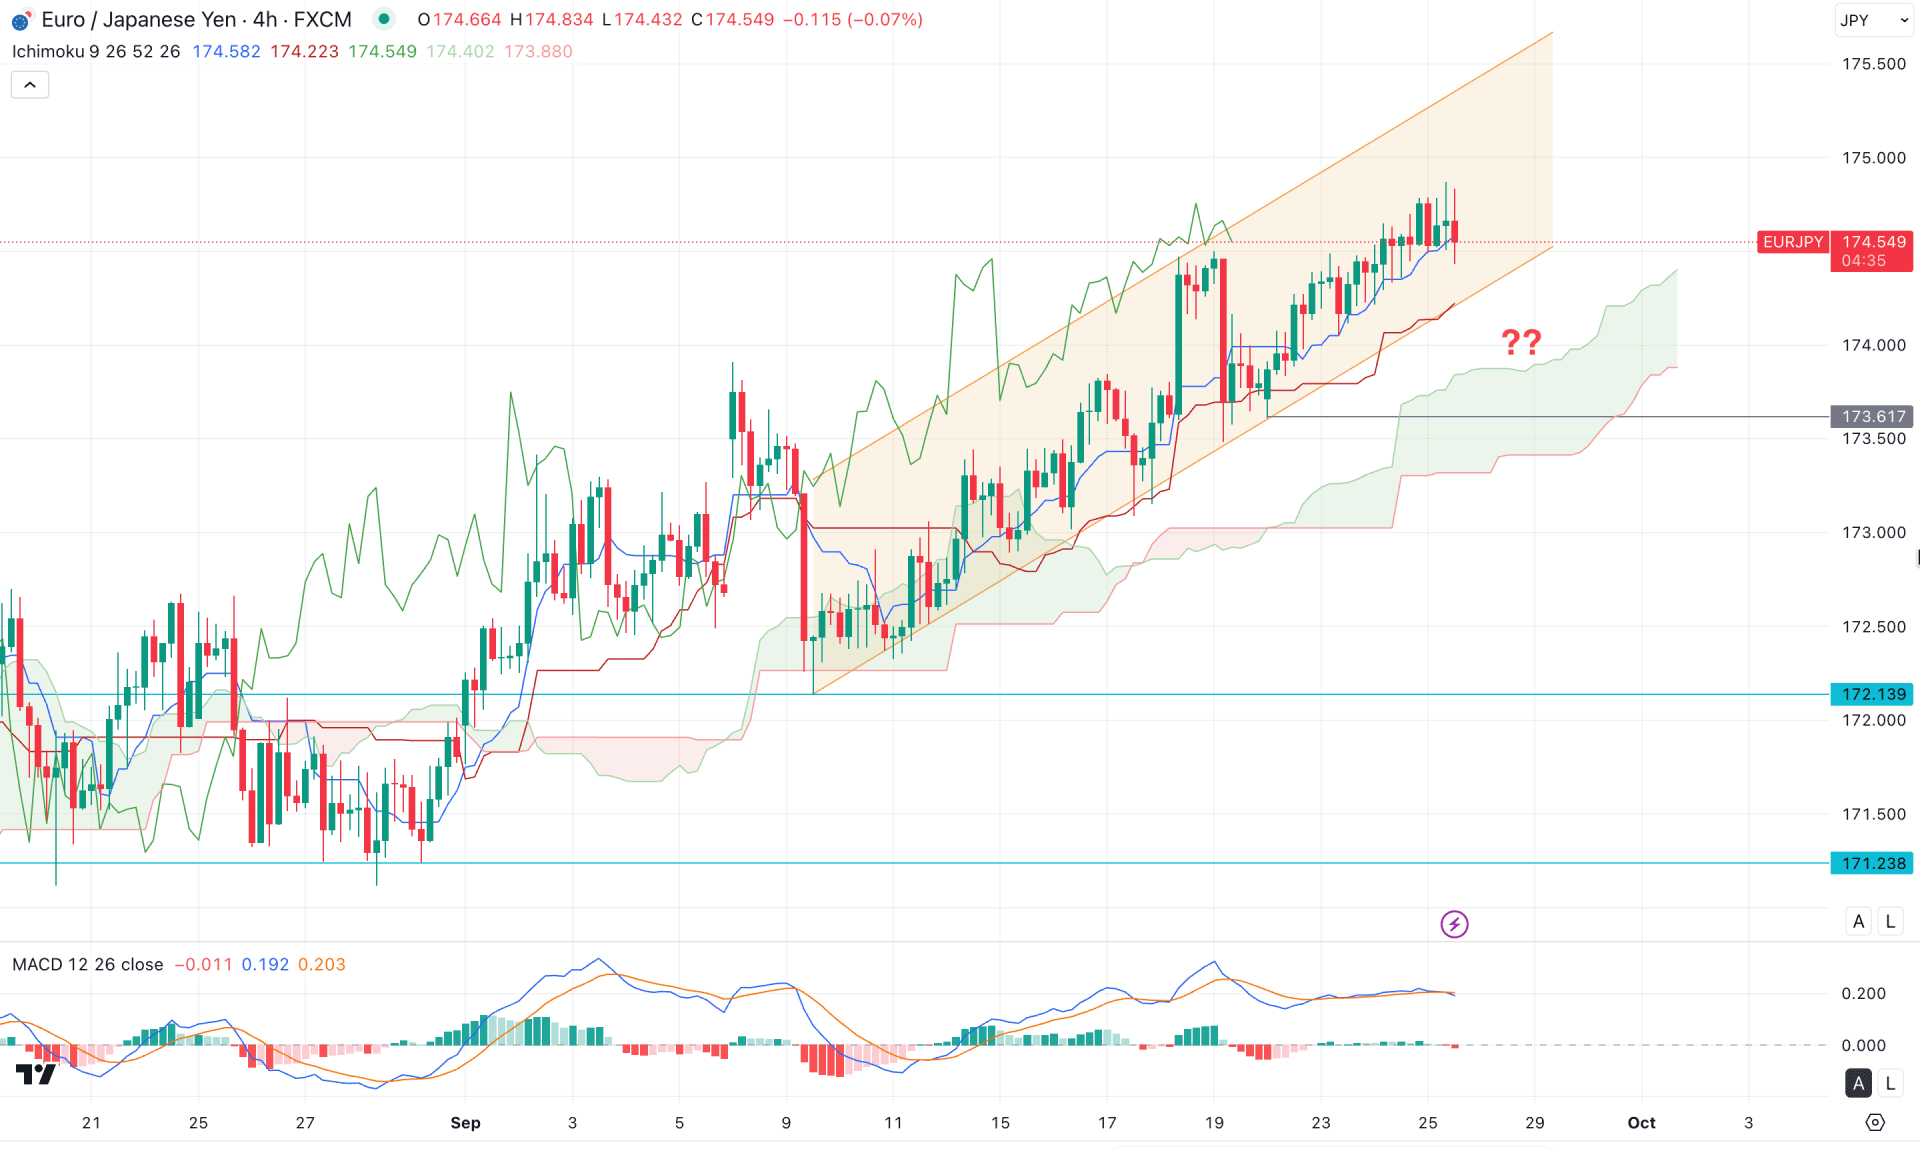
On the four-hour timeframe, the ongoing market momentum is bullish, as multiple higher highs are visible above the Kumo cloud area. Moreover, both Senkou lines are aiming higher, suggesting a possible bullish continuation in the upcoming trading sessions.
In the secondary indicator window, corrective market pressure is evident, as no significant changes are observed in the MACD histogram or signal lines.
Based on this outlook, investors should closely monitor how the price behaves at the channel support, where the dynamic support level could act as a crucial barrier for sellers. A bullish rebound from the 174.00 to 173.50 area could present a potential buying opportunity, targeting the 175.00 level.
On the other hand, an extended bearish pressure below the Kumo cloud's lower boundary could validate a breakout from the ascending channel. In that case, a corrective move toward the cloud area, followed by consolidation below the 173.61 level, would be needed before aiming for the 171.23 support level.
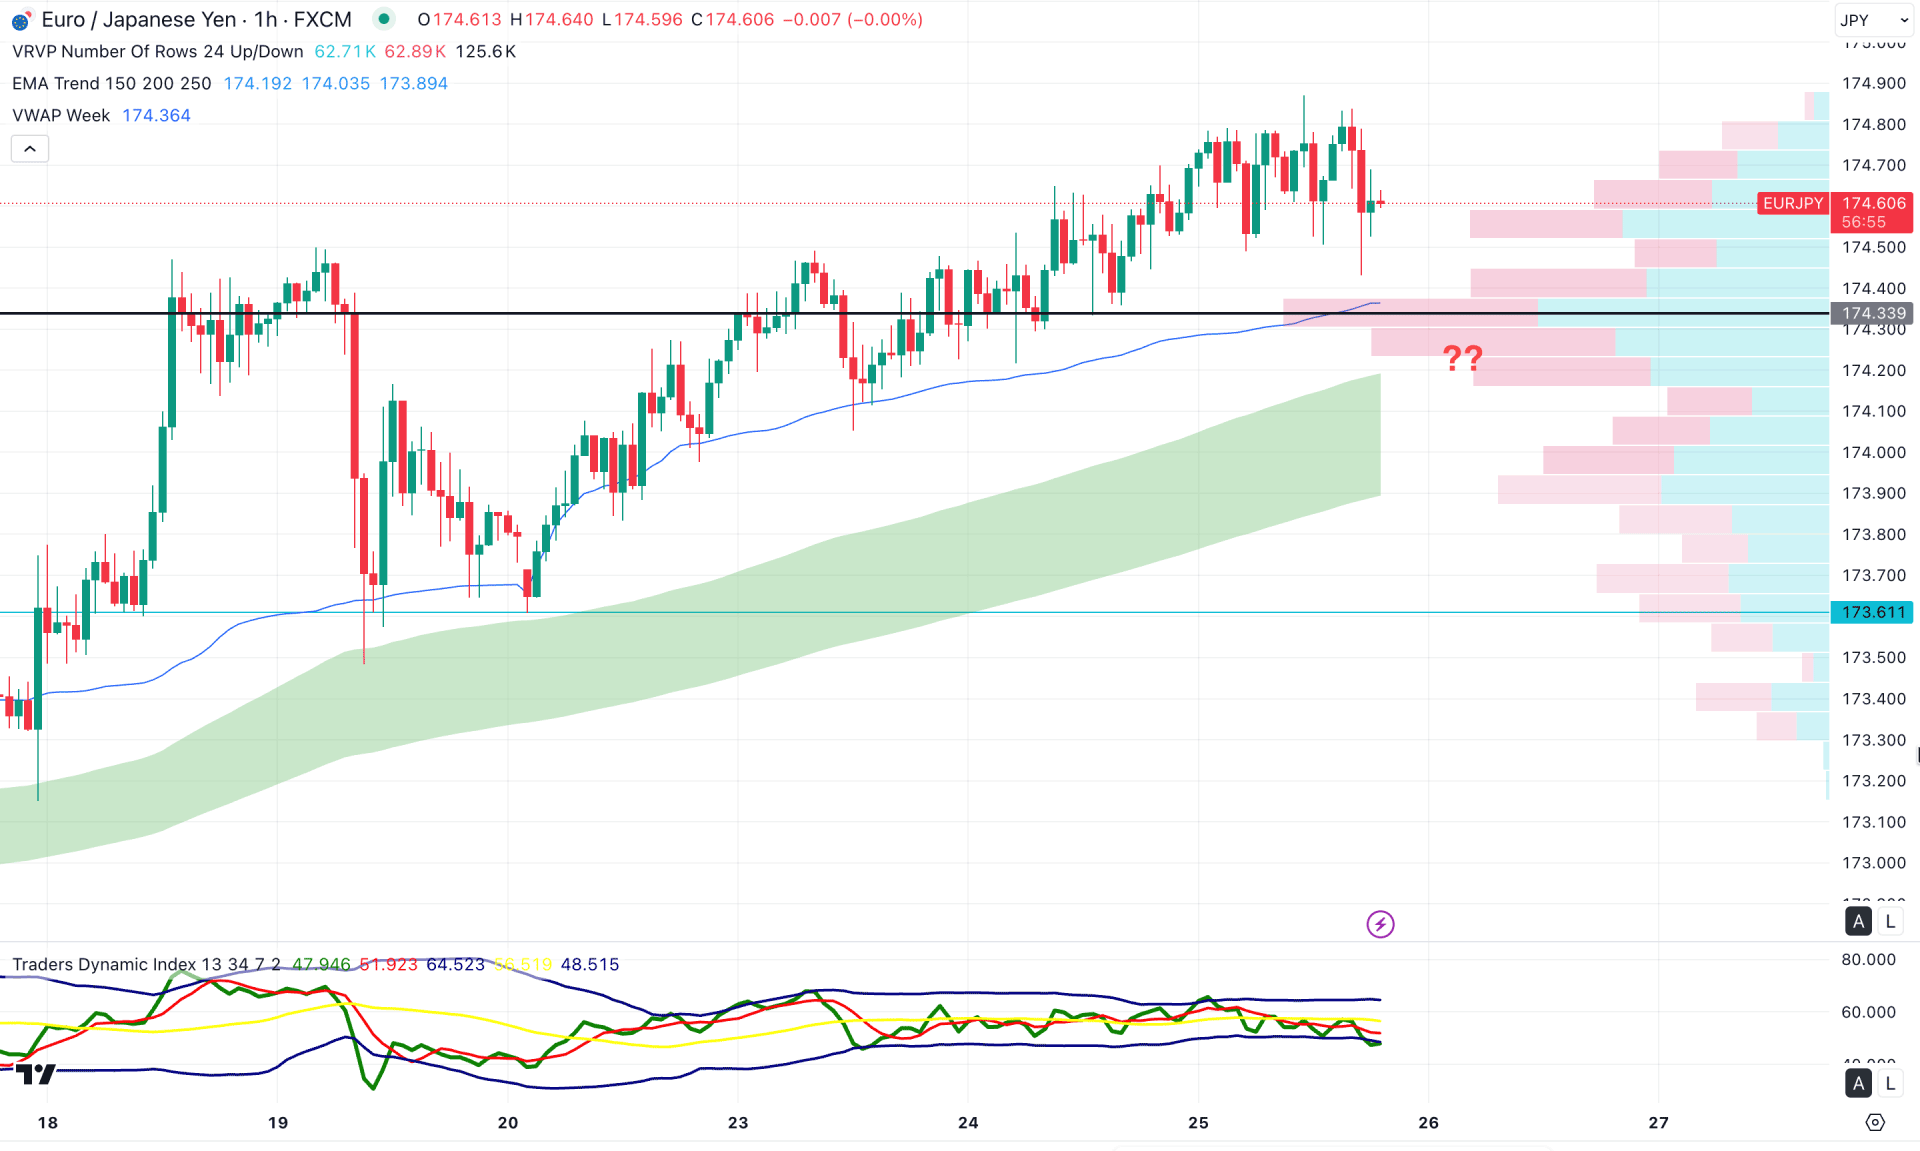
In the lower timeframes, the most recent price is trading above the Visible Range High Volume line, which lies below the current price. As the rising weekly VWAP supports the price, the primary anticipation is to look for long trades only.
In the secondary indicator window, the Traders Dynamic Index (TDI) has exited the overbought zone and is now approaching the equilibrium level, indicating selling pressure in the market.
Based on this outlook, the bullish instability near the top suggests that bulls are struggling to maintain momentum. Therefore, more confirmation is needed before anticipating a new move. Ideally, any bullish rebound from the 174.33 High Volume Line could resume the existing bullish trend towards the 175.00 target.
On the other hand, buying pressure is supported by a stable EMA wave, which could act as a strong dynamic support for buyers. However, a break below the 174.33 level, followed by consolidation, could extend the loss towards 173.61, and potentially even 173.10.
Based on the broader market structure, EURJPY is currently trading in a premium zone, and so far, no significant bearish pressure is visible. In this context, the primary anticipation remains a trend continuation above the July 2024 high.
However, a minor downside correction is still possible, though the structure remains bullish unless any clear exhaustion appears.


