
Published: February 2nd, 2023
It is widely expected that the European Central Bank (ECB) will increase its policy rate by 50 basis points, but this decision is already factored in and is unlikely to cause much reaction. Some ECB officials have called for an additional 50 basis point hike at the next meeting, which could cause the Euro to strengthen if the policy statement or ECB President Christine Lagarde confirms such a move.
The EUR/JPY exchange rate may remain bullish if the ECB's tone regarding the inflation outlook is not overly optimistic. Although the market anticipates a potential rate cut later in the year, Lagarde's comments could dispel such speculation and drive further Euro appreciation.
On the other hand, if Lagarde acknowledges slowing price growth in the Eurozone and leaves room for a smaller rate hike in the future, depending on economic conditions, the Euro may lose its appeal.
Can EUR/JPY form a bullish breakout from the hawkish ECB? Let’s see the complete price projection from the EURJPY technical analysis:
In the higher timeframe price action, EURJPY is trading within a bullish trend initiated from the 2020 bottom. Therefore, long-term investors are focusing on long trades only, as shown in the weekly and monthly charts.
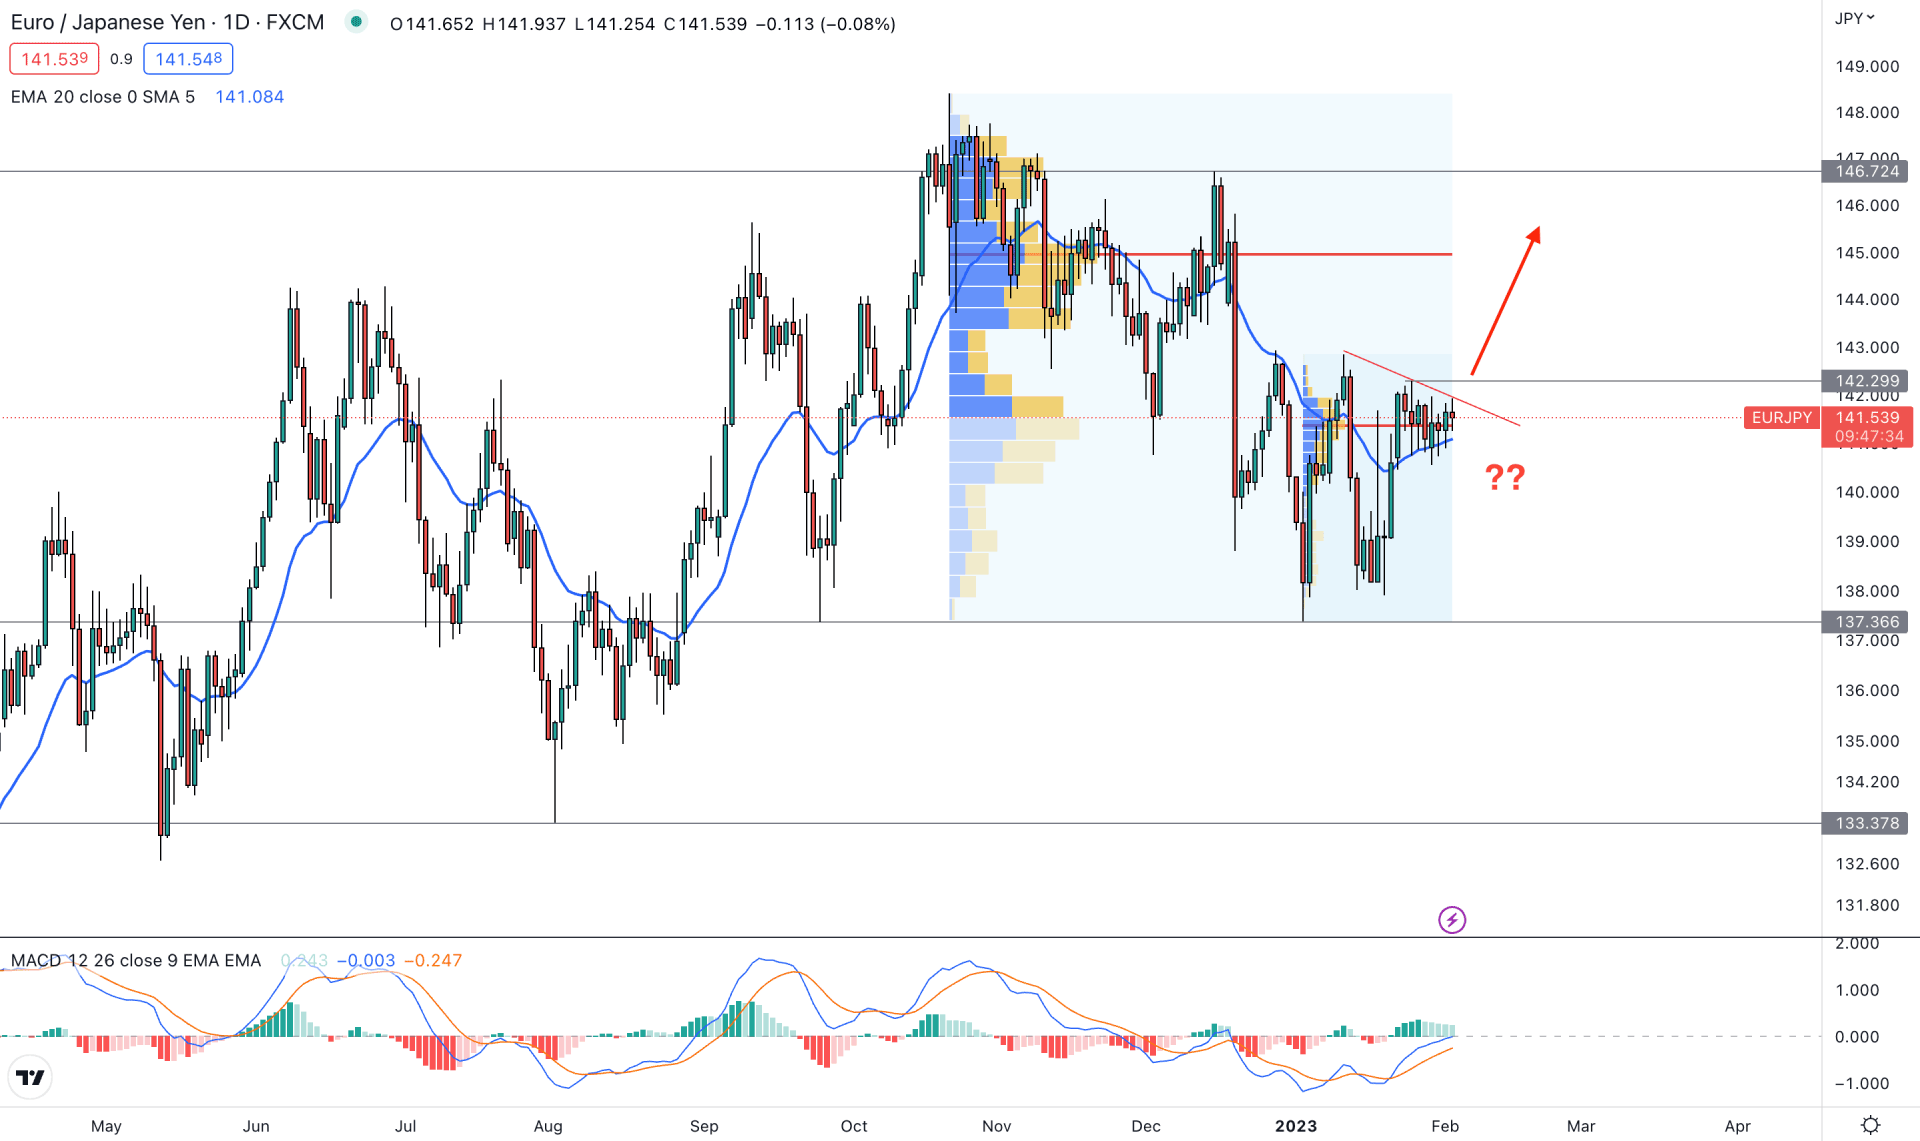
In the daily price action, this situation is almost the same. Although there is corrective downside pressure from the 148.37 swing high, which ended at the 137.34 area with a 7.46% loss. However, the most recent price action shows an extreme correction after a bullish recovery, which is signaling a pre-breakout possibility.
If we identify the tradable range, we can see an upside pressure from the 137.36 level, which will be a solid bottom. On the upside, a buy-side liquidity grab and extreme selling pressure are visible from the 146.72 resistance level.
If we draw a Fibonacci level, we can see the 50% level of this zone is at 141.96 level, which is just above the current price. In that case, any buying opportunity from the discounted zone could offer a profitable long trading chance.
In the recent price, there is a trend line, below the 42.29 immediate resistance level. The price is carried by the dynamic 20-day Exponential Moving Average, while the MACD EMA’s are showing a bullish crossover. Moreover, the MACD histogram is above the 0.0 neutral line and holding a strong bullish momentum.
Based on the daily price prediction at the trendline breakout and a daily candle close above the 142.29 resistance level could indicate a valid breakout, targeting the 146.74 resistance level.
On the other hand, the price action with a stable bearish candle below 20 EMA could extend the volatility and lower the price to the 138.15 support level.
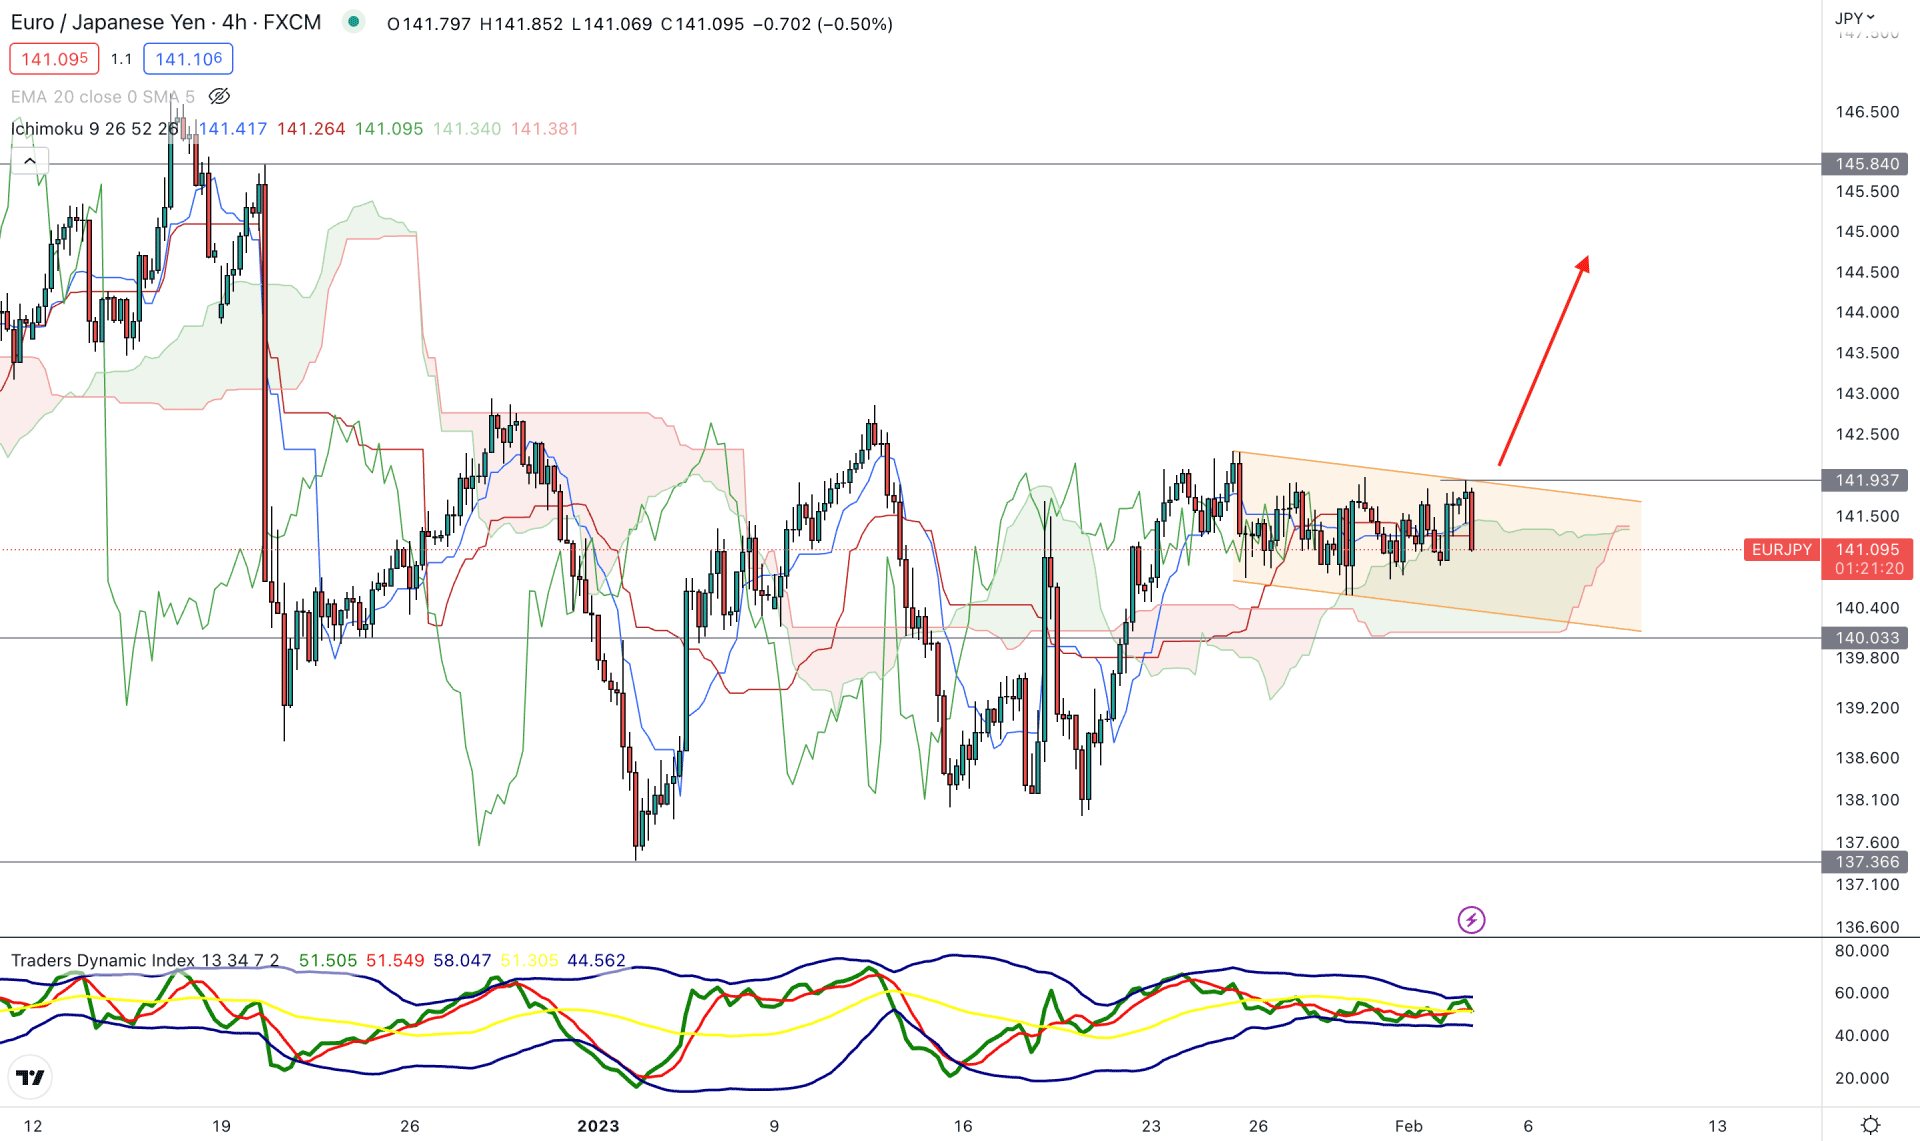
In the H4 timeframe, the bullish possibility is still potent, as the current price is holding the bullish momentum about the cloud area since 23 January 2023.
Although the recent price was very corrective above the cloud support, there is no sign of a significant selling pressure. In that case, further bullish momentum with the breakout from the descending channel could offer a decent buying opportunity.
In the future cloud, Senkou Span A and B are closer together, while the current price is trading at the cloud support.
The corrective momentum is also visible from the indicator window, where the Traders Dynamic Index is squeezing.
Based on this outlook, investors should wait for a bullish recovery and a stable price of a dynamic Kijun Sen. An H4 candle above the 141.93 level would be a conservative buying approach targeting the 145.84 resistance level.
The alternative approach is to wait for the price to come below the 140.03 low, which can lower the price towards the 138.00 area.
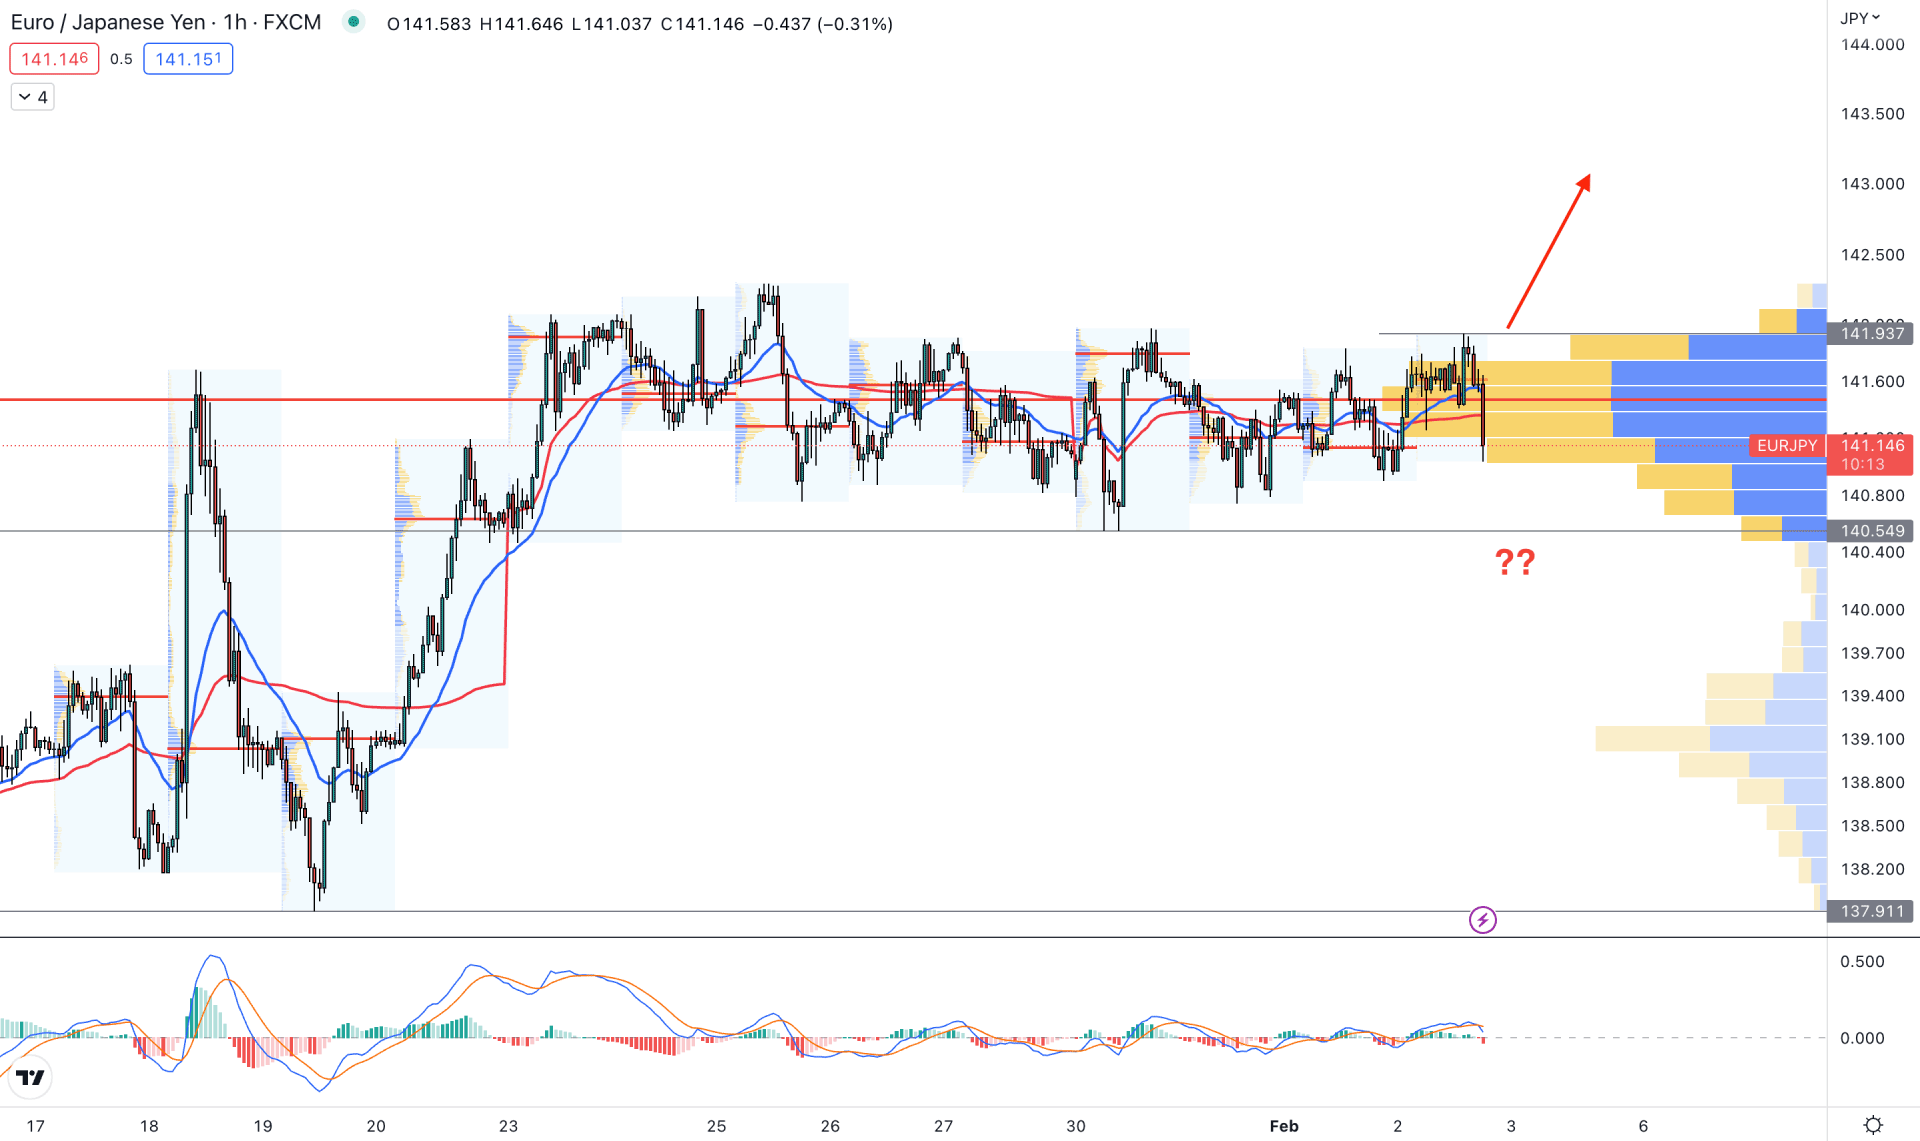
A critical situation is seen in the hourly chart, as the current price is trading within an extreme correction.
The visible range high volume level is above the price at 141.46 level, where the significant support level is at 140.54 level. In the indicator window, the MACD histogram shows the downside pressure by moving below the neutral level, while the price is struggling to hold the momentum above the 20 EMA.
Based on the hourly price action, a strong bullish breakout and stable price of the 141.93 level is needed to open a long position targeting the 144.00 level.
On the other hand, any downside pressure below the 140.54 level could lower the price and initiate a consolidation.
Based on the current multi-timeframe analysis, EURJPY has a higher possibility of showing a bullish breakout in the coming days. As the current price is already in a bullish pre breakout structure, investors should closely monitor how the price trades at the 142.29 level.


