
Published: June 7th, 2023
After the third consecutive bearish day, the EURJPY exchange rate recovered slightly in the European session and closed above the 149.00 level.
The decline was driven by concerns about a global economic slowdown. Weak Chinese trade data added to these concerns, showing that exports fell unexpectedly in May. This suggests that demand for Chinese goods remains weak, which could hurt the world's second-largest economy.
The prospect of Japanese authorities intervening in the markets to support the yen also weighed on the EURJPY exchange rate. The shared currency was also pressured by disappointing economic data from Germany and France.
However, the divergent monetary policy stances of the Bank of Japan (BoJ) and the European Central Bank (ECB) limited the downside for the EURJPY exchange rate. The BoJ has pledged to keep interest rates low, while the ECB has signaled that it will raise rates in July. This difference in monetary policy could support the euro in the coming months.
Overall, the EURJPY exchange rate will likely remain volatile in the near term as the market continues to weigh the risks of a global economic slowdown against the divergent monetary policy stances of the BoJ and the ECB.
Let’s see the upcoming price direction of this instrument from the EURJPY technical analysis:
In the higher timeframe price action, EURJPY is trading within a strong buying pressure as the latest monthly candle has appeared with an inside bar formation within a strong mother bar.
The weekly timeframe shows a corrective structure as the last two candles are bearish, inside a strong bullish mother bar. In this situation, bulls are more likely to win, but higher volatility may appear from the fundamental perspective.
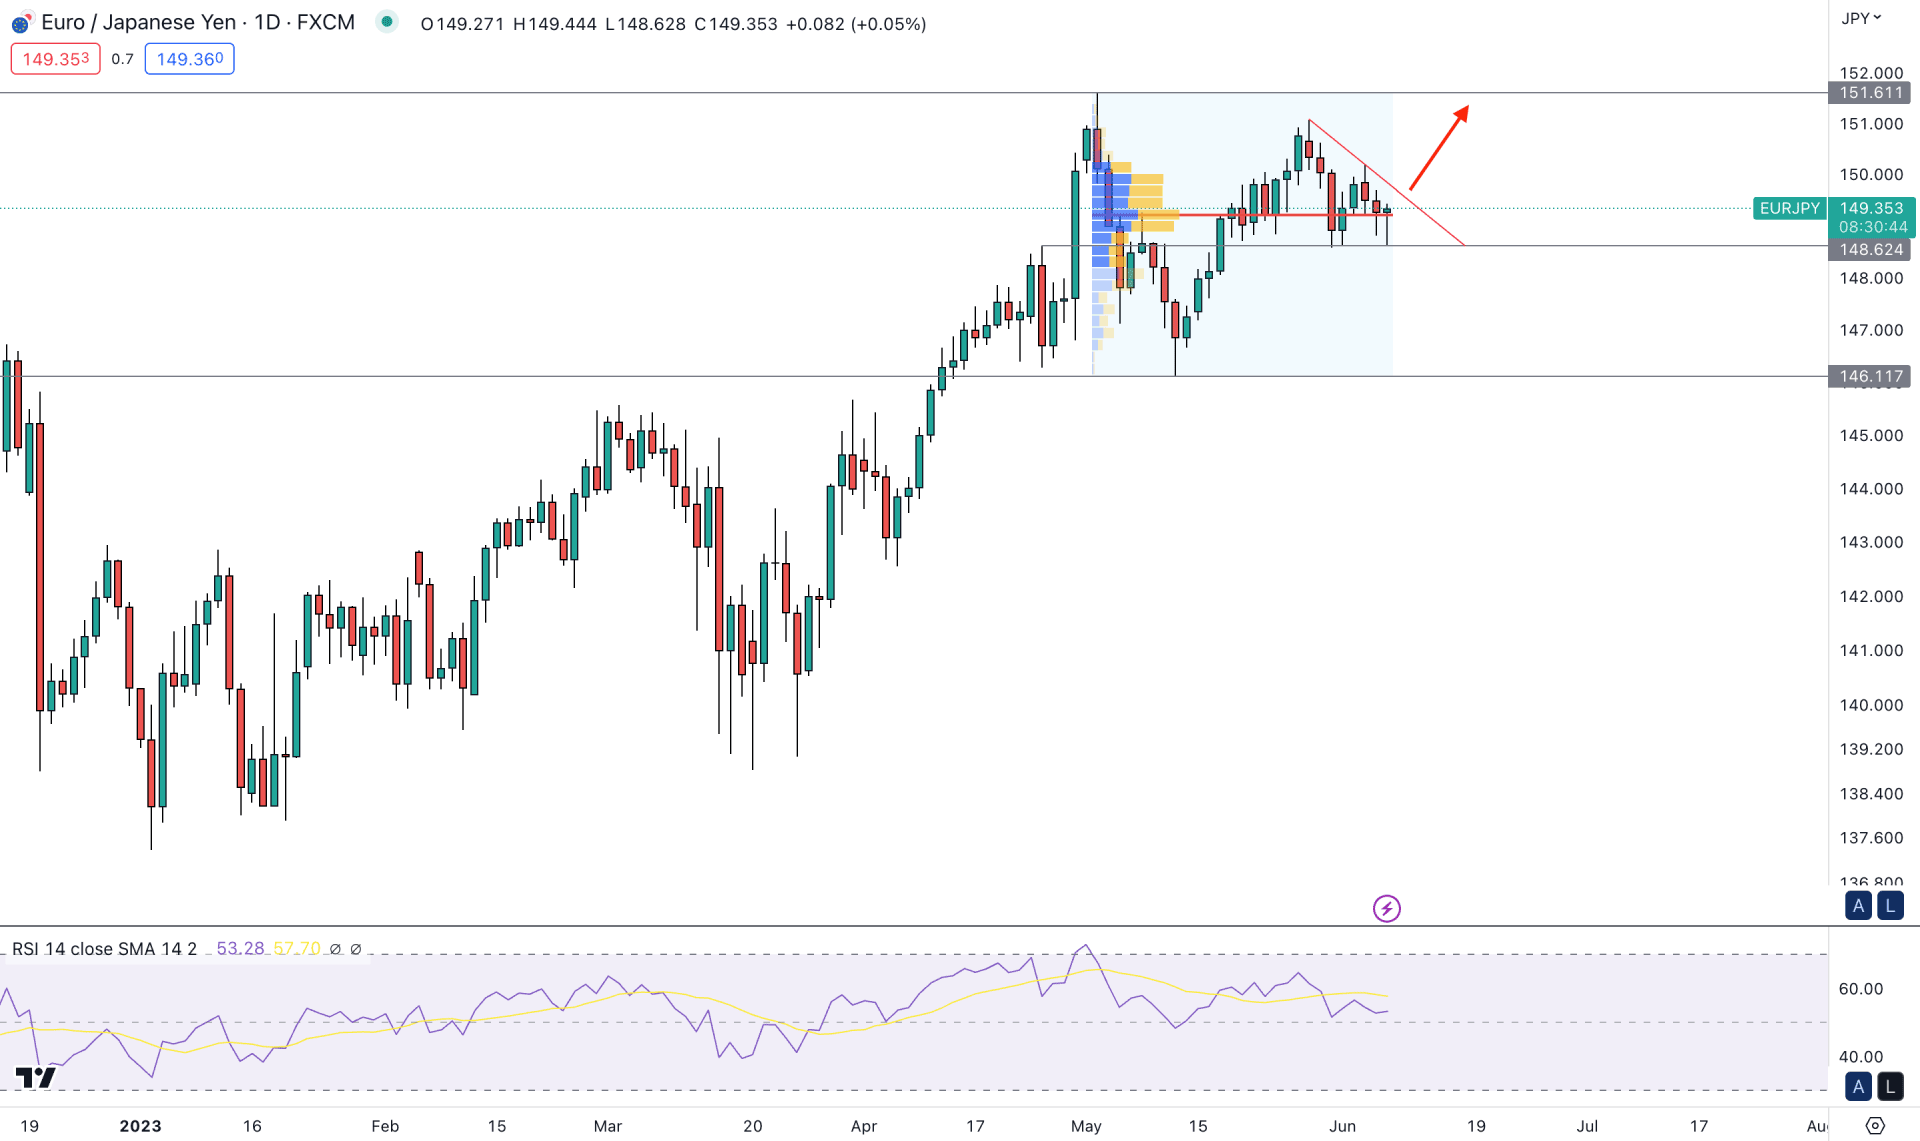
In the daily chart, the broader market direction is bullish, where the current tradable range starts from 146.11 low to 151.61 high. The current price is trading above this zone's 50% Fibonacci Retracement with no sign of selling pressure. On the other hand, the latest price action shows a corrective structure with an internal liquidity structure, where bulls have a higher possibility of winning.
The main price chart shows an upward momentum from the 100-day SMA and 20-day EMA levels. It is a sign that this instrument's short-term and long-term outlook is bullish. Also, the upward momentum is supported by the Relative Strength Index (RSI), where the 14-day RSI is at the 53.60 level.
Based on the above characteristics, we may conclude that the long-term market trend for EURJPY is bullish, where a trendline breakout with a bullish D1 candle could offer a trend trading opportunity. However, the early pre-breakout scenario needs additional confirmation from the intraday chart. In both cases, the primary target level would be the 151.61 level.
In the alternative scenario, any false break from the trendline resistance could provide an early selling sign where a bearish D1 candle below the 148.50 level could lower the price toward the 146.00 area.
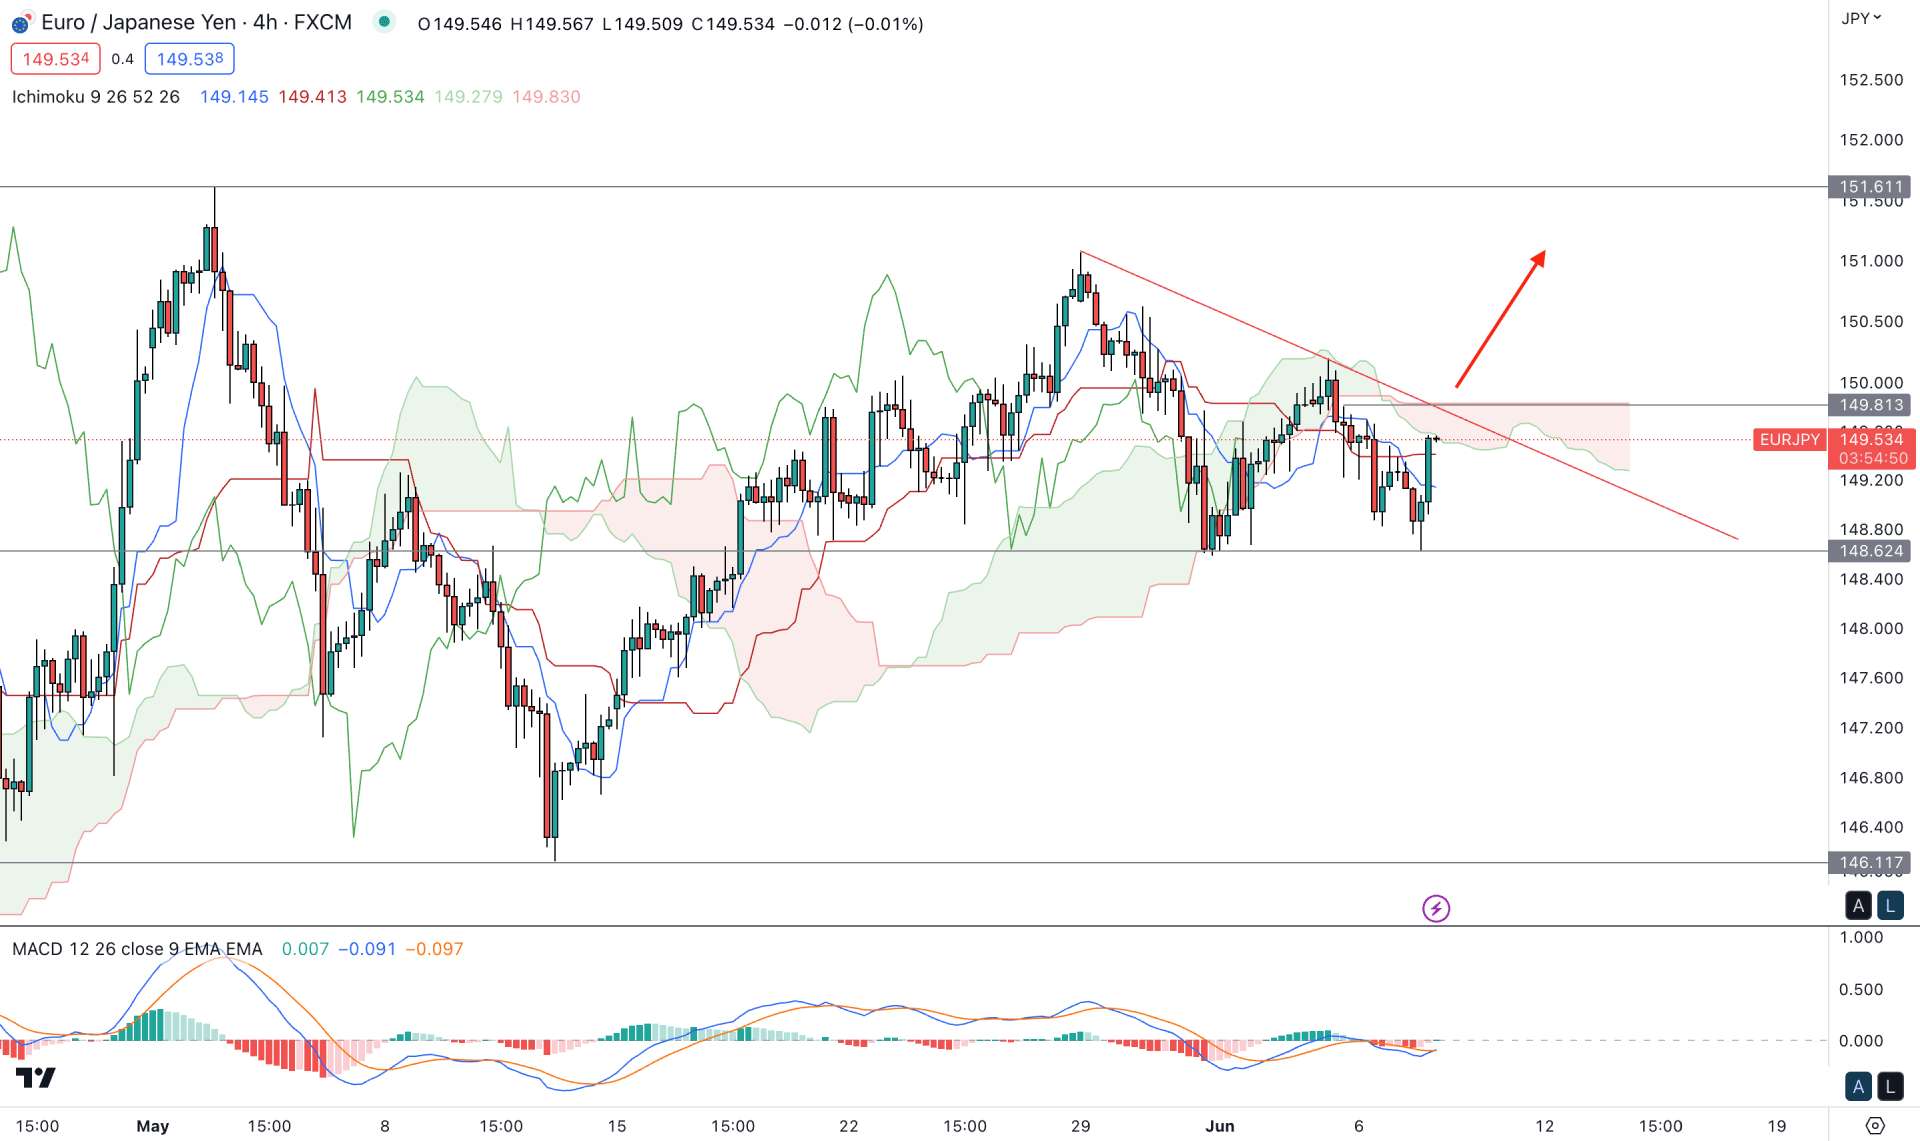
In the H4 timeframe, the current price is trading below the Ichimoku Kumo Cloud, while the broader sentiment is corrective. Although a bullish H4 candle appears above the Kijun Sen dynamic level, it's not enough to consider it a buy signal.
An early buying opportunity is visible in the indicator window, where the current Histogram is near the neutral line. Moreover, a bullish crossover is seen in MACD EMA’s.
Based on the H4 chart, a valid trendline breakout with an H4 close above the 149.89 static resistance could increase the price possibility of testing the 151.61 resistance level for this instrument.
The alternative trading approach is to look for short opportunities after a valid lower low formation below the 148.50 level.
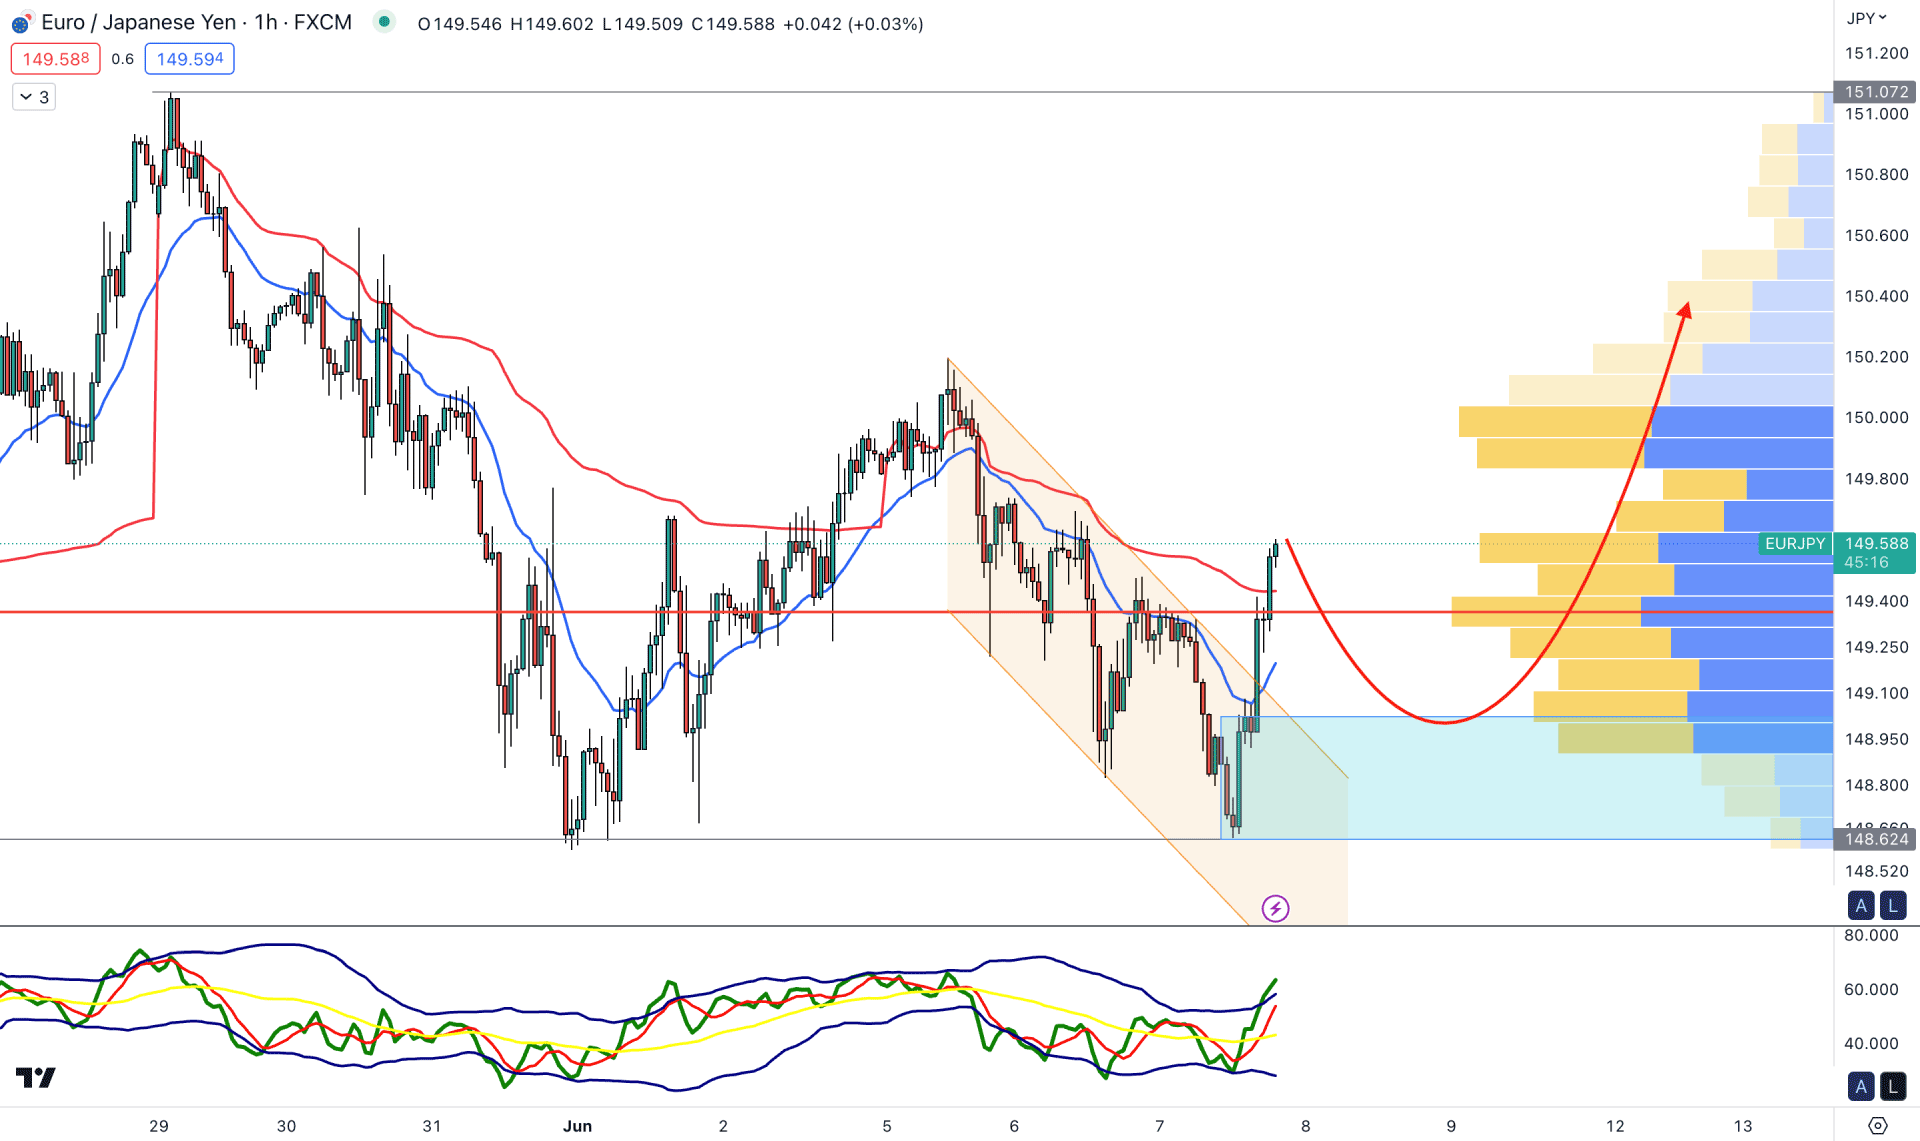
In the hourly timeframe, a valid channel breakout with an impulsive momentum is visible, while the visible range high volume level is below the current price.
An hourly candle came above dynamic 20 EMA and VWAP, which validated the buying opportunity in this instrument. However, a correction is pending after the breakout, which may buy some time before providing a long opportunity.
The indicator window shows an overbought position as the current TDI level is above the upper line. It is a sign of an extremely bullish condition, which needs relief.
Based on this outlook, a bearish correction and a bullish rejection from the 149.00 to 148.60 area could offer a long opportunity in this pair, targeting the 151.00 level.
On the other hand, a failure to hold the price above the 148.62 level might eliminate the buying structure at any time.
Based on the current market outlook, the overall trend is bullish for EURJPY, and bulls might regain momentum from any intraday swing low point. In that case, an early buying opportunity needs additional attention to the intraday H1 chart, from where a buy signal may appear from dynamic lines.


