
Published: September 29th, 2022
Japan started intervening in the FX market to protect the yen exchange rate. Following the BoJ, the Swiss National Bank has continuously said it is prepared to step in. Observers have also urged the Bank of England to take action.
On the other hand, the continued depreciation of the euro is causing a growing amount of obvious discontent, said the ECB officials.
At this time, the major central banks are unlikely to agree to exert concerted pressure on the dollar, as they did in 1985 with the discreetly created so-called Plaza Accord. The USA's aims of reducing inflation and lowering commodity prices barely align with this.
There is a growing danger that the major central banks may act on the situation one by one by employing this mostly forgotten tool to prevent unilateral speculation against their currencies.
Despite the Bank of Japan's interest in intervening in the forex market, the EURJPY bullish price action is solid.
Let’s see the future price direction from the EURJPY Technical analysis:
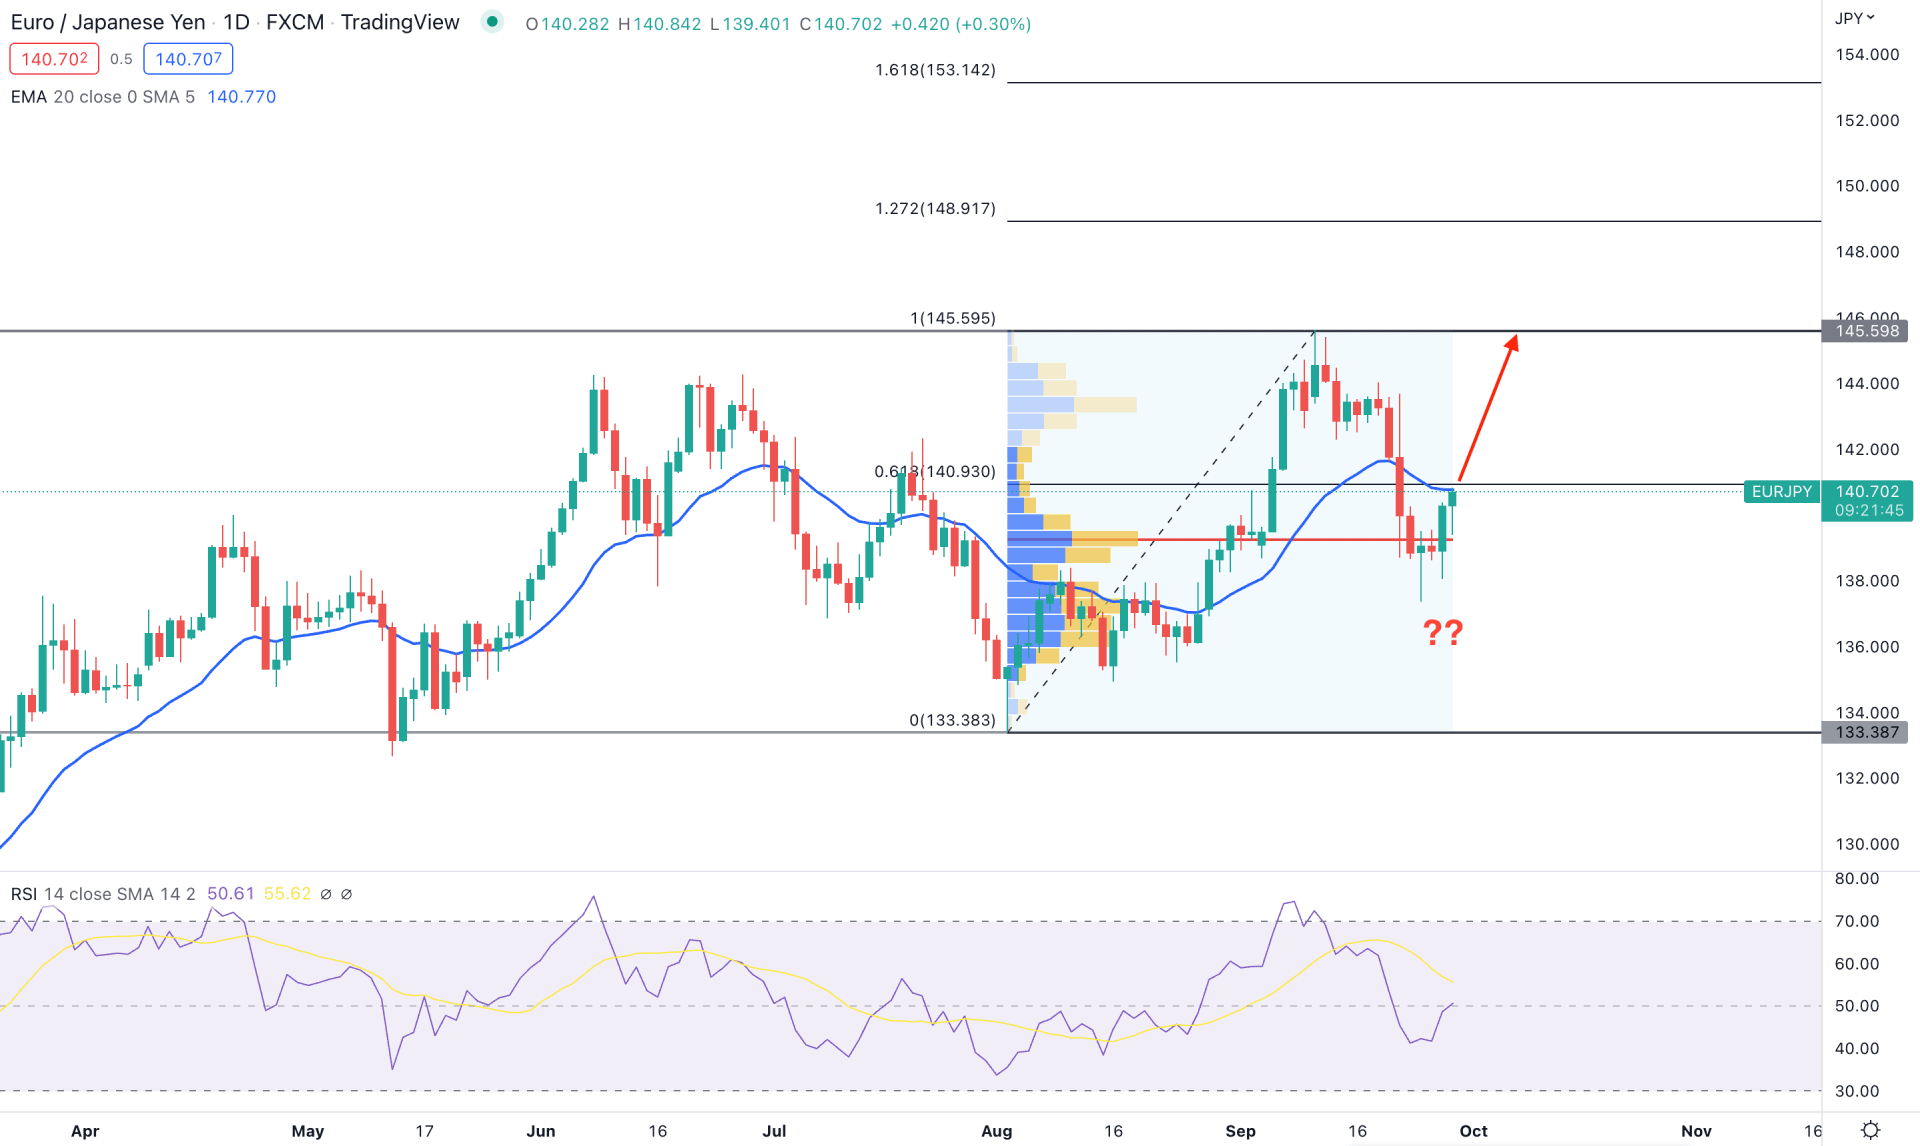
In the daily chart, the EURJPY price is trading in a long-term bullish trend, where the recent selling pressure from the Bank Of Japan's interest in intervening in the market failed to make a new swing low in the price.
As per the current price behavior, the buying pressure from 133.38 and the selling pressure from 145.09 came with Quasimodo pattern formations, which will be our current trading range. As the price is trading below 50% of the range, the primary idea is to find a long opportunity towards the 145.09 level, offering more than 400 pips of gains.
Based on the visible range trading volume indicator, the highest volume level from August low to September high is 139.22, formed this week. Therefore, the current buying pressure from the 138.06 swings low came with a strong buyer's interest, which could work as a strong bullish factor.
However, the buyer's interest is not stable from the Relative Strength Index, and the current RSI level is at a neutral 50% area. However, a bullish recovery above the 60% level would increase the possibility of reaching the 70% area, creating buying pressure in the market.
Based on the EURJPY daily price prediction, the current buying pressure is more likely to take the price up towards the 145.09 resistance level. On the other hand, breaking below the high volume 139.22 level with a bearish daily candle can alter the current price behavior and increase the possibility of reaching the 133.38 support level.
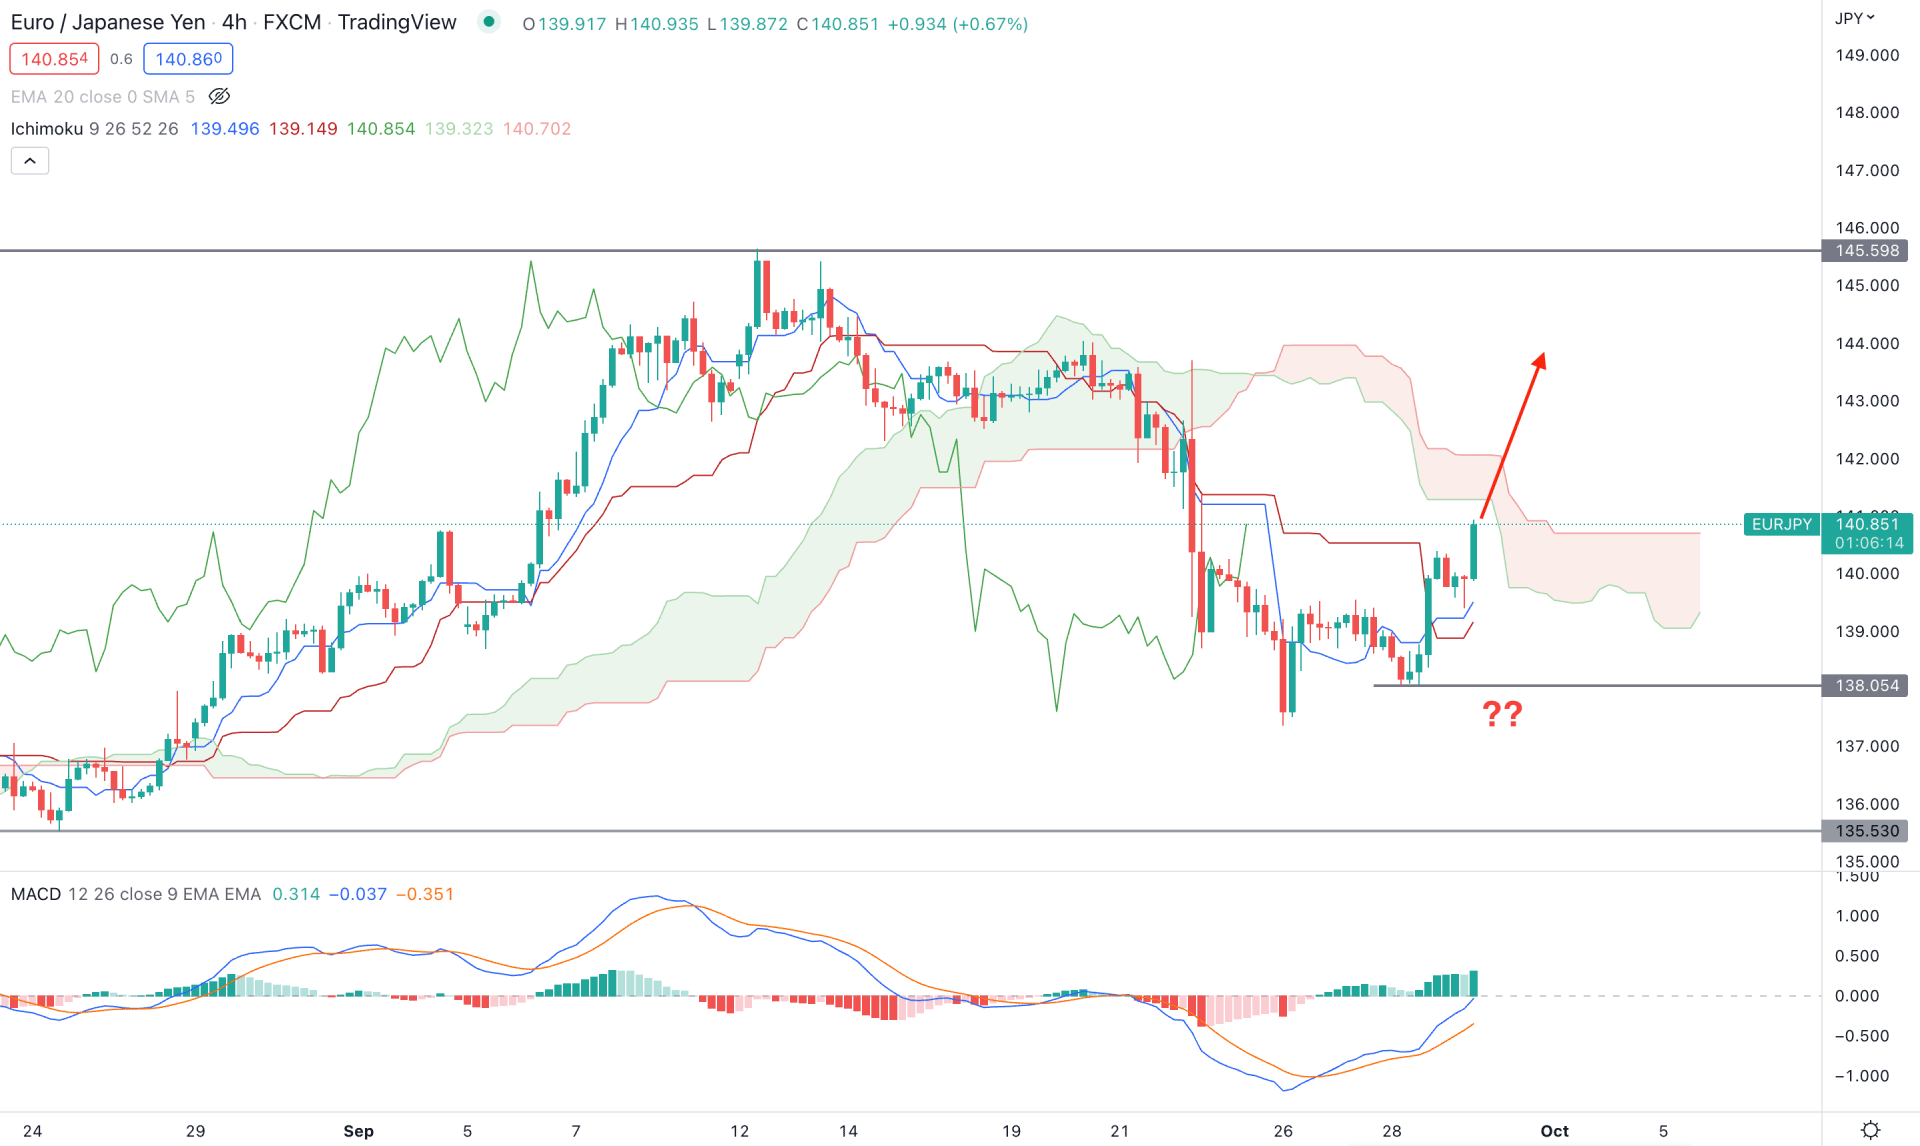
In the intraday H4 chart, the buying pressure in the EURJPY price is solid as it formed a bullish breakout above the dynamic Kijun Sen line. In the future cloud, the Senkou Span A is below the Senkou Span B but sloping higher. Moreover, the Lagging Span formed a bullish breakout by moving above the candlesticks on that level.
In the indicator window, the MACD Histogram is bullish, while MACD Lines have more rooms to move up as it is below the neutral line. The dynamic Kijun Sen is below the price and working as immediate support, followed by a bullish crossover.
Based on the H4 price of EURJPY, the bulling pressure is likely to extend in the coming days where the primary aim is to test the 145.59 key support level. On the other hand, breaking below the 138.00 level with a bearish H4 candle could lower the price towards the 135.53 support level.
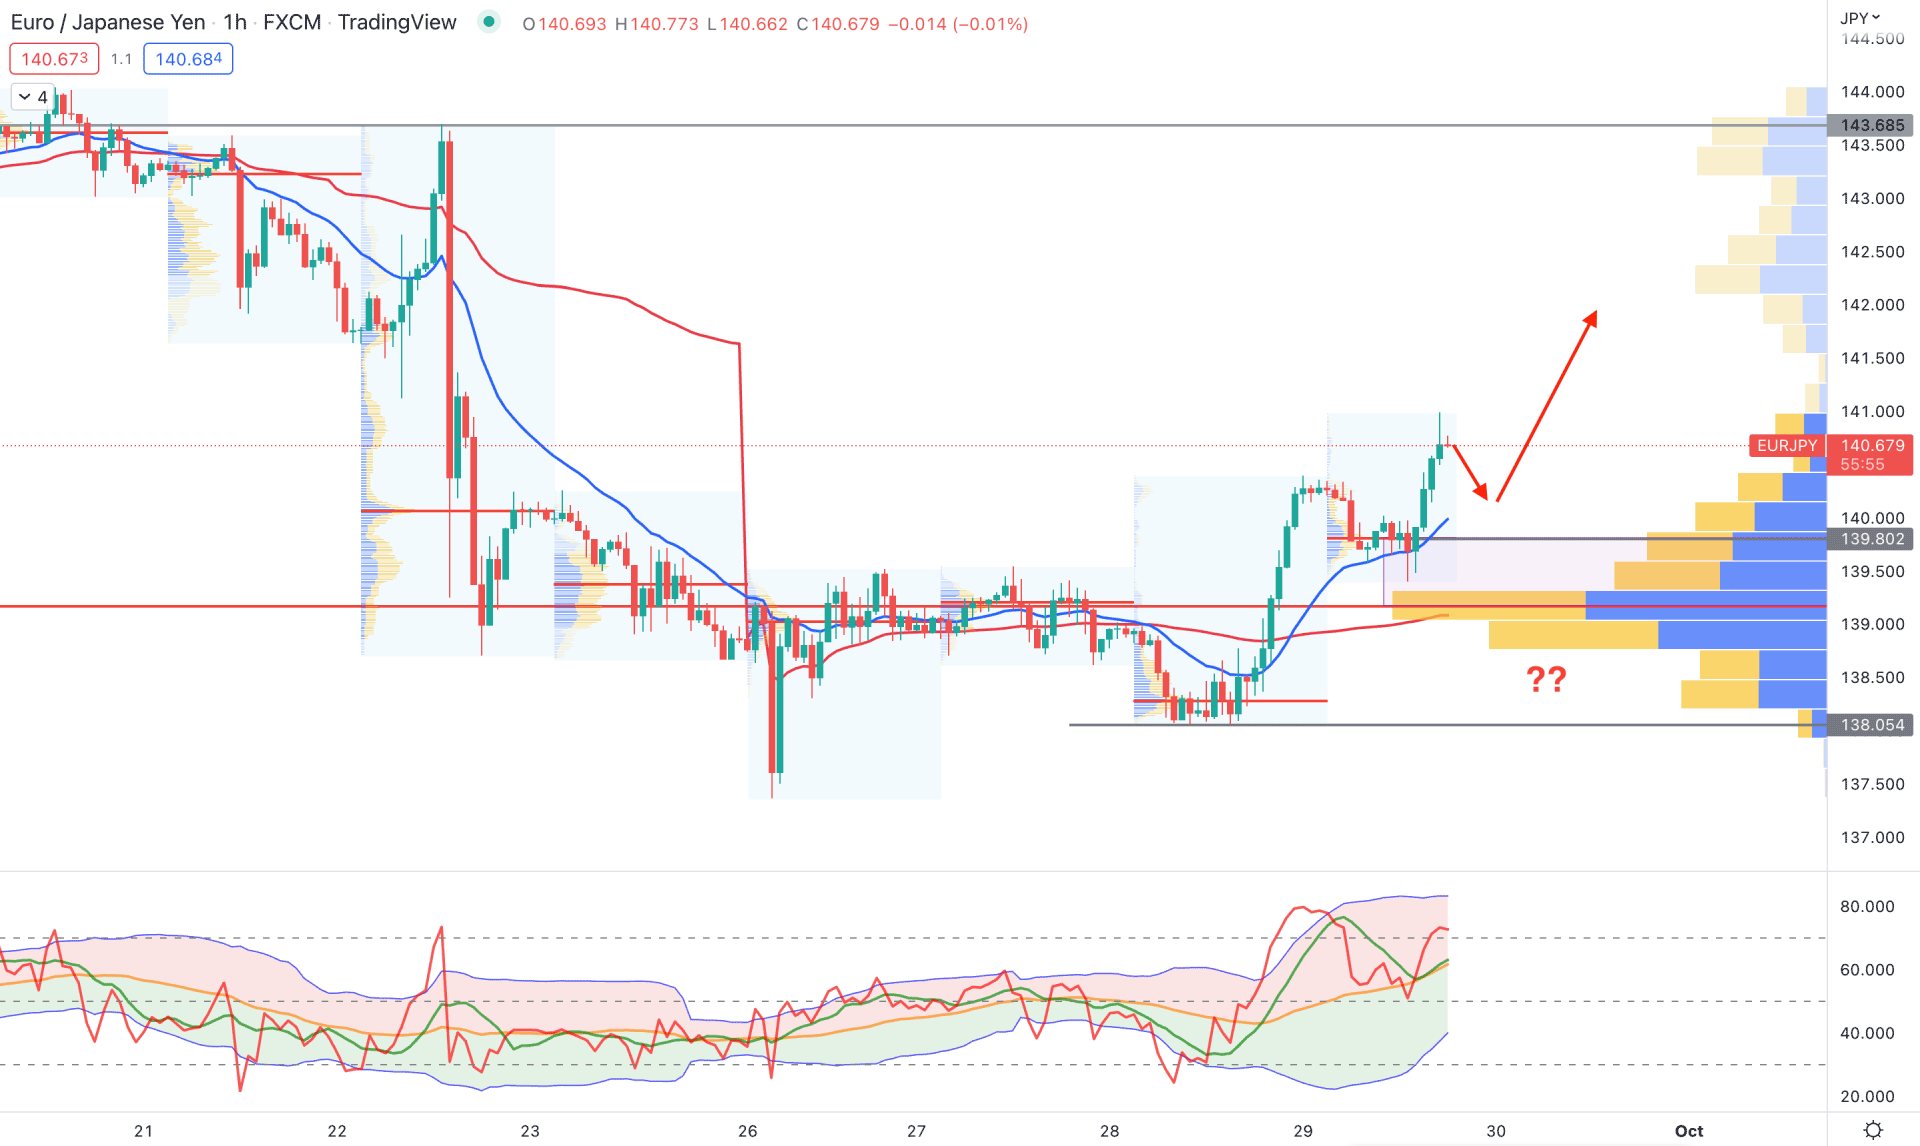
In the H1 chart, the EURJPY price is trading at the buyers' zone as the recent visible range high volume level moved below the price with a bullish breakout. Moreover, the dynamic 20 EMA and weekly VWAP are below the price, which shows a buyer's interest in the market.
The intraday high volume level is at 139.80, indicating that the buying pressure during the London session came with solid momentum. The Traders Dynamic Index also shows the same story where the current TDI level is above the 50% area, aiming for the overbought 80.00 level.
Based on the H1 chart, bulls have a higher possibility of regaining momentum as long as it trades above the 139.06 high volume level.
On the other hand, breaking below the 138.05 level with a strong bearish pressure could alter the current market structure and lower the price towards the 137.00 area.
As of the above discussion, EURJPY bullish possibility is solid, where any bullish rejection from near-term support levels could increase the price towards the 145.59 resistance level. However, investors should monitor how the Bank of Japan shows its interest in intervening in the forex market, which will be a trend-changing event.


