
Published: January 9th, 2024
The Japanese Yen (JPY) strengthened against the Euro for three consecutive days. The Bank of Japan's (BoJ) inflation target was consistently exceeded by inflation in Tokyo, which strengthened expectations that the central bank would soon taper its massive stimulus program.
In contrast, the BoJ's intention to abandon its ultra-dovish posture might have been postponed due to the Japanese government's stimulus efforts following the New Year's Day earthquake. In conjunction with the stability of the equity markets, this delay is preventing the safe-haven JPY from achieving additional gains.
In contrast to November's annualized rate of 2.6%, annualized inflation in Japan's Consumer Price Index (CPI) for December 2023 declined to 2.4%. It indicates a sustained deceleration in inflationary pressures within Tokyo's primary economic hubs.
Excluding the volatility of fresh food prices, Tokyo's Core CPI for the year ending in December adhered to market expectations at 2.1%, down from November's annualized figure of 2.3%.
In the Eurozone, the November Unemployment Rate, which Eurostat will release later in the day, is anticipated to have a minimal impact owing to its retrospective nature. The NFIB Business Optimism Index and November's Goods Trade Balance are not anticipated to generate substantial investor reaction, especially in light of the Consumer Price Index (CPI) data expected on Thursday.
In that case, the downside continuation is potent for the EURJPY pair although no significant policy change is expected from the BoJ.
Let’s see the upcoming price direction from the EURJPY technical analysis:
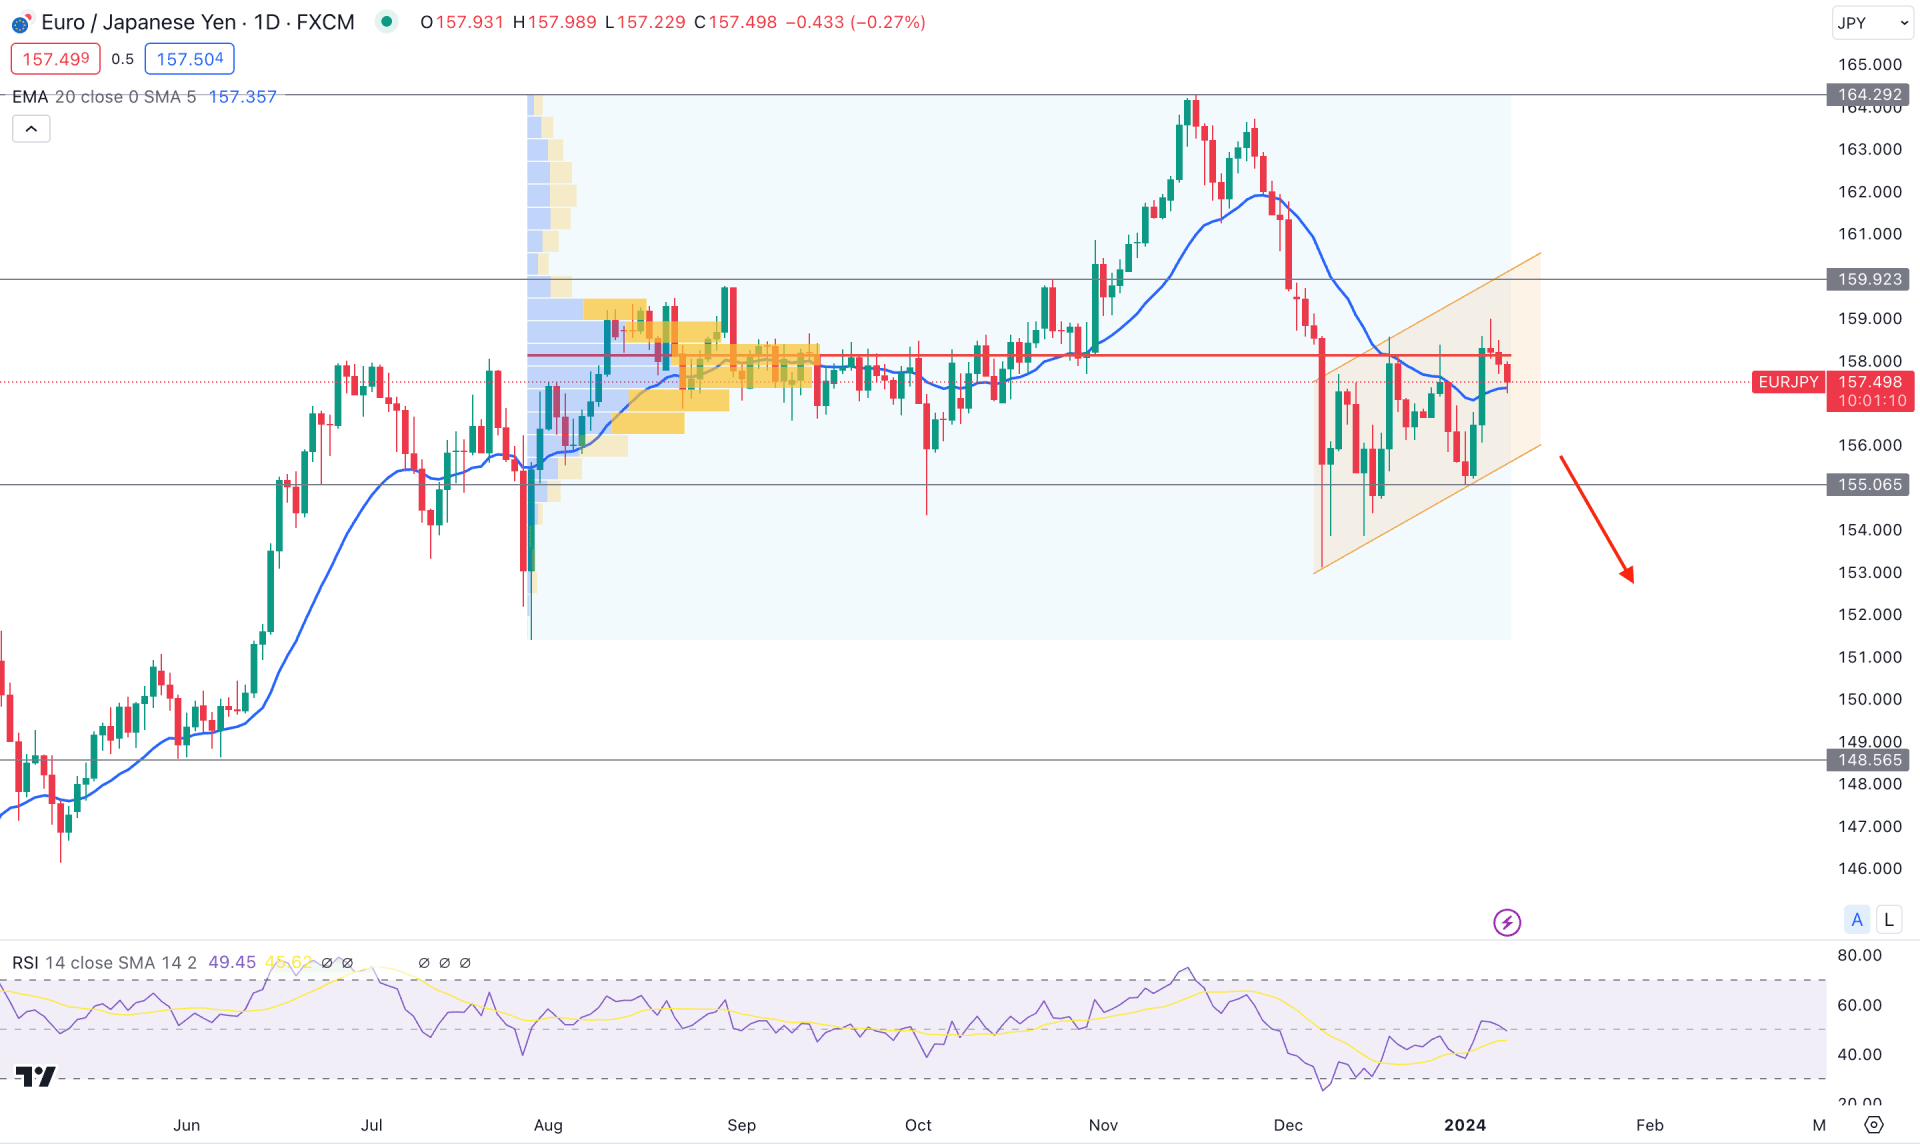
In the daily chart of EURJPY, the broader market direction is bearish, where a counter-impulsive bearish trend is in play after setting a top at the 164.29 level. In that case, the primary aim for this pair is to look for short trades as long as it remains below the ascending channel resistance
In the higher timeframe, the monthly candlestick shows a bearish engulfing bar in December 2023, eliminating the last 5 months' bullish price action. In that case, a downside continuation is potent in January 2024 as long as the price trades within the December high.
The weekly price shows a bullish corrective price action for 5 consecutive candles, where the latest candle trades bearish at the high volume area. Any bearish continuation opportunity could offer a highly probable trading signal, depending on the daily price action.
In the volume structure, the highest activity level since July 28 is at the 158.13 level, which could be a strong resistance level. Primarily, the current daily candle trades below this level, while the 20-day Exponential Moving Average shows a bullish contraction with an upward slope.
In the indicator window, the 14-day RSI is neutral at the 50.00 line, which needs more clues to find a stable trend. Moreover, the 100-day SMA is a major resistance from where a bearish candlestick rejection is in play.
Based on this outlook, the overall market momentum is bearish, where a daily close below the 156.00 level could be a conservative short opportunity. In that case, the primary target level would be the 155.05 level, before reaching the 148.55 level.
On the bullish side, a stable market above the 100-day SMA level could be the first sign of an upward continuation. Moreover, a daily candle below the ascending channel resistance could increase the price towards the 164.29 resistance level.
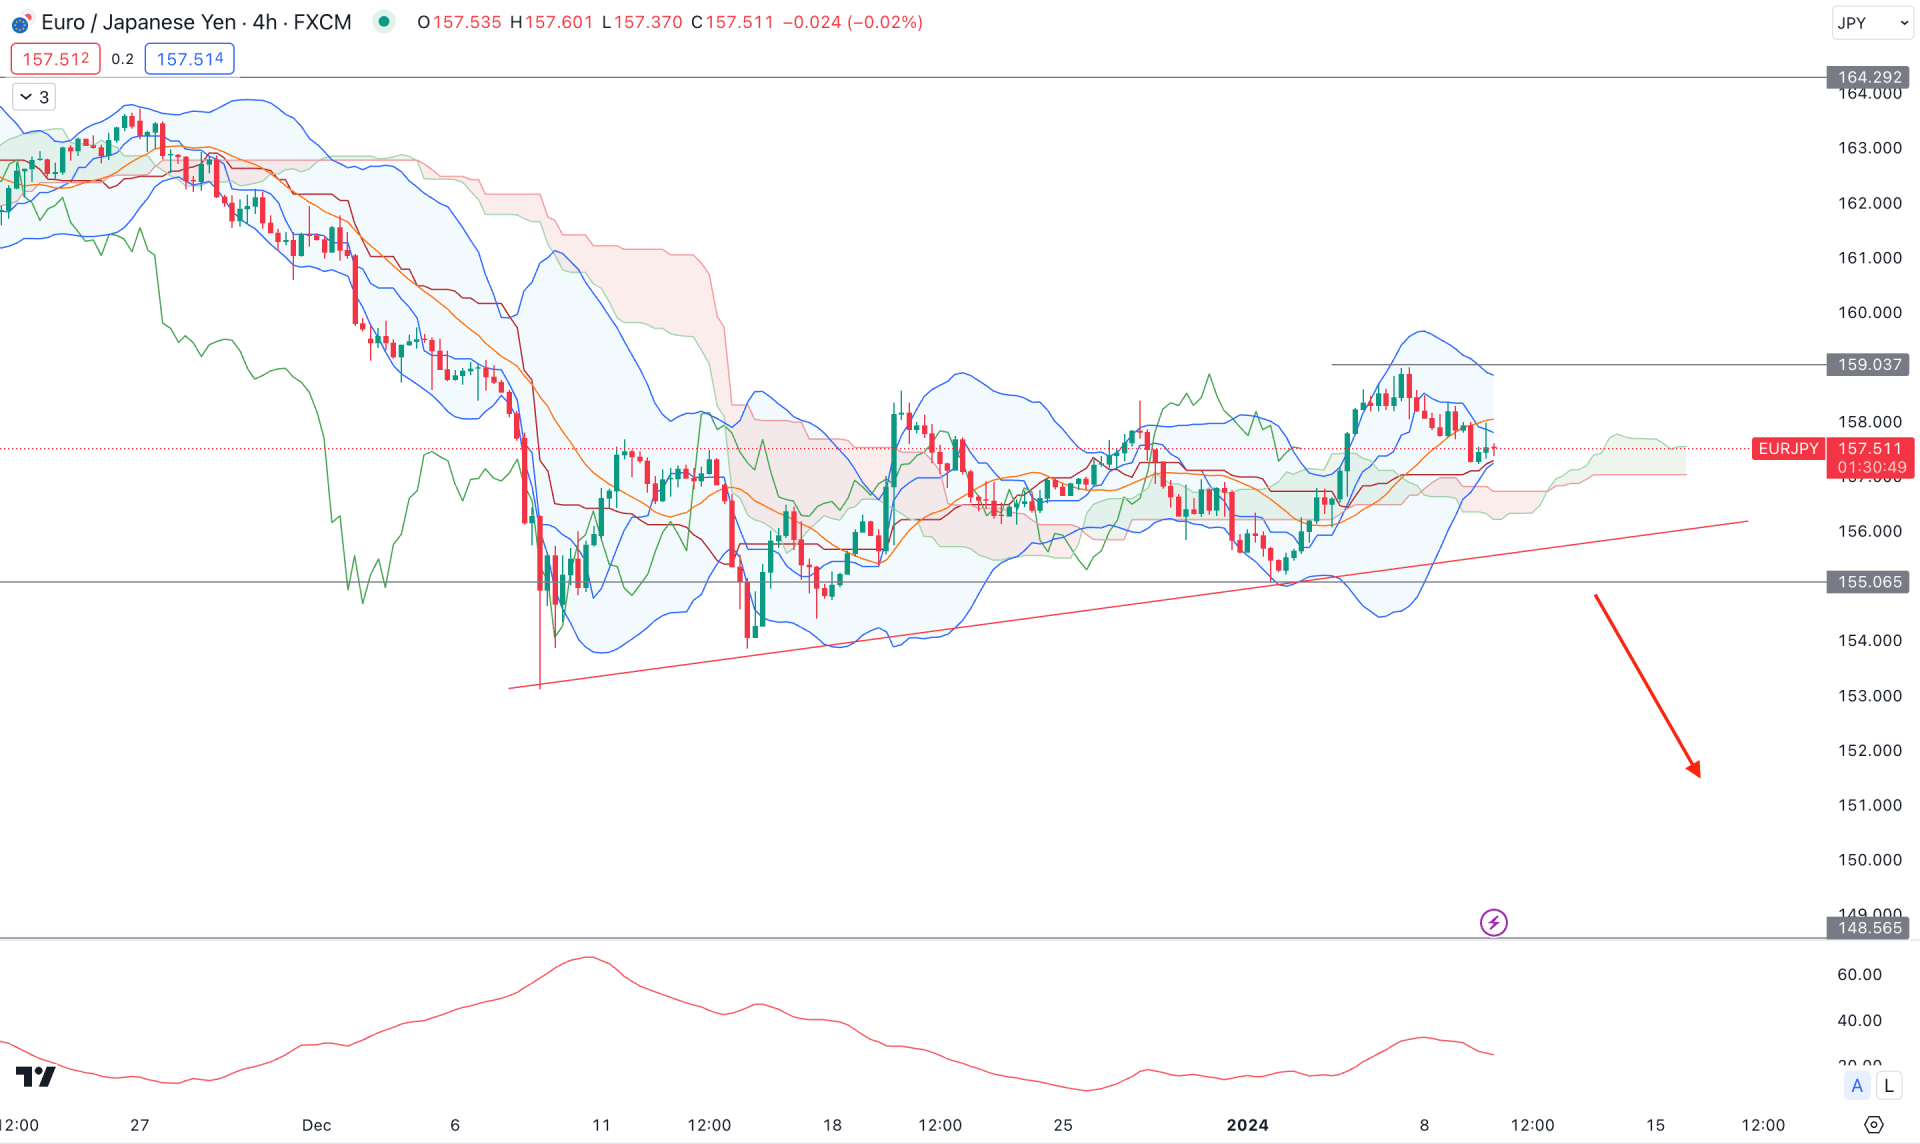
In the H4 timeframe, the broader market direction is bearish as the Senkou Span A is below the Senkou Span B in the future cloud. Moreover, the current price is below the Cloud resistance, backed by a long wicked candle indicating bearish exhaustion.
On the other hand, consolidation has been visible since the 16 November high, while the current price faces resistance from the upper Bollinger Bands. Moreover, a corrective price action is visible from the ADX indicator as the current shows a downward slope from the 40.00 level.
Based on the current market structure, a downside correction is pending towards the 148.55 support level, which might come after having a bearish H4 candle below the 155.05 support level. However, a deeper correction is possible, which needs a stable price action above the 159.50 flip zone.
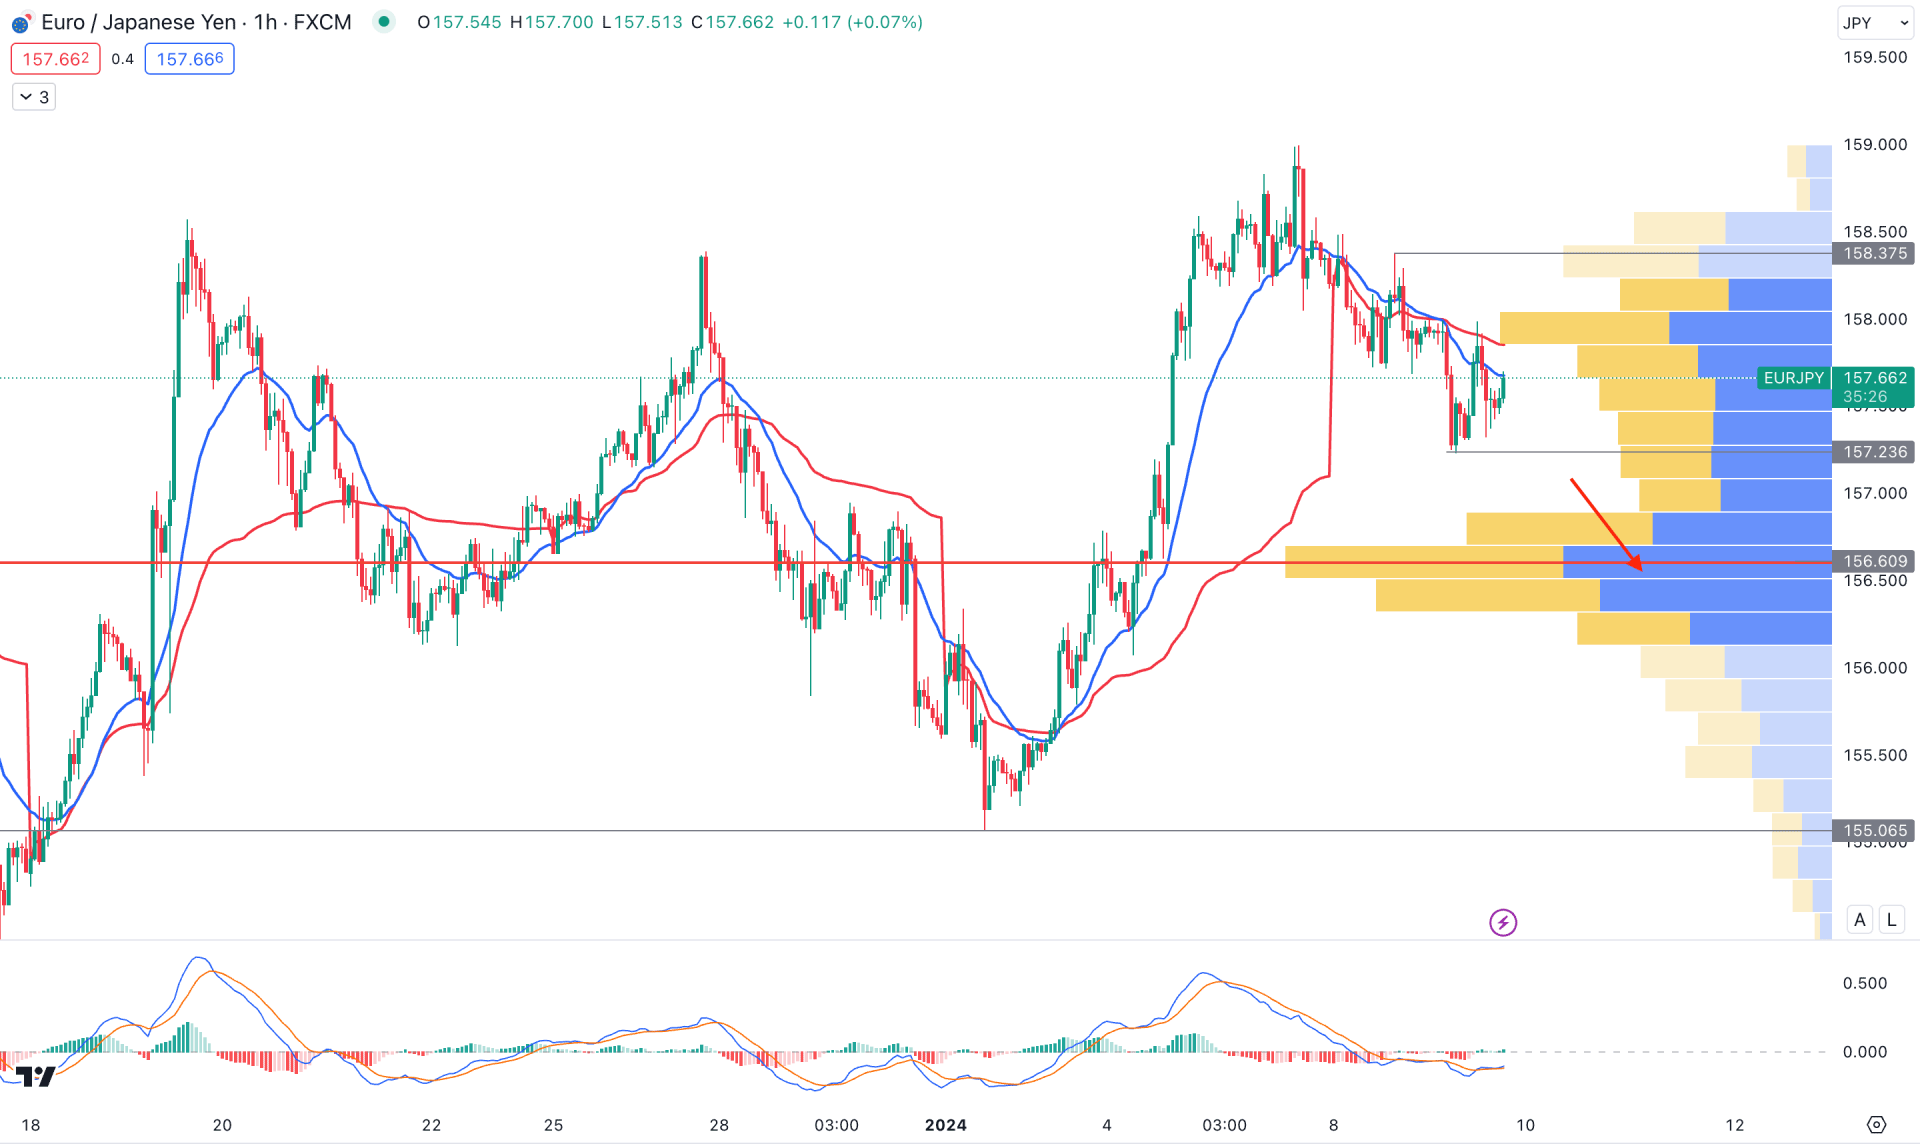
In the hourly timeframe, a bullish continuation is present where the broader market is above the visible range high volume level. Moreover, a bullish pressure is present within the ascending channel while a MACD divergence is in play.
Based on the hourly structure, a pending test towards the channel support could lower the price in the coming days. However, a decent bullish recovery with an hourly close above the 158.37 level could increase the possibility of reaching the 159.50 area.
On the bearish side, a sharp fall toward the 155.00 level could be an alarming sign to bulls, which could lower the price toward the 148.00 area.
Based on the current EURJPY outlook, the overall market trend is bearish, where an ascending channel breakout could initiate a bearish impulsive trend In that case, investors should monitor how the price reacts on the H1 support level as any failure to hold the price above it could be a bearish opportunity.


