

Published: August 13th, 2026
After rising from Friday's low of the Euro has retraced earlier losses versus the Japanese Yen (JPY) this week.
Investor trust in the Yen was damaged by the Bank of Japan's (BoJ) summary of views, published earlier on Monday, which indicated concerns about rising inflation and a divided committee over the pace of impending rate hikes. In addition, the Japanese Yen strengthened as Japan's Current Account posted its first deficit in 1.5 years.
In the meantime, there is a 90% chance that the European Central Bank will increase interest rates by 25 basis points (bps) during its policy meeting in September. The hawkish view restricts negative sentiment for the EURJPY pair and prevents traders from making strong bearish wagers on the shared currency. The USD will now be driven by US macro data, specifically the Producer Price Index and the regular Weekly Initial Jobless Claims data.
Let's see the full outlook from the EURJPY technical analysis:
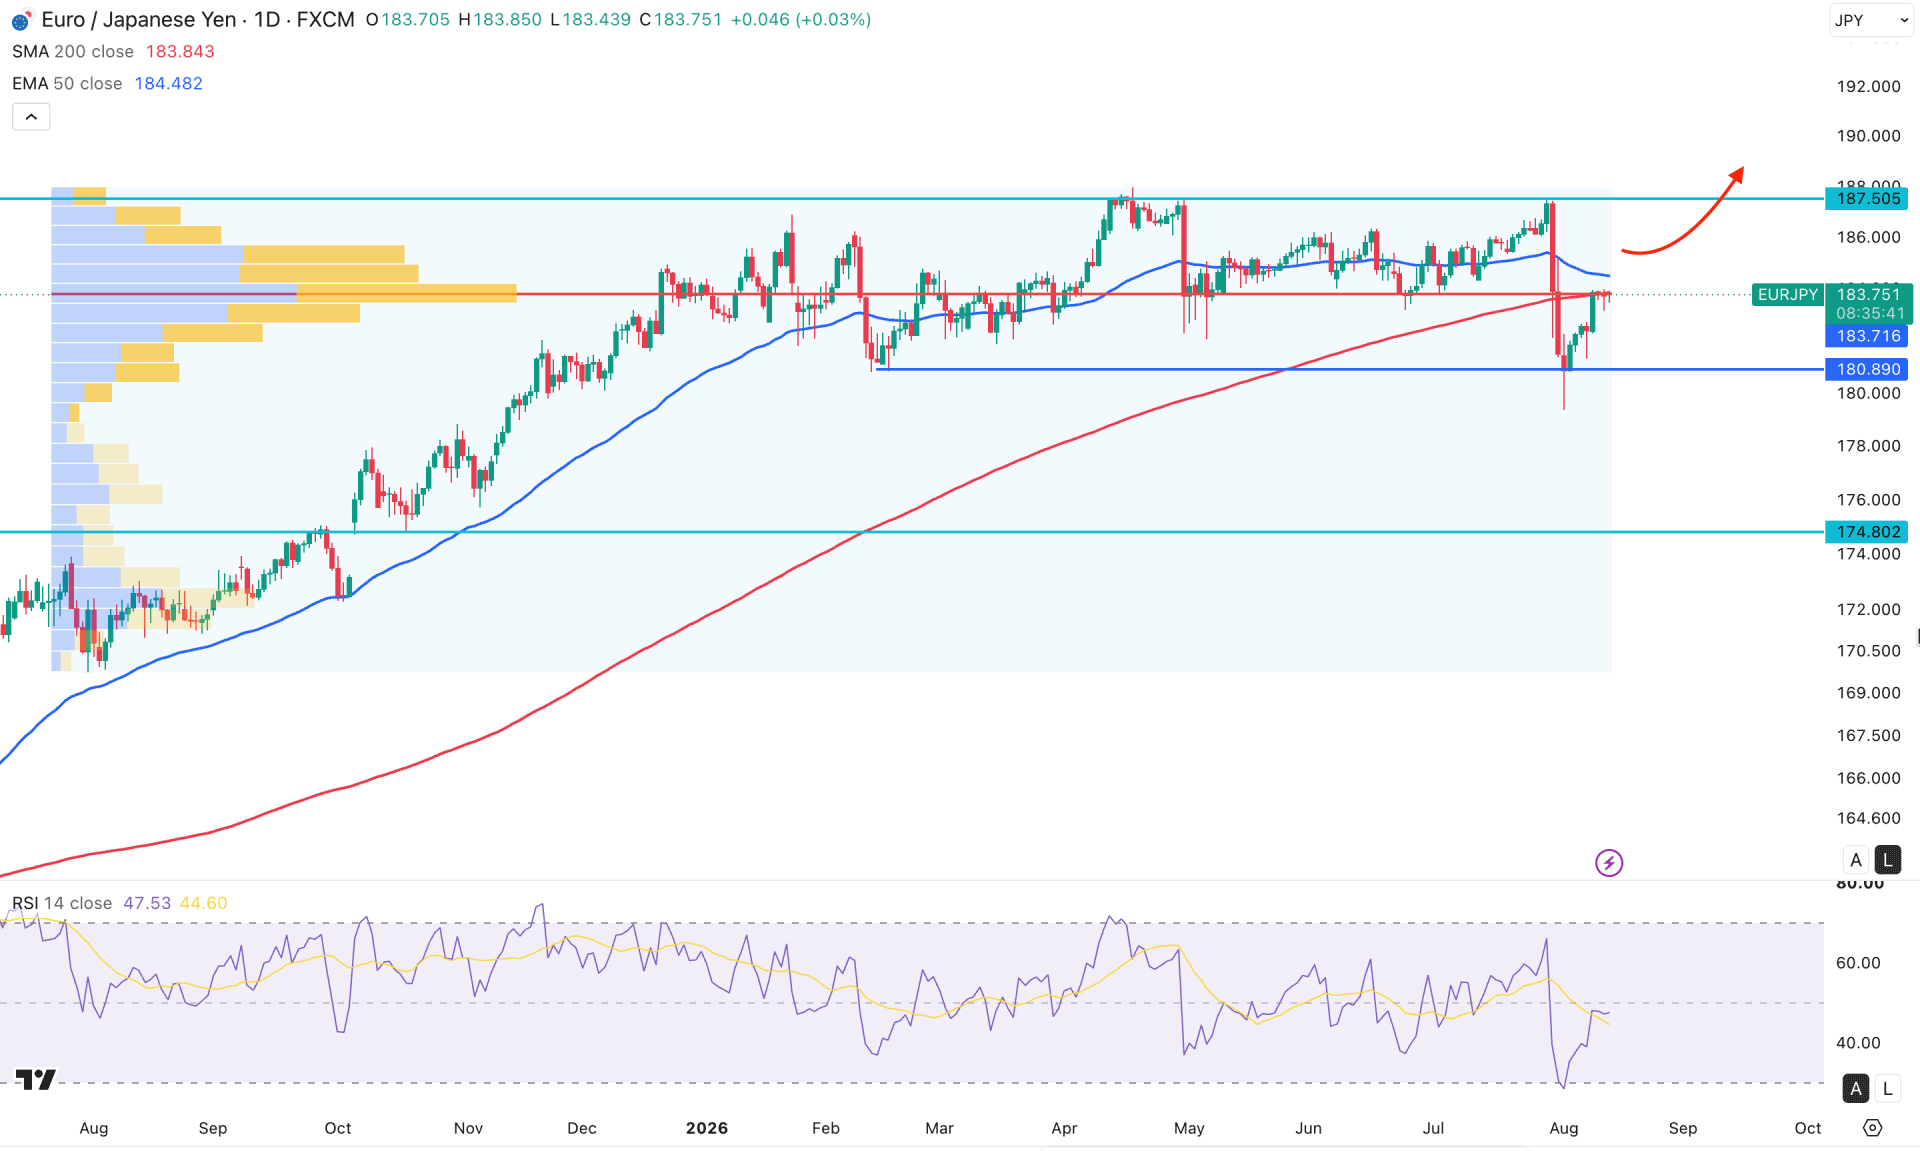
In the daily chart of EURJPY, the recent price action shows exhaustion on the seller side, grabbing liquidity from the March 2026 low. Instead of forming a continuation, the price rebounded higher with counter-bullish momentum. It is a sign of a sufficient liquidity grab from the bottom before continuing the existing bullish trend.
Looking at the higher timeframe, the price is trading in an extreme range, with sideways momentum visible on the monthly timeframe for the last eight consecutive months. It is a sign that the existing buying pressure from 2025 shows no indication of a bearish reversal at the premium price area. The weekly timeframe also shows corrective pressure, where the recent sell-side liquidity gap signals a massive bullish rebound, even if the existing candlestick is bearish from the bullish peak.
In terms of volume, the largest activity level since July 2025 is closer to the current price and at the 50% range of the existing correction. It is a sign that the price is in an order-building phase, where validation is pending before forming a bullish rebound.
The existing selling pressure, with counter-bullish momentum, came with multiple daily candles below the 200-day SMA and 50-day EMA. Even if the recent price action is below these dynamic lines, no sign of bearish continuation is visible.
Currently, a daily gravestone Doji candlestick is visible at the 200 SMA line, signaling a barrier to buyers. Overcoming this dynamic line could be a crucial confirmation for buyers, who might face another barrier at the 50-day EMA.
In the secondary indicator window, the Relative Strength Index tested the 30.00 oversold level but failed to move above the 50.00 neutral line.
Based on the overall market structure, the price is currently facing strong resistance from the 50-day EMA and 200 SMA. Overcoming the 50-day EMA line with a bullish daily candle could be a remarkable confirmation for buyers. In that case, a daily close above the 184.62 level could open room for reaching the 187.50 area before forming a long-term range breakout.
On the other hand, the price is near the 50% retracement level of the existing higher-timeframe range. A bearish rebound is possible from the dynamic resistance levels. Investors should closely monitor how the price reacts at the resistance line. A bullish break followed by an immediate rebound below the 200 SMA could eliminate the buying structure and retest the 180.89 level before forming any bullish setup.
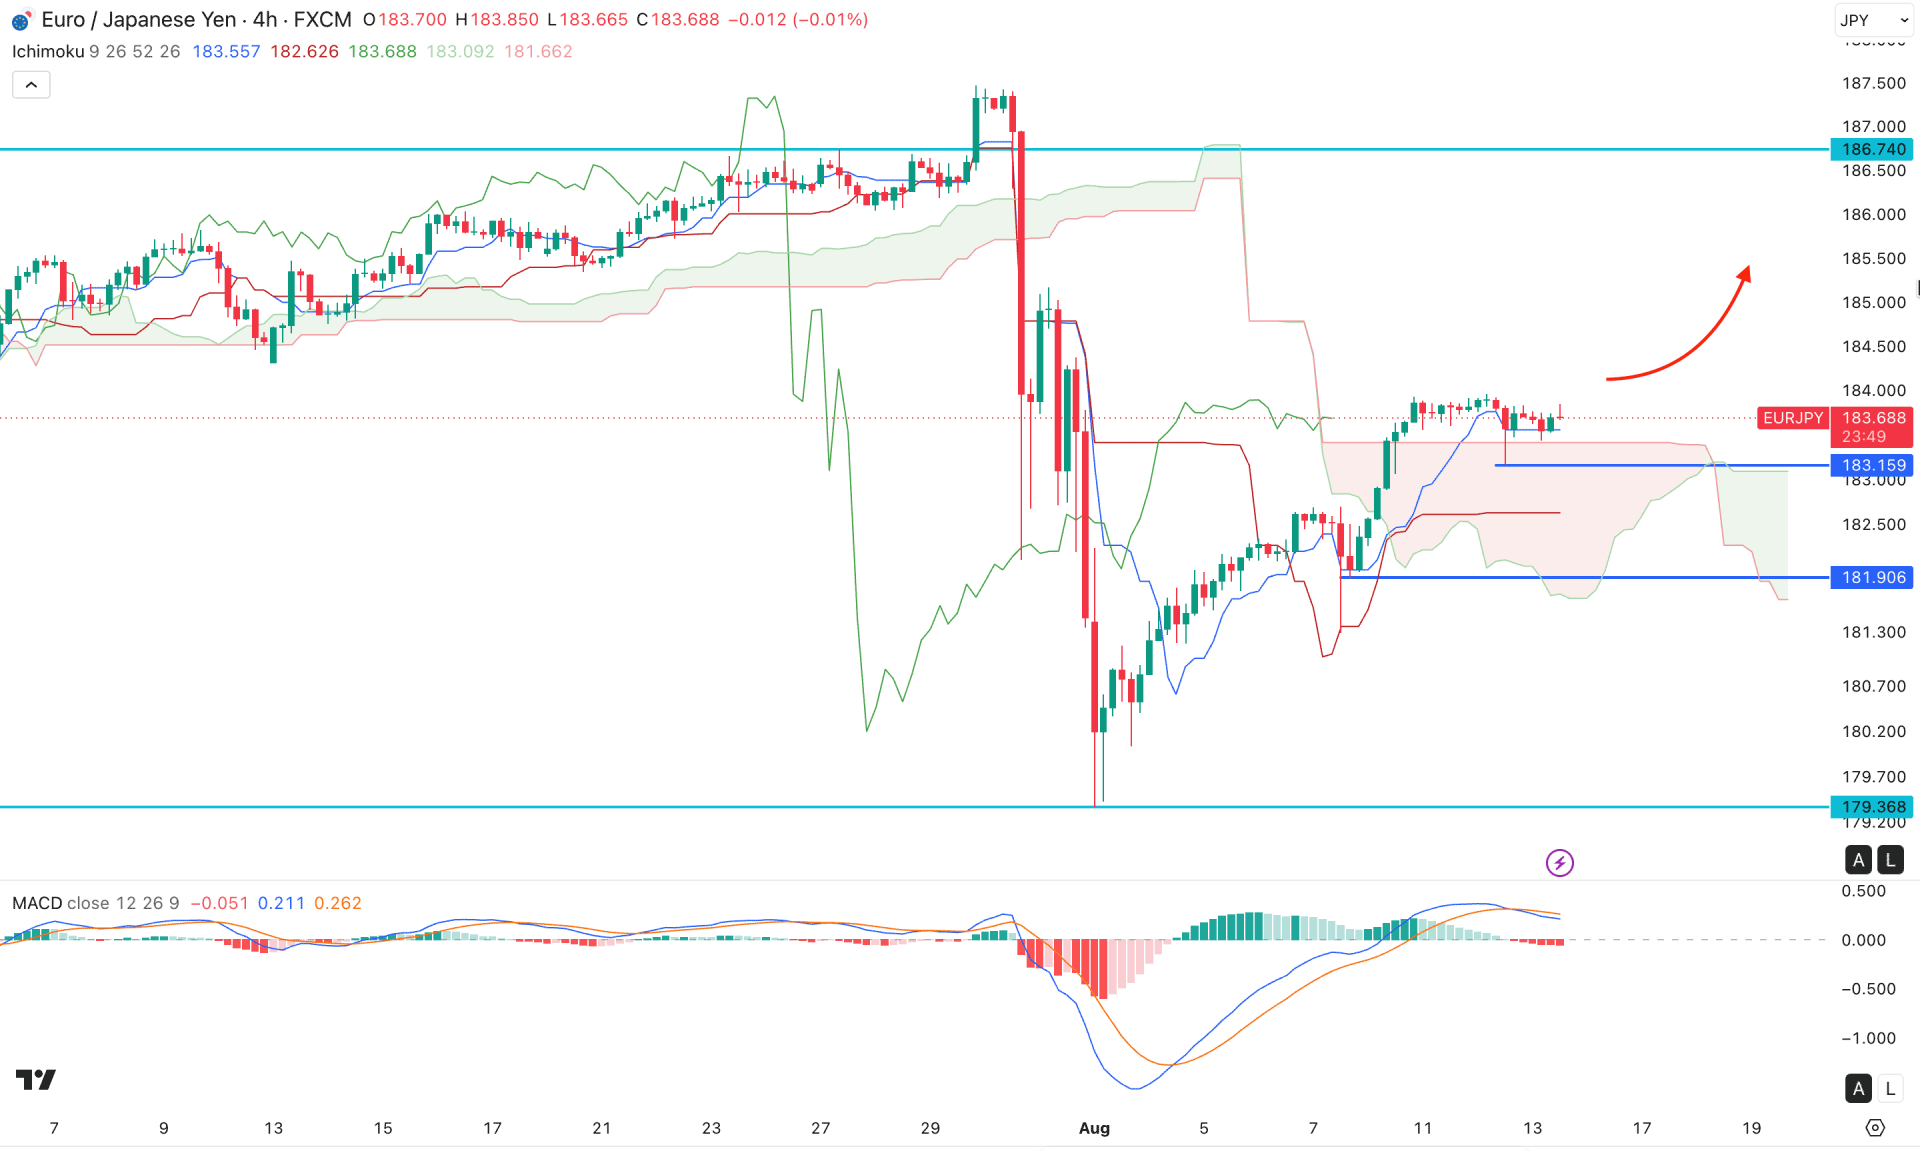
In the H4 timeframe, the recent buying pressure from the 179.36 bottom came with multiple higher-high formations and a valid bullish cloud breakout. As a result, the future cloud has flipped position, signaling a bullish continuation. However, the mid-term trend shown by the Kijun Sen support indicates that the most recent price action is extremely corrective above the cloud support.
In the secondary indicator window, the MACD signal line is showing sideways momentum with a bearish crossover at the bullish peak, where the histogram failed to extend the selling pressure below the neutral area.
Based on the overall market outlook, we may anticipate bullish continuation as long as the price holds gains above the cloud support area. In that case, a valid range breakout with a four-hour close above the 183.96 level could enable a long opportunity targeting the 185.16 level. Moreover, an extended consolidation above the cloud support could increase the possibility of moving beyond the 186.74 area.
The alternative trading approach is to find sufficient liquidity grab from the 183.15 swing low before forming a bullish rebound. However, the 181.90 support level could be a crucial barrier for sellers. A break below this line with a valid four-hour close might invalidate the bullish structure and force the price to test the 179.36 support level.
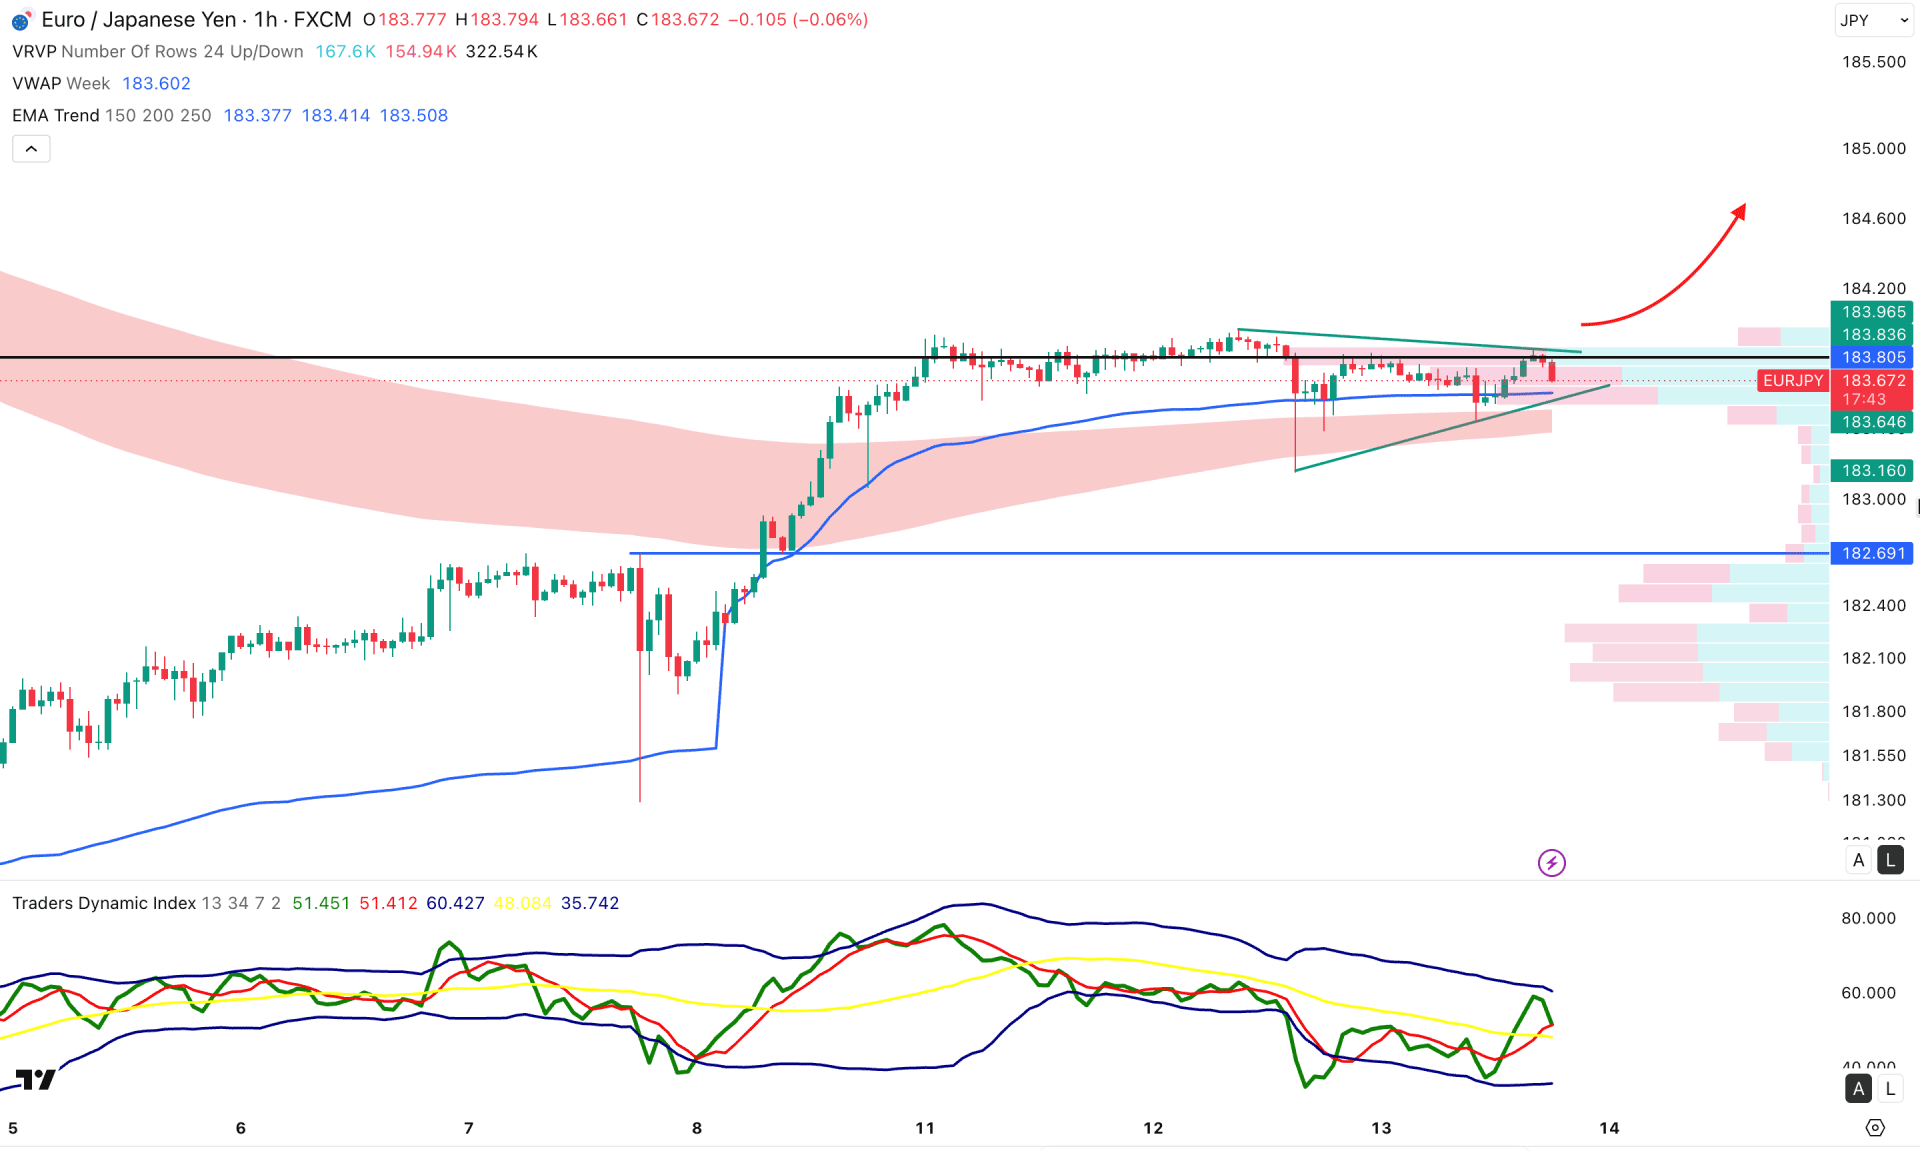
In the hourly timeframe, EURJPY is trading with extreme sideways momentum after forming a bullish rebound from the existing yearly low. After creating double-top liquidity at the 183.93 level, the price moved sideways with multiple exhaustion signals at the bottom. As a result, a symmetrical triangle formation is visible, where the high-volume line is closer to the current price.
On the other hand, the weekly VWAP remains below the current price, which supports sideways momentum, while the EMA wave is the ultimate support in this structure. The Traders Dynamic Index shows a different story, as a higher bullish peak has formed. As per the indicator reading, the current TDI line is still above the 50.00 neutral level, signaling buyer territory in the market.
Based on this outlook, a bullish symmetrical triangle breakout could be a primary long opportunity in this pair that can take the price to the 185.00 area.
On the other hand, a failure to hold the price at the EMA wave could validate a bearish triangle breakout that can retest the 183.16 swing low before forming a bullish rebound. However, extended selling pressure below the 182.69 level could invalidate the bullish structure at any time.
Based on the overall market structure, EURJPY is trading sideways after having a bullish peak, and a buy-side breakout is highly possible. Investors should closely monitor the hourly price action, where a potential bullish break with sufficient liquidity grab could resume the existing daily trend at any time.


