
Published: February 4th, 2025
In the current chart, the EURJPY cross rose to around 160.00 as investor confidence is bolstered by American President Trump's decision to postpone plans to tax Canada and Mexico. This decision causes the Japanese yen (JPY), a safe-haven currency, to decline.
Trump announced late Monday that he will temporarily suspend the 25% charges on products coming into the US from Canada and Mexico for a month. The Euro (EUR) rises from monthly lows versus the JPY due to the risk-on mentality.
In direct reaction to US President Donald Trump's announcement of a 10% tax on Chinese imports, China's finance ministry issued a package of duties on a variety of US goods on Tuesday, notably farm equipment, crude oil, and certain automobiles. The JPY might gain from any indications of uncertainty or rising trade war anxiety, which would increase safe-haven movements.
Additionally, the Tokyo core CPI reached 2.5%, the quickest annual rate in almost a year, significantly above the Bank of Japan's (BoJ) 2% objective and sustaining market projections for additional interest rate increases. As a result, the JPY's losses may be lessened.
Let's see the further aspect of this pair from the EURJPY technical analysis:
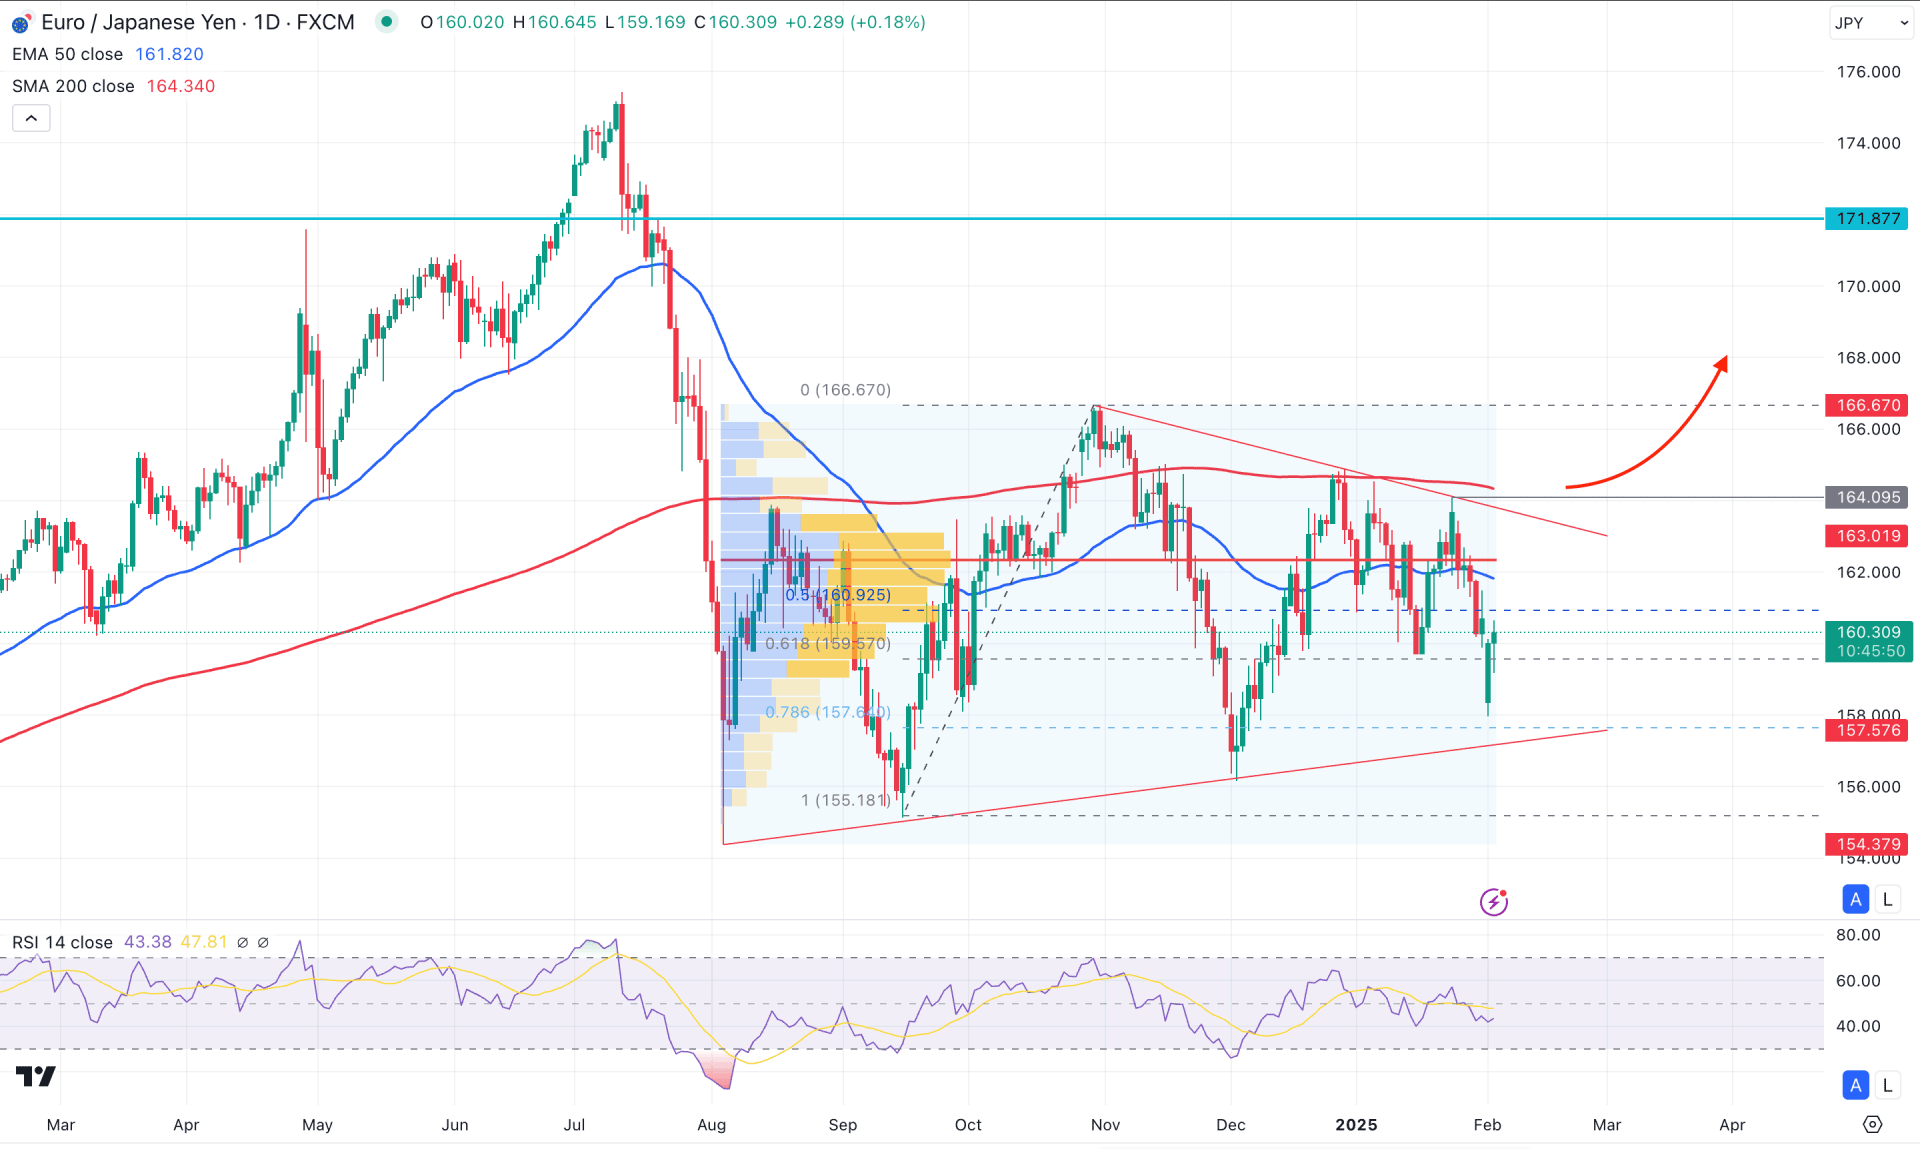
In the daily chart of EURJPY the market remains within a consolidation after a strong selling pressure. However, the impulsive selling wave left some imbalance at the top which is likely to be filled from the current context.
The immediate bullish recovery swing is found at the 165.18 low to 166.87 high. After validating the swing with a bullish break of structure, the price remains sideways at the discounted area. Therefore, the main aim for this pair is to wait for a bullish recovery from the discounted area that may result in a bullish trend continuation soon.
In the volume structure, the largest activity level since the August 2024 crash is just above the current price and working as a resistance level. The price aimed to move higher above the high volume line but failed to sustain the momentum. However, the recent selling pressure from the top has found a bottom from double-bottom liquidity, which might validate the long opportunity from
In the main price chart, the dynamic 200-day Simple Moving Average and 50-day Exponential Moving Average remained sidelined above the current price, which signals indecisive momentum. As the recent market is hovering with a potential triangle formation, a range extension towards the resistance area could be possible.
Based on this outlook, the higher timeframe price action is bullish as the price eliminated losses from the January 2025 low. Also the weekly candle shows more space upside, which signals a higher possibility of a bullish correction.
In this context, overcoming the dynamic 50-day Exponential Moving Average could be the conservative long signal. In that case, the price is likely to find a resistance from the 164.09 swing high. Also, overcoming this level could extend the upward pressure above the 170.00 psychological zone.
On the bearish side, a potential sell zone is present from the 162.00 to 164.00 area as a valid bearish pressure from this area with a new intraday swing low formation could be a short opportunity, aiming for the 155.18 low.
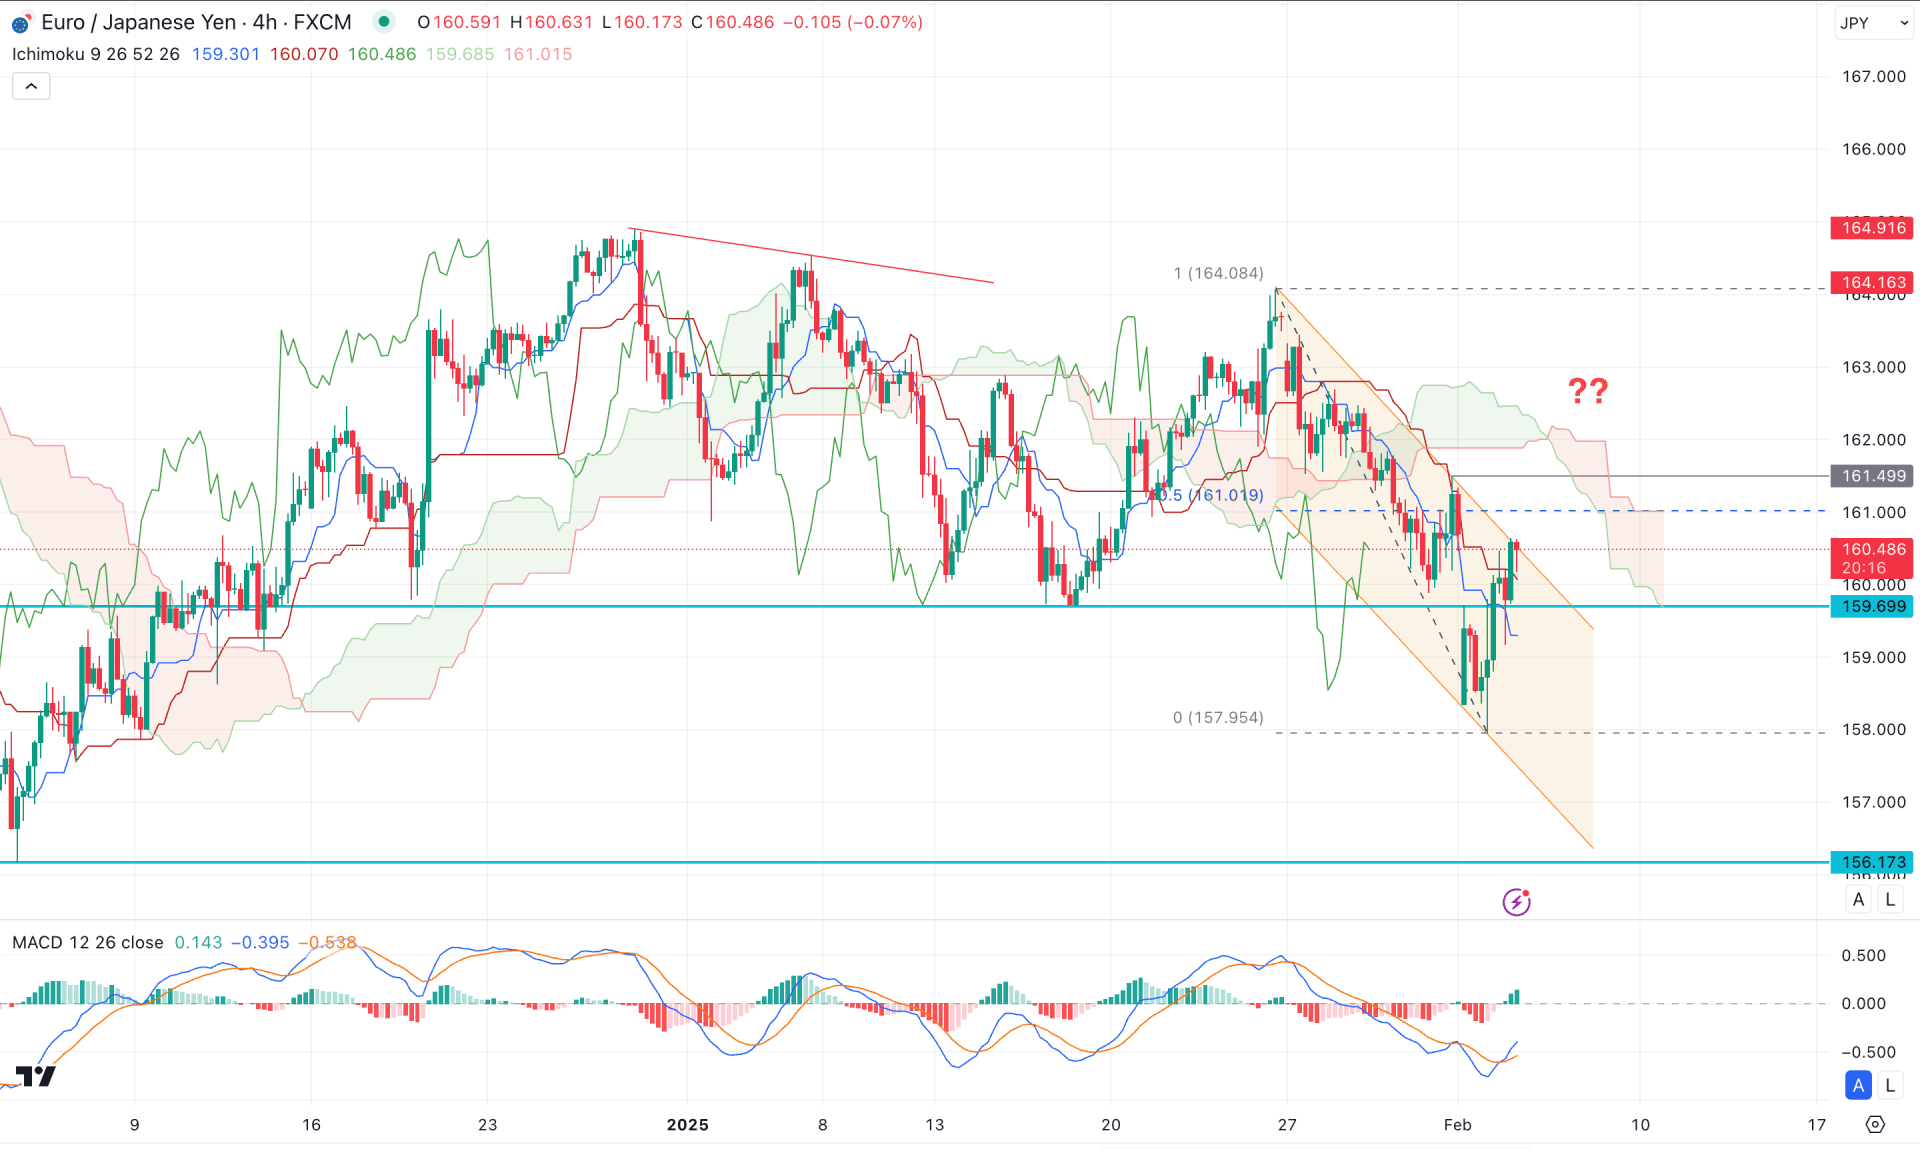
In the H4 timeframe, the ongoing market momentum is bearish as the current price moves below the dynamic Ichimoku Cloud zone. Moreover, the Senkou Span A and Senkou Span B remain downward, signaling the major bearish signal.
On the other hand, the MACD indicator shows a bottom formation as the Signal line has rebounded from a bullish crossover.
In this context, investors should monitor how the price reacts at the channel resistance. A bullish break above the 161.49 high with an immediate recovery below the Kijun Sen line could be a probable bearish opportunity in this pair.
On the other hand, a break above the cloud high with a consolidation could be a potential bullish reversal, which could extend the price above the 164.16 area.
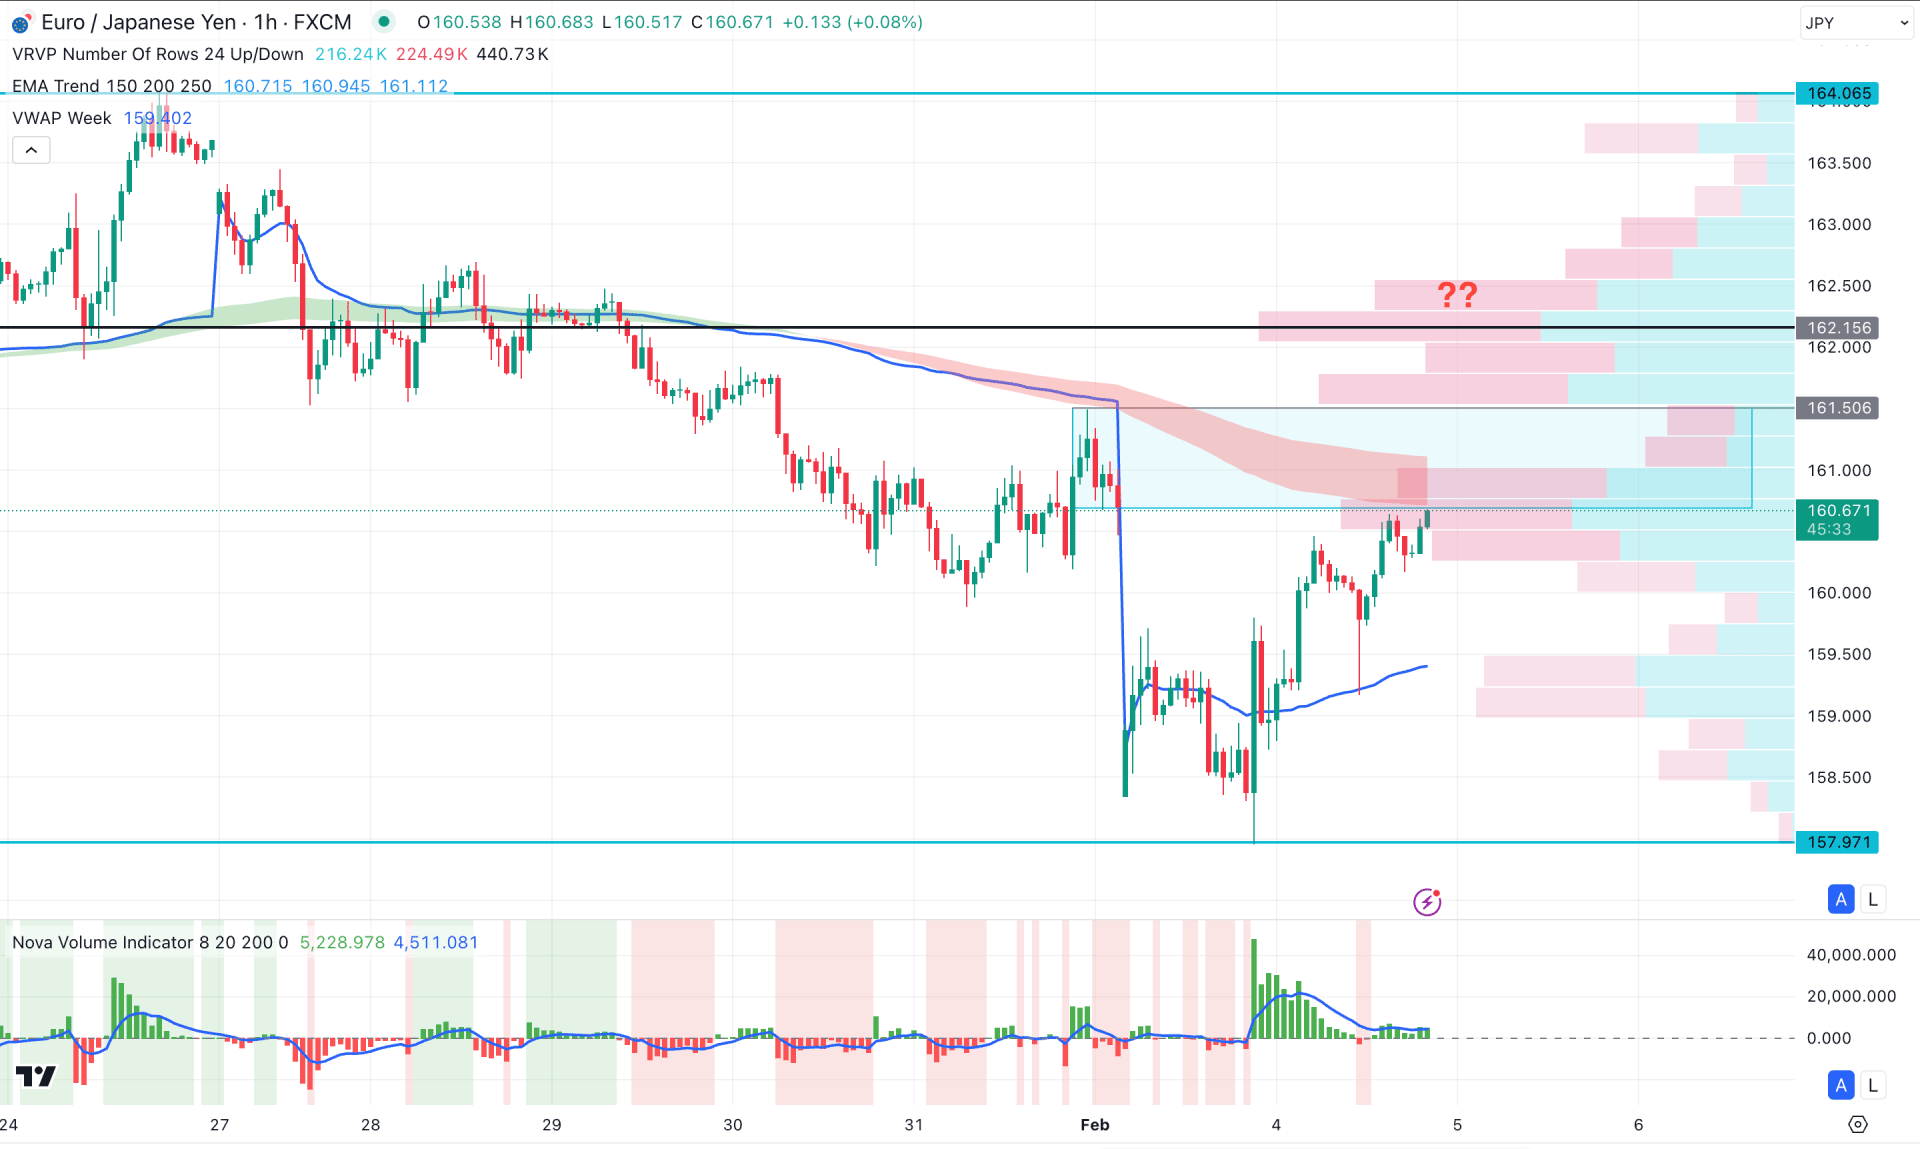
In the hourly time frame, the recent price shows an intraday bullish pressure, where the potential demand zone from the rally-base rally is nearing. Primarily, investors might expect a selling pressure from the demand zone, until a new swing high is seen.
In the volume indicator, the positive Histogram maintained a stable position above the neutral point, which signals buyers' presence in the market.
Based on this outlook, a bullish breakout from the EMA cloud could be a potential long signal. However, a failure to overcome the demand area might resume the existing selling pressure towards the 157.97 support area.
Based on the current market structure, EURJPY is more likely to extend the upward correction and reach the trendline resistance in the daily chart. As the intraday price is still bearish, one more push to sellers could be an early long signal on the daily trend.


