
Published: May 28th, 2026
After falling more than 1% in less than a week, the Euro (EUR) is now trading stronger against the British Pound, reducing losses. However, Euro bulls have so far been limited below the 0.8700 region, keeping the pair currently trading within Monday's range and maintaining its overall bearish trend.
The European Central Bank's (ECB) head of economics, Philippe Lane, made hawkish remarks, which supported market expectations of impending rate increases, but have not significantly helped the Euro.
The relatively low yield on UK Gilts, amid dwindling expectations of tighter Bank of England (BoE) monetary policy, means the Pound is still rather resilient to the UK's uncertain political situation.
Let's see the further outlook from the EURGBP price analysis:
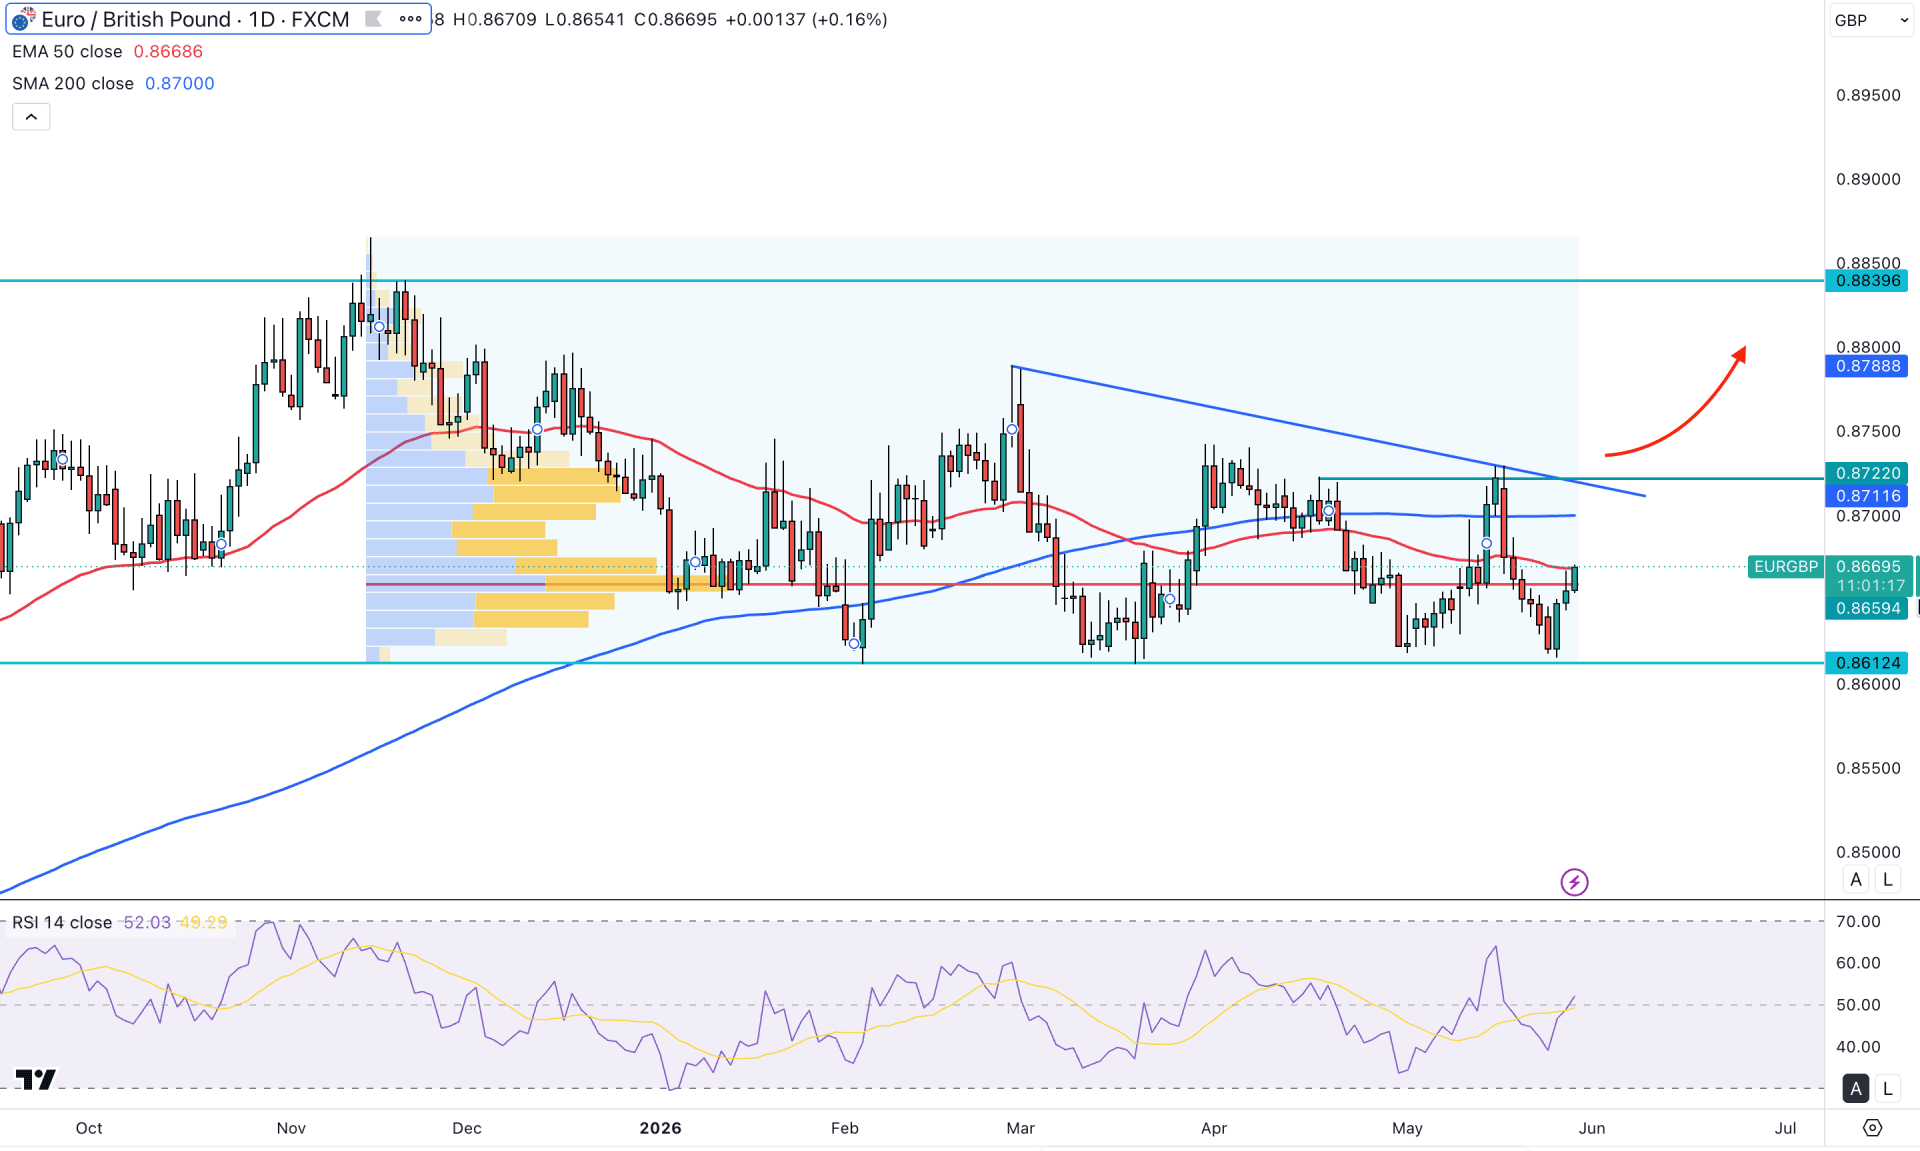
In the daily timeframe, EURGBP is trading within a sideways momentum where the existing market trend is bullish. Primarily, it is a sign of a minor dose of correction after a strong bullish wave from higher, and a trend continuation momentum could come.
The monthly timeframe suggests an ongoing correction after a bullish impulsive wave, from where a valid confirmation is needed before anticipating a trend continuation. The most recent monthly candle is still trading within the bar body formed in April 2026, which needs to be overcome to provide a primary sign of a bullish pattern. The weekly timeframe also provides a sign of volatility, where multiple rejections are seen at the bottom. As the most recent price is trading near the 0.8659 weekly support, corrective bank pressure is expected.
In terms of volume, buyers are still favorable as the largest activity level since November 2025 is at 0.8658, which is in line with the current price.
Buying pressure from the current price area has some challenges, and dynamic resistance levels are one of them. Although the 200-day SMA is above the current price and moving flat, the 50-day EMA is still having a downward slope. Moreover, the existing price action showed multiple violations above the dynamic 200-day SMA, signaling volatility.
The RSI is at the 50.00 midline, signaling corrective pressure, but the recent rebound from the 39.04 level suggests an early bullish opportunity.
Based on the overall market structure, the price is trading within a corrective section, but the near-term section is bullish from a two-way reversal from the support area. In that case, overcoming the high volume line with a bullish daily candle could increase the possibility of testing the trendline resistance covering at 0.8713 high. Moreover, overcoming this line with a valid daily close could increase the possibility of testing the 0.8839 level.
On the bear side, dynamic resistance levels are a crucial area to look at. Any valid reversal from the 200-day SMA with a daily close below the 0.8660 level could increase the possibility of breaking the 0.8611 support level and testing the 0.8550 area.
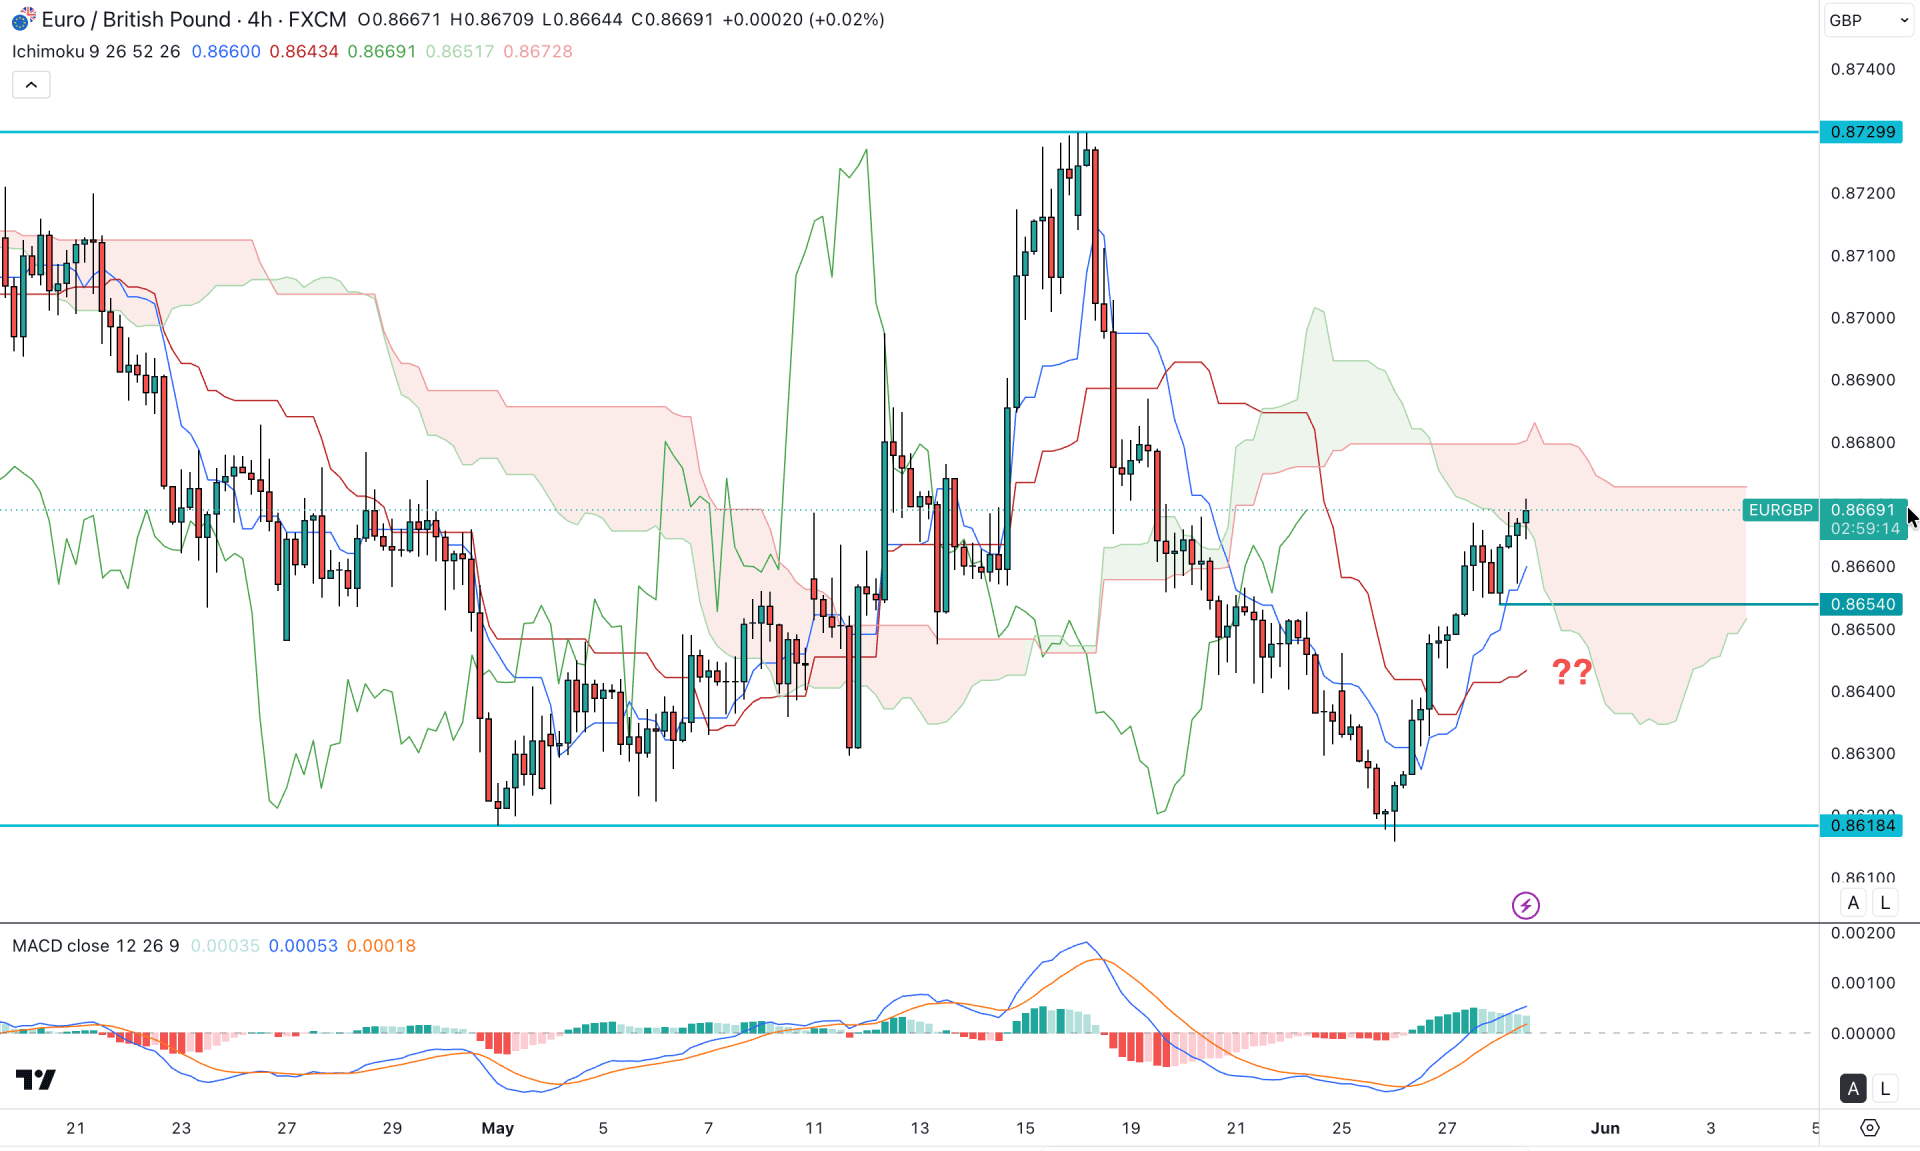
In the four-hour timeframe, the recent price shows a bullish recovery from a valid bottom formation, but a proper breakout is still pending above the cloud area. The selling pressure is getting weaker as the future cloud is heading upwards.
The secondary indicator window signals an additional buying signal where the current signal line is having a bullish crossover from the bottom. Moreover, the histogram maintains a position above the neutral line even if weakness is visible.
Based on the four-hour market outlook, the entire section is still below the cloud register, signaling a limit to bulls. However, a bullish crossover is seen among dynamic lines where the immediate support is visible at the 0.8654 level. In that case, a break below this line with a bearish four-hour candle could increase the bearish possibility targeting the 0.8618 level.
On the other hand, the alternative scenario is to wait for a bullish break above the 0.8680 cloud resistance level, which could open the room for moving to the 0.8729 resistance level.
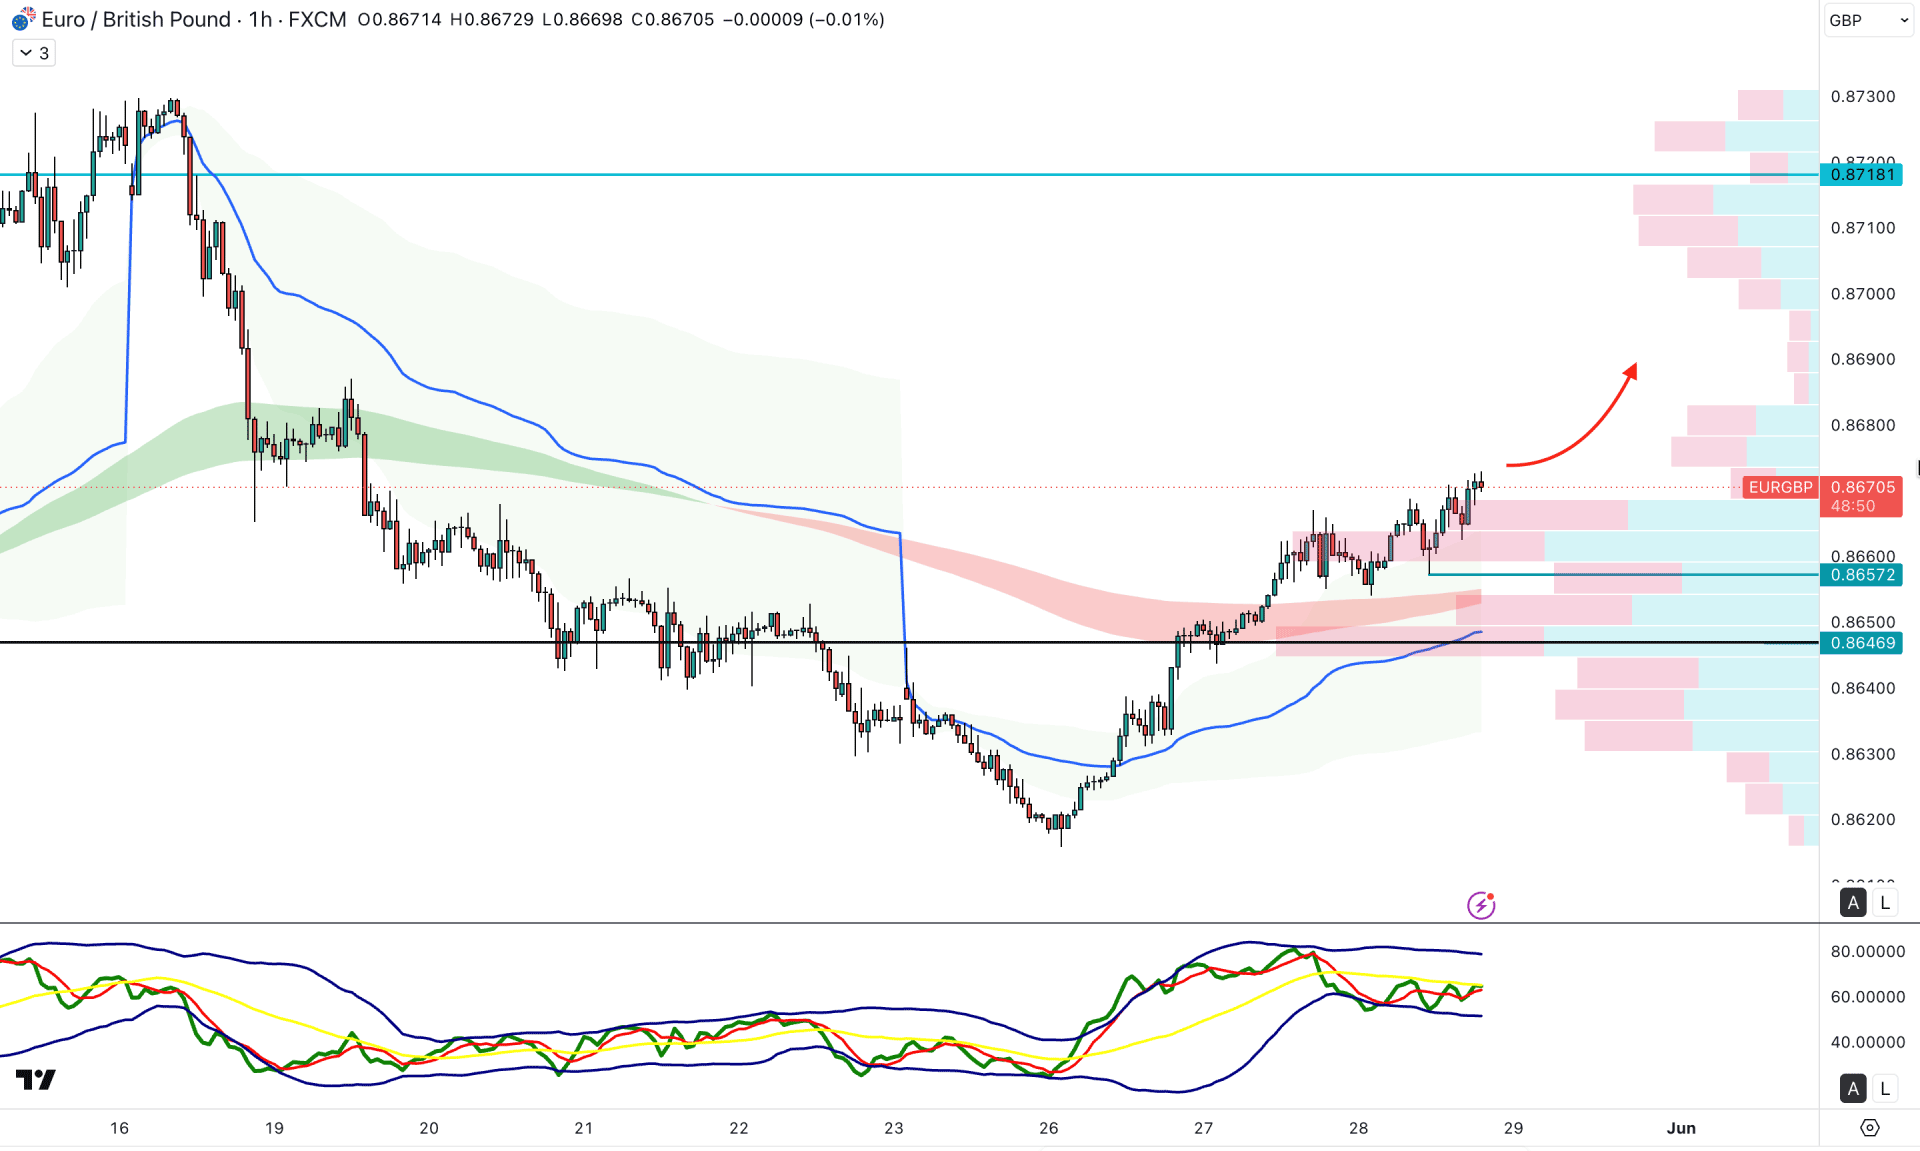
In the hourly timeframe, the price is trading above the high volume line, suggesting an ongoing buying pressure. As a result, multiple higher highs are seen from the current trend, creating a crucial session high.
Due to the active buying pressure, the gap between the current price and the weekly VWAP level has expanded. Moreover, the exponential moving average remains below the current price with a bullish slope. It is a sign of ongoing buying pressure, though a minor downside recovery might be required for upward continuation.
Based on the hourly market structure, the bullish momentum could extend as long as the price remains above the weekly VWAP line. The immediate resistance to look at is the 0.8718 level, which needs to be overcome before heading for the 0.9001 level.
On the bear side, an extended downside pressure with a bearish hourly close below the 0.8646 level could increase the possibility of testing the 0.8620 low.
Overall, EURGBP is trading within a corrective bullish pressure, where the most recent price action is bullish at the daily static support. The intraday buying pressure is bullish with a minor downside momentum pending. A valid intraday bearish pressure with a recovery from the potential support area could be a decent long opportunity.


