
Published: May 18th, 2021
In the Eurozone, the ECB is taking decisions to keep the European economy stable. Some members are optimistic regarding Euro Printing as a part of the Pandemic Emergency Purchase Program (PEPP). Moreover, the COVID-19 infection rate decreases due to the vaccination and social distances that may keep the Eurozone economy stable.
On the other hand, the UK prime minister is concerned about the Indian strain of the virus and economic reopening. However, the recent GDP figure for Q1 brought positive news for the Sterling that may decrease political tension.
Overall, both the UK and Eurozone economies are gaining momentum from the COVID-19 collapse. But, can we consider the UK economy stronger than the Euro? Let’s see the upcoming price direction from the EURGBP technical analysis:
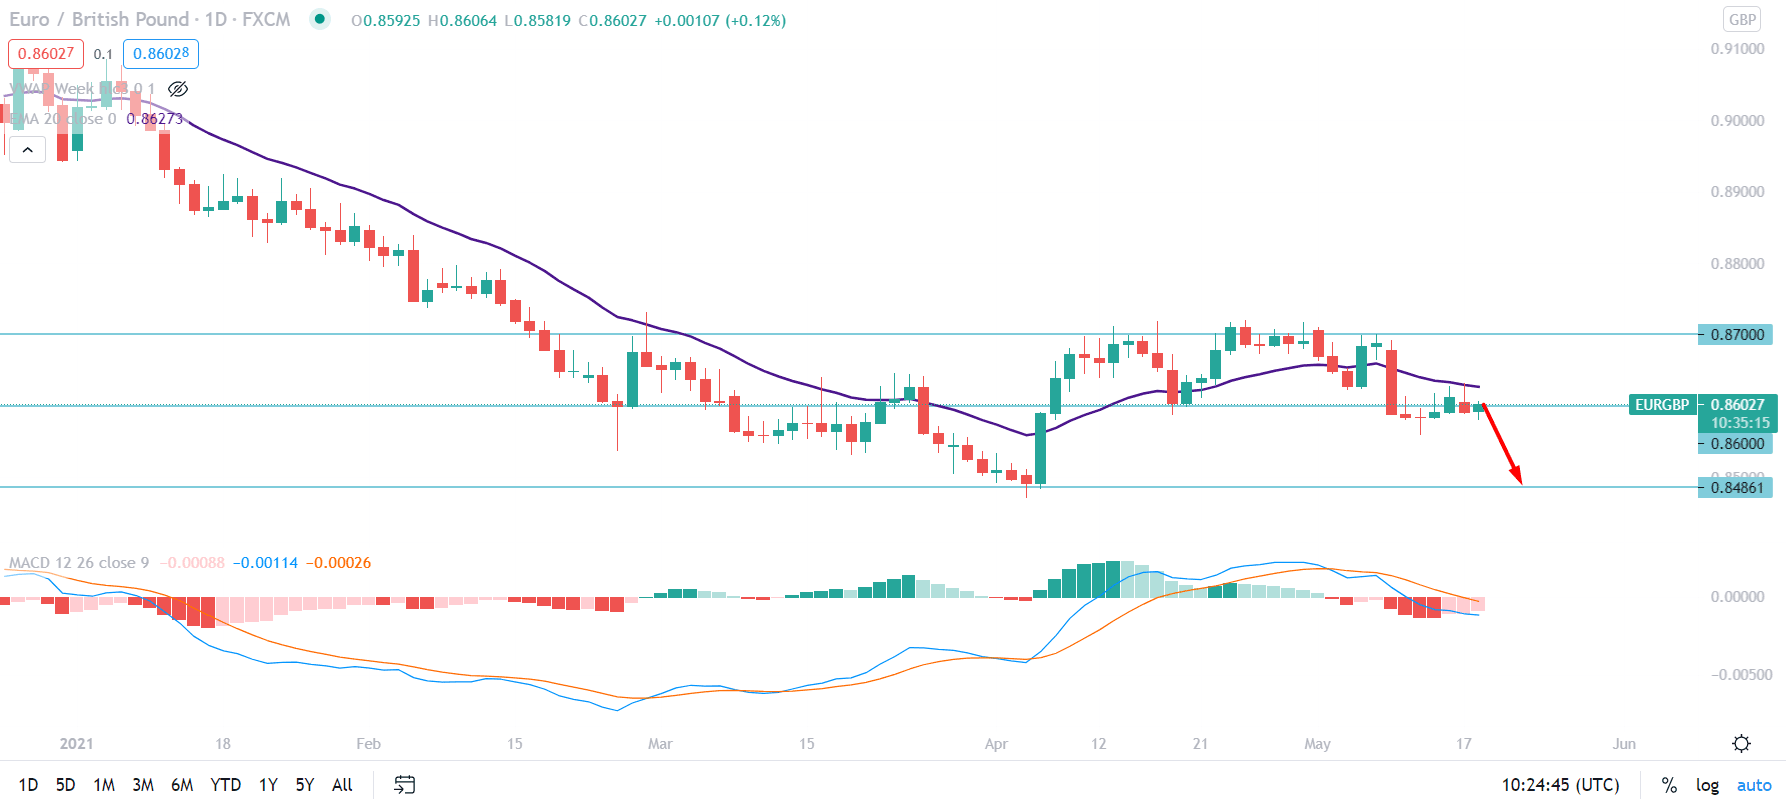
EURGBP is moving lower since the beginning of 2021 where the price bottomed to the 0.8472 level. Later on, the price tried to move higher but failed to get stable above 0.8700 resistance level. Therefore, the price came lower again and currently facing a bearish pressure as soon as the price moved below the 0.8600 level with a daily close.
In the above image, we can see the daily chart of EURGBP where the price tried to get support from the dynamic 20 EMA but failed. As a result, the price broke below the dynamic 20 EMA along with the 0.8600 psychological level with an impulsive bearish pressure.
Therefore, as long as the price is trading below the 0.8600 level, we may expect another bearish leg with the target of 0.8486. Moreover, the MACD is still bearish on the daily chart, and there is no sign of divergence with the price. The MACD Histogram of the last 3 candles was smaller, indicating a correction in the price. Therefore, any strong bearish MACD histogram would indicate further bearishness in the price.
On the other hand, if the price manages to have a daily close above 0.8600 level, the current bearish possibility will be invalid. In that case, the next target level would be 0.8680.
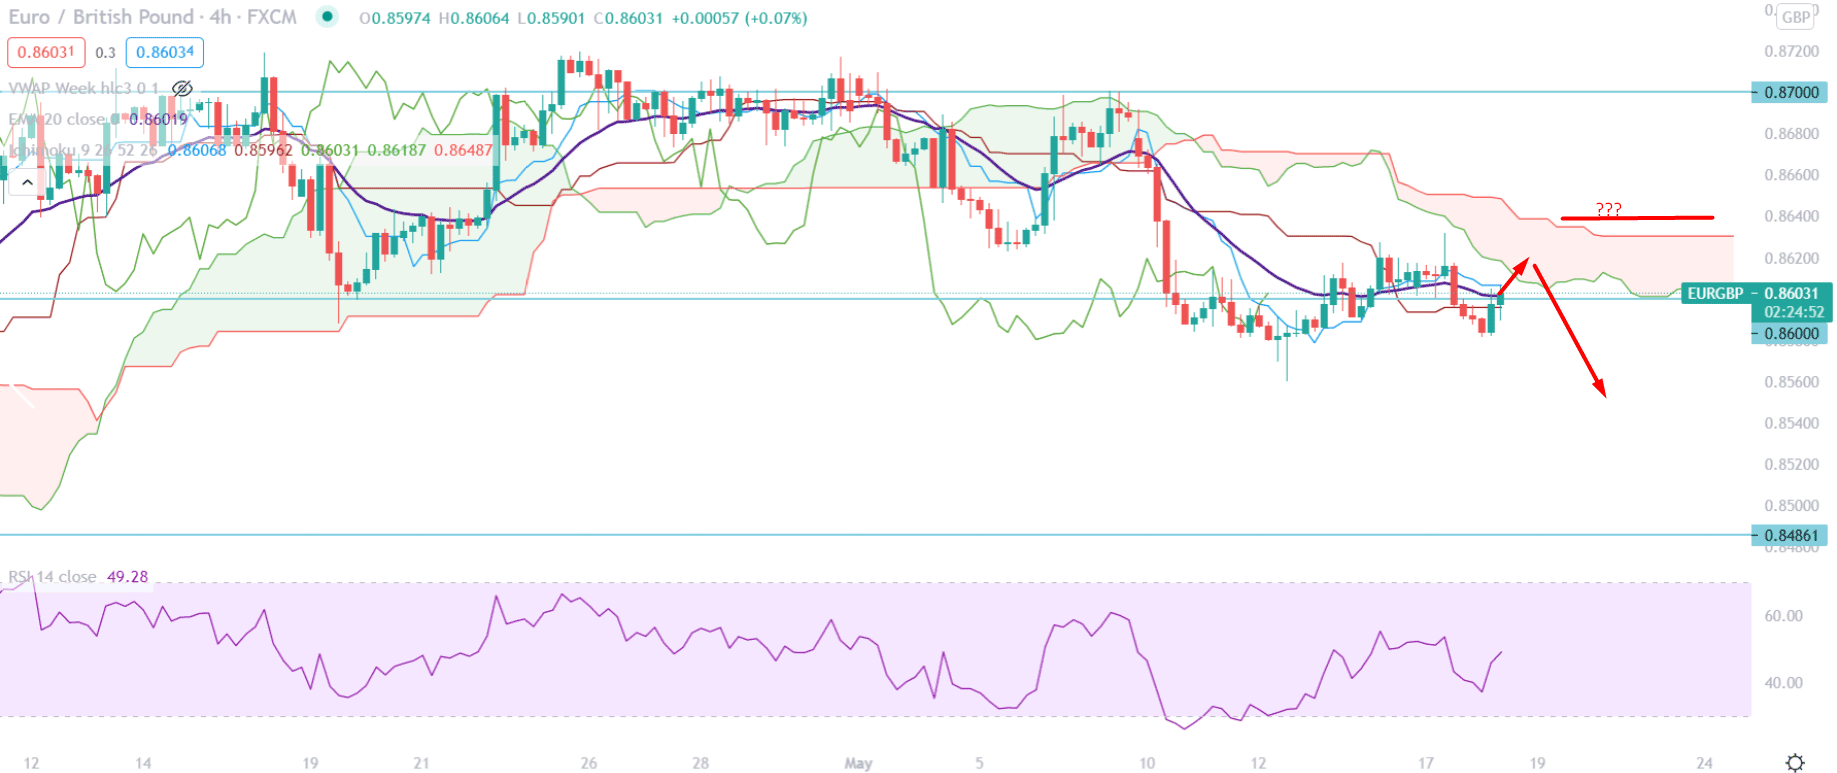
If we implement the Ichimoku Cloud to the H4 chart, we would see that the price was above the Kumo Cloud with extreme corrective momentum. Later on, the price breaks below the Kumo Cloud with an impulsive bearish pressure. Therefore, as long as the price is getting resistance from the Kumo Cloud, it may move lower.
We can see that the price moved below the dynamic Tenkan Sen and Kijun Sen and pointing higher in the above image. Moreover, in the future cloud, Senkou Span A is below the Senkou Span B, which is a sign of active sellers’ in the price.
However, The RSI is moving higher from the 40 levels, indicating that some corrections are still pending. The Chikou Span is still within the price, where any break below the 0.8580 swings low may initiate the bearish movement.
On the other hand, any stable bullish H4 close above the Kumo Cloud may alter the current market structure where the primary target would be 0.8680 level.
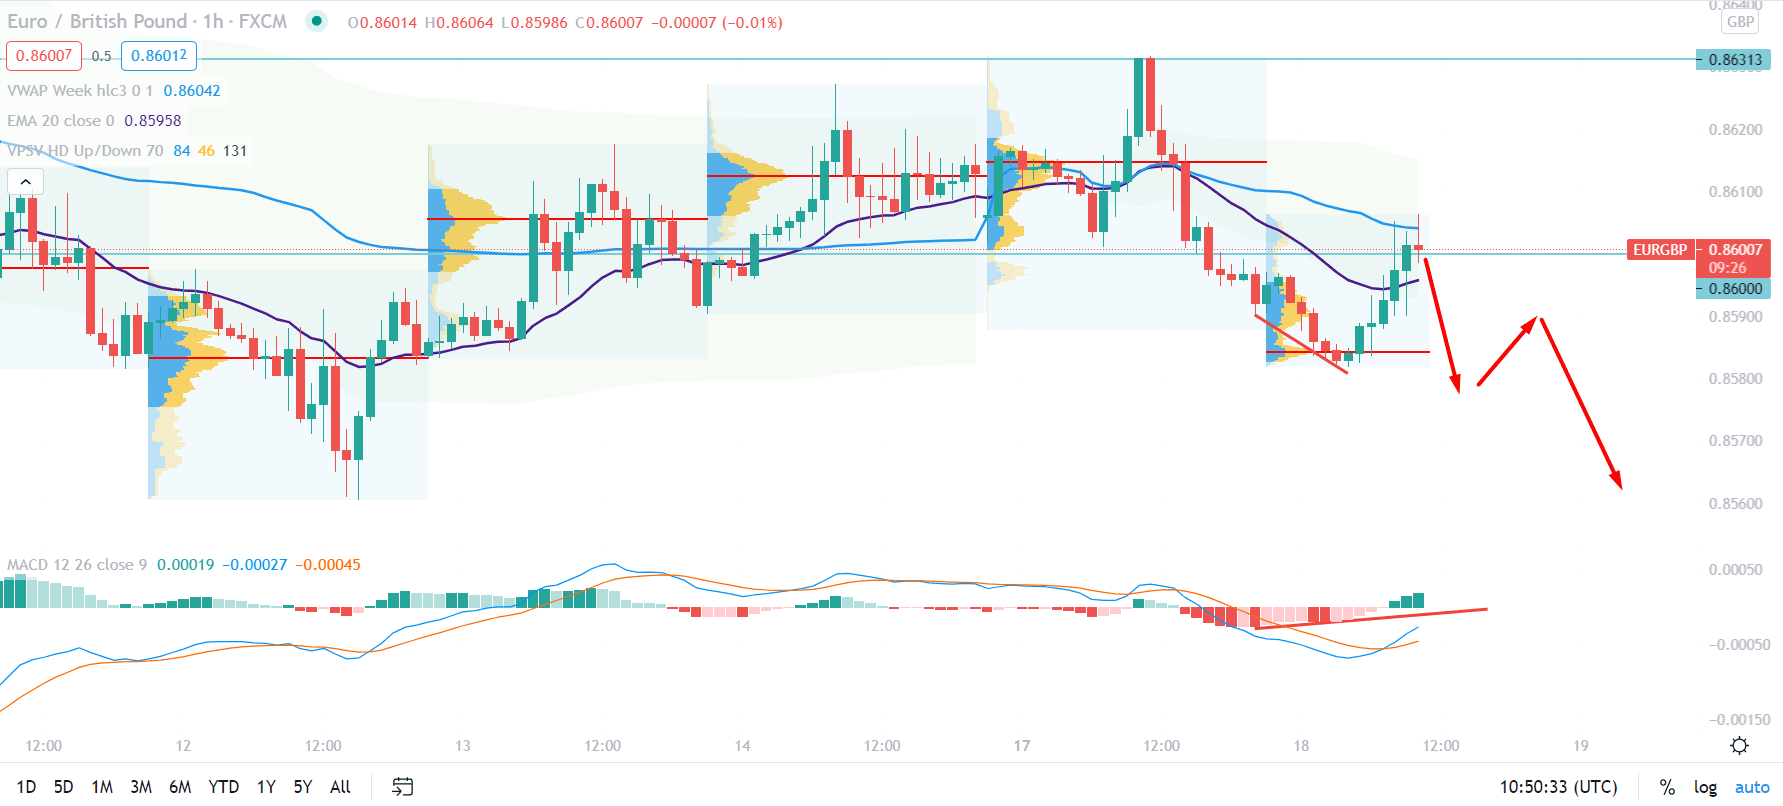
In the intraday H1 chart of GBPUSD, the intraday session volume made a new low after 4 consecutive higher highs. Moreover, the price faces resistance from the dynamic vwap that may increase the bearish possibility in the price.
We can see that the price moved higher in the above image as soon as it tested the intraday high volume level with an H1 close above the Dynamic 20 EMA. Therefore, as long as the price is trading above the dynamic 20 EMA and intraday high volume level of 0.8584, the outlook should be neutral.
Moreover, there is a potential hidden divergence in the price that may increase the correction higher but as long as the price is trading below the 0.8633 high, we may expect that bears’ may regain the momentum. Any strong bullish H1 close above the 0.8633 level may alter the current market structure and take the price higher towards the 0.8680 level.
As per the current observation, EURGBP may move lower if the intraday price comes below the high volume level at 0.8584 level.
On the other hand, any bullish daily close above the 0.8600 level may alter the current market structure that may take the price towards the 0.8688 level.


