
Published: September 13th, 2022
Cable remained steady against the US Dollar, reaching a two-week high before the US open. On the other hand, the same price action was seen in the EURUSD chart.
The buying pressure in GBP came from the recent UK labor report, showing unemployment to reach a multi-year low. Moreover, the weakness in the US Dollar index boosted the buying pressure in EURUSD and GBPUSD prices, where the recent consolidation at the key resistance would decide who will win from the EURGBP price.
The Office for National Statistics (ONS) released the labor market figure for the UK. The low unemployment, higher wage growth, and low labor force participation rate would be the main reasons for considering the GBP weaker than other major currencies.
On the other hand, the Euro saw downbeat data from the German CPI, rising 7.9% in August from 7.5% in July. Investors are keen to see the UK inflation report due on Wednesday, where a further increase would be a bullish sign for the EURGBP price.
Let’s see the future price direction of EURGBP from the EURGBP Technical analysis:
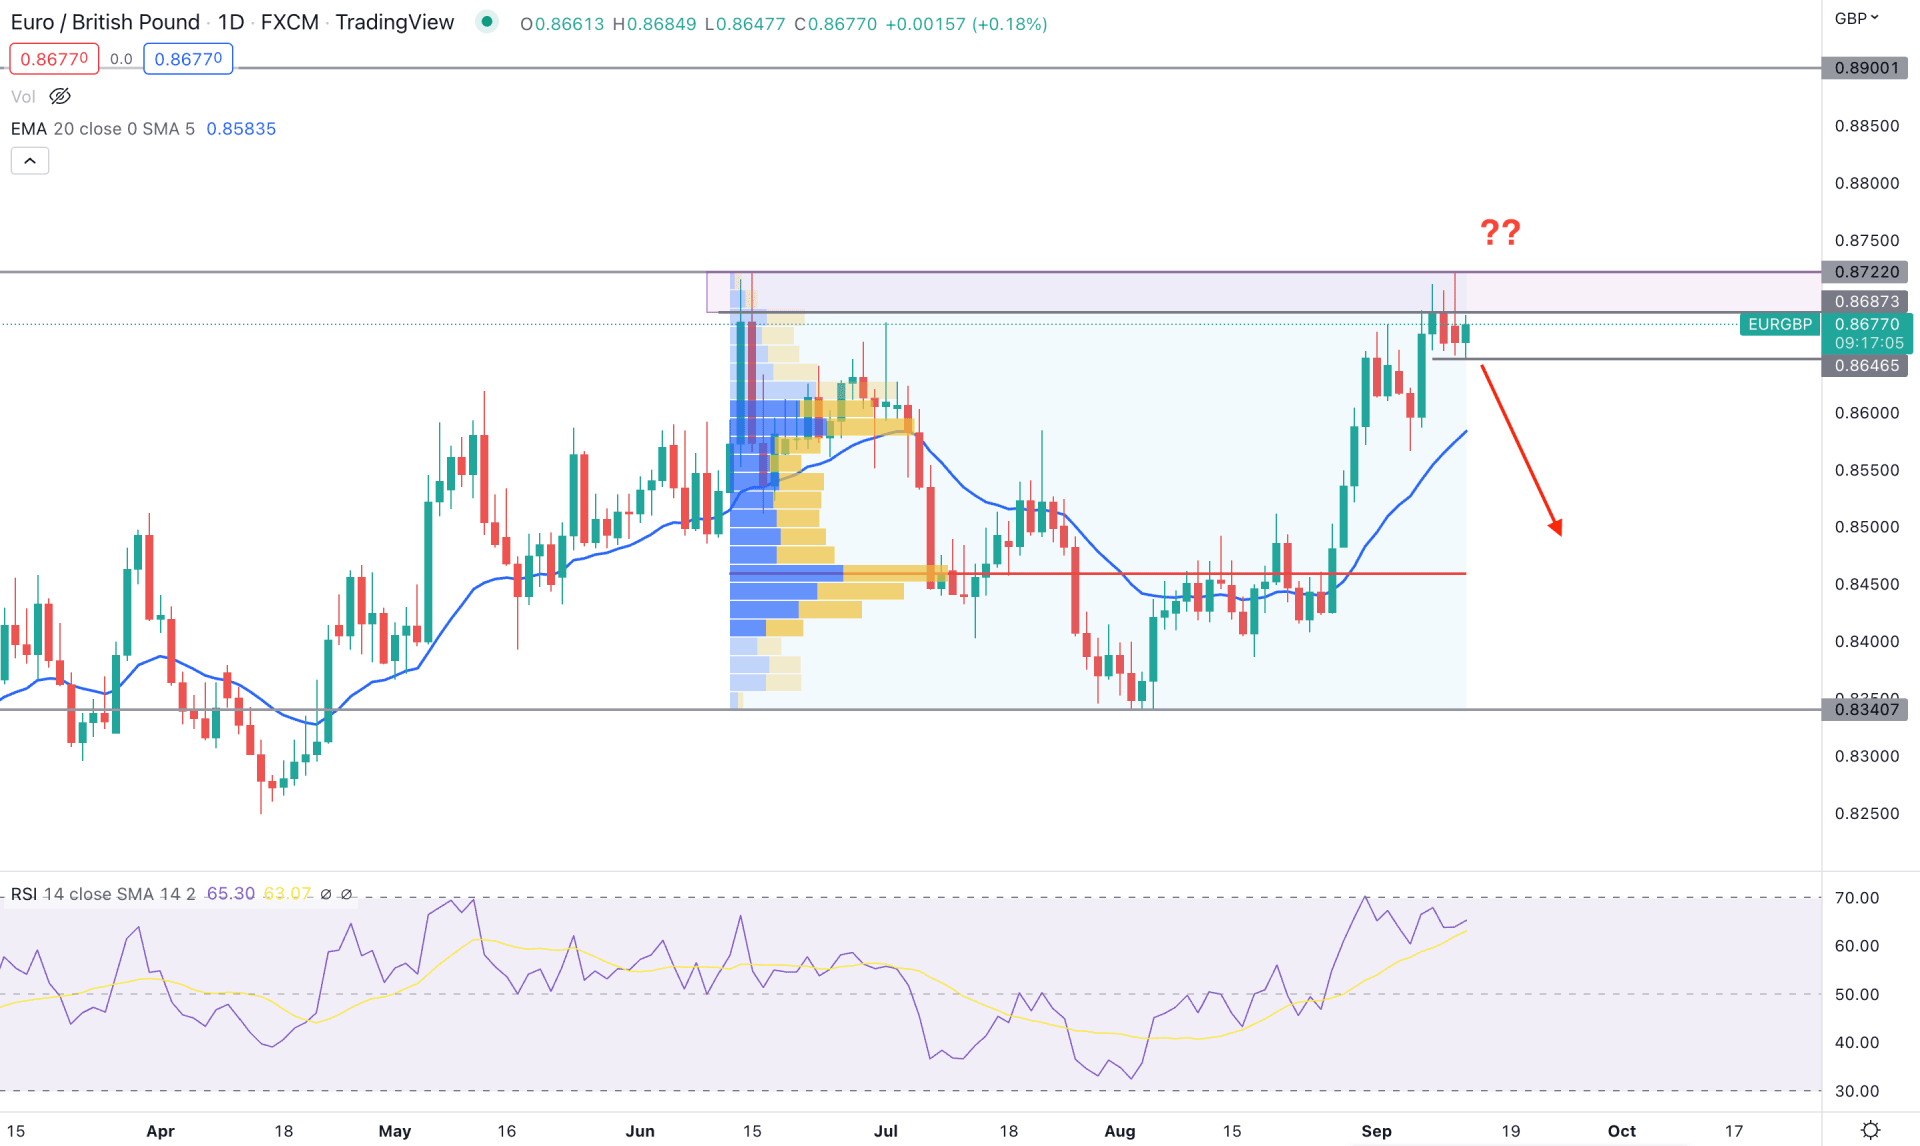
In the EURGBP daily chart, the recent bullish recovery from the 0.8340 support level came with strong buyers’ support. The highest trading volume from June 2022 high to the August 2022 low was found at the 0.8460 level during the bull run that came from the 0.8340 low.
As a result, it is clearly visible that the current buying pressure came with a solid momentum with no significant sellers’ activity after reaching the 0.8722 resistance level. The dynamic 20 EMA is below the price, indicating a minor bearish correction, while the RSI reached the 70% overbought level.
Therefore, based on the current price structure, the primary aim of this pair is bullish, with a breakout above the 0.8722 level and a daily close. In that case, the buying pressure may extend towards the 0.8900 key resistance level.
However, investors should clearly monitor how the price trades at the 0.8722 to 0.8687 supply area from where a selling pressure and a bearish daily close below the 0.8646 near-term swing low would open a bearish opportunity toward the 0.8460 high volume level.
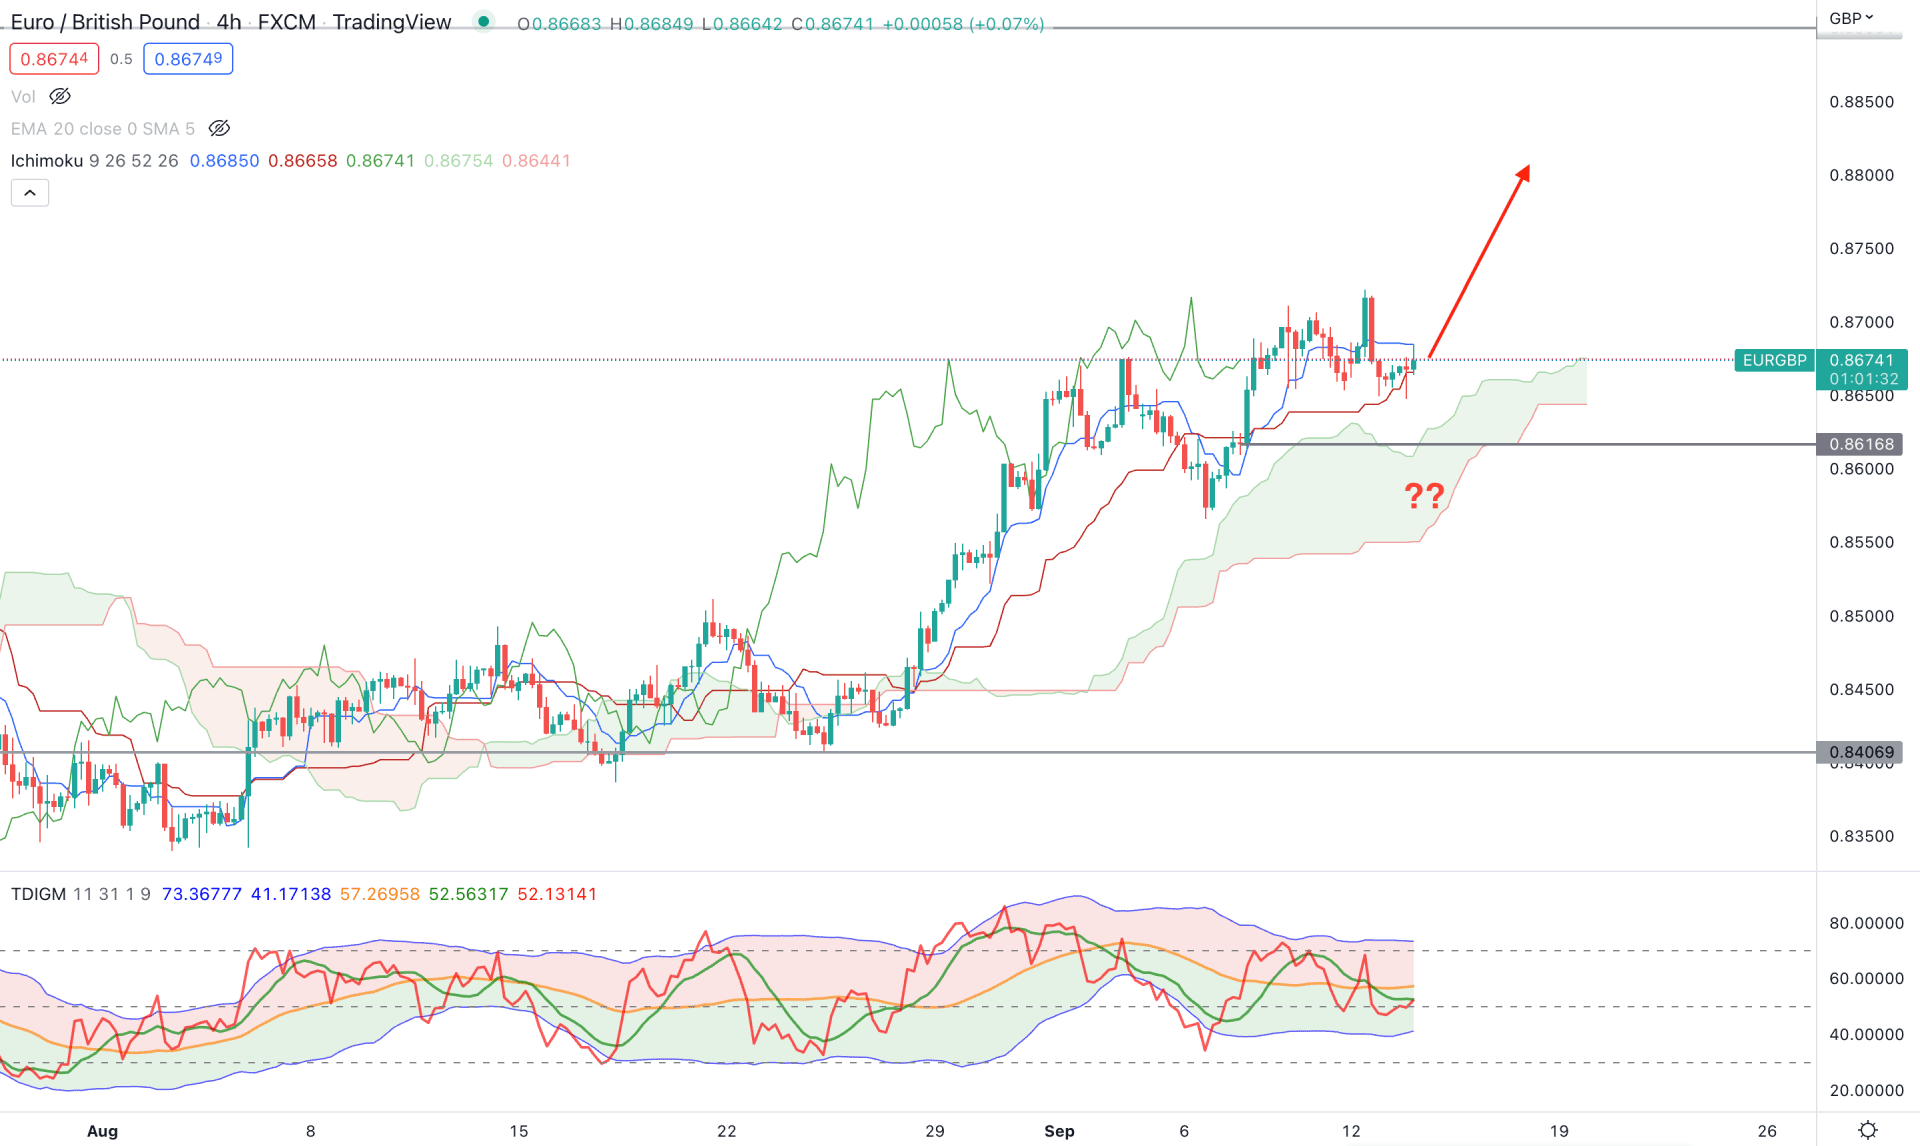
In the H4 timeframe, the buying pressure is clearly visible where the recent price is stable above the dynamic Kumo Cloud support. Moreover, the future cloud is supportive of bulls, where the Senkou Span B is flat, and Senkou Span A is a steady upside.
The indicator window shows how the buying pressure is potent from the Traders Dynamic Index indicator, where the current TDI level is still at the 50% area. It indicates that bulls have more room to take the price up following the bullish price action. The dynamic Tenkan Sen and Kijun Sen are still below the price from where any bullish rejection might come.
Based on the H4 EURGBP bullish factor, any buying sign with a bullish rejection from the dynamic Kijun Sen would open a pong opportunity towards the 0.8900 resistance level. On the other hand, the break below the 0.8616 level with strong selling pressure would indicate a cloud breakout, which could result in a consolidation before aiming lower toward the 0.8400 level.
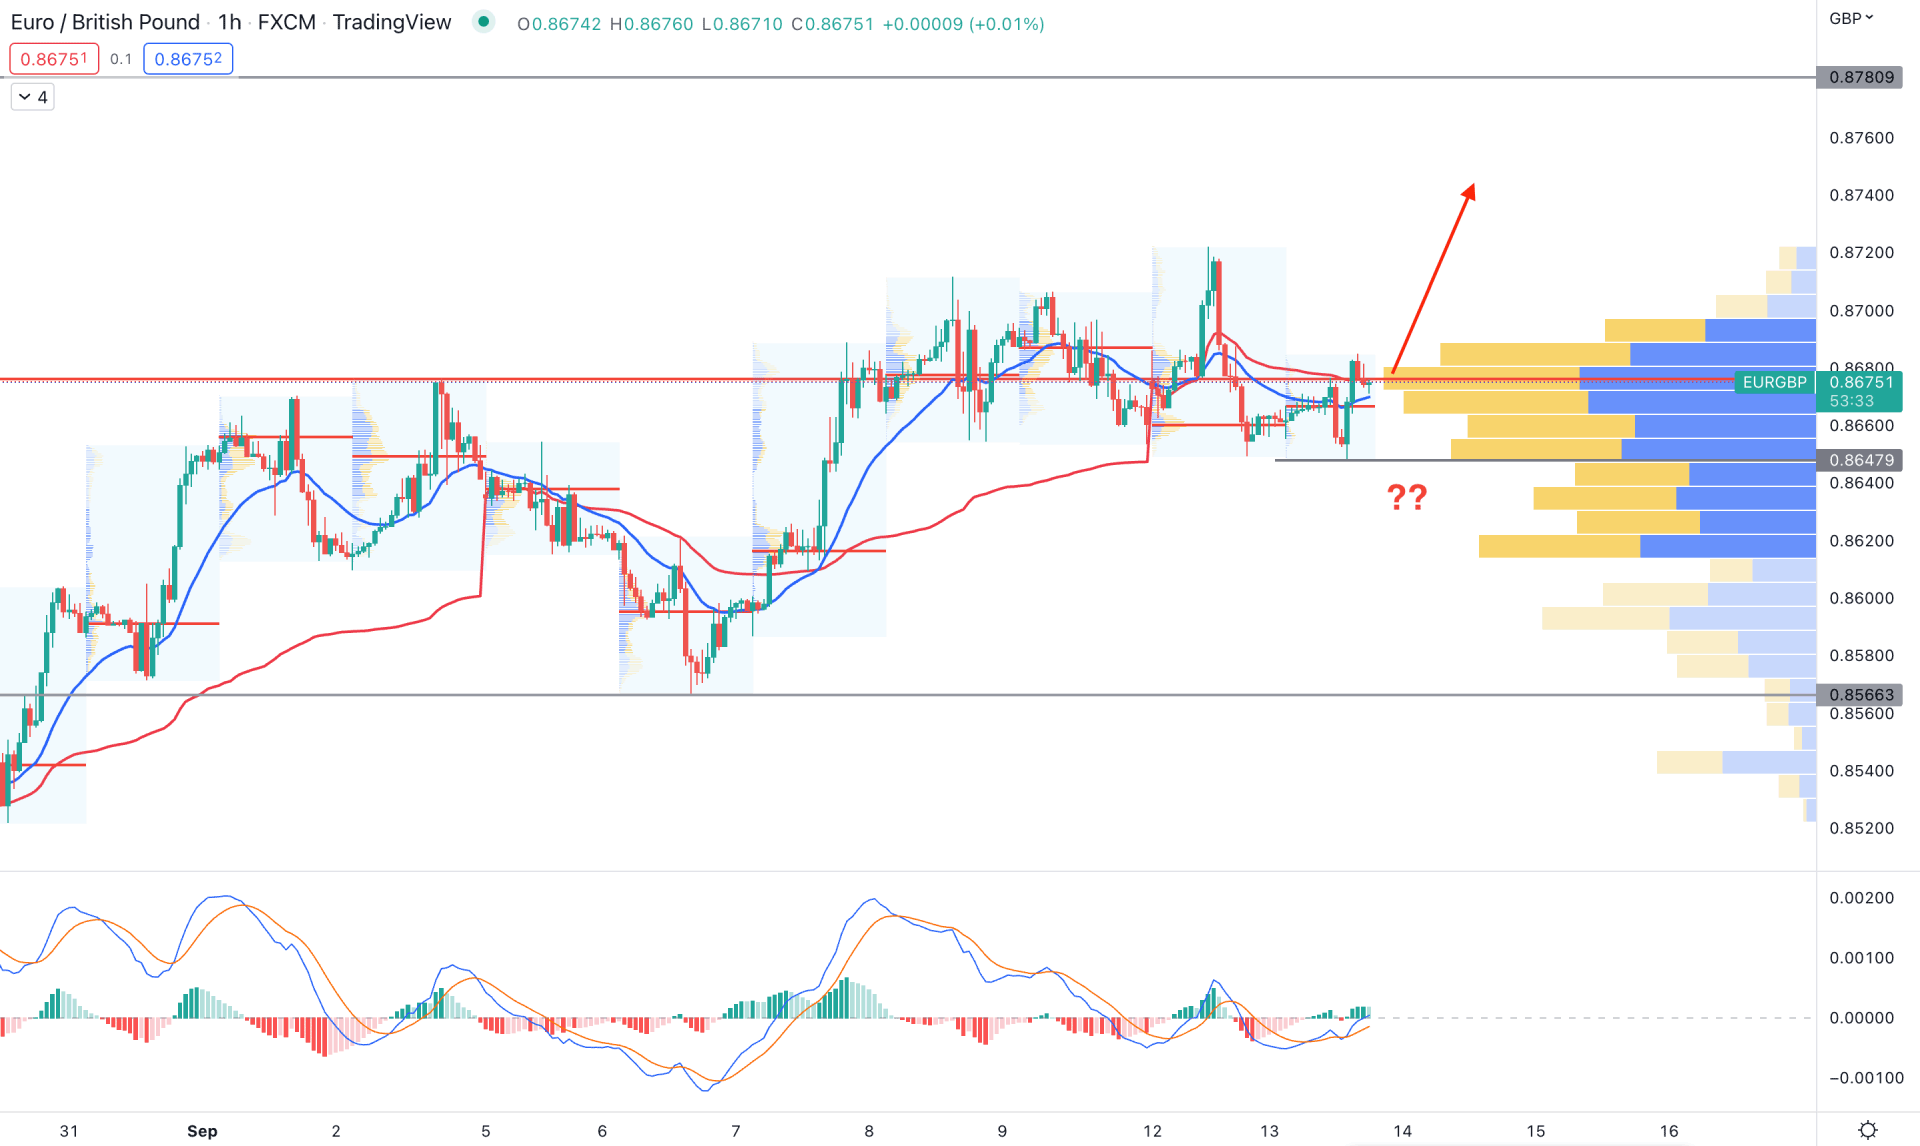
In the EURGBP intraday H1 chart, the broader market context is bullish as the current price steadily increases by creating higher highs. Moreover, the recent false break below the dynamic 20 EMA and recovery with strong volume support could hint at a bullish opportunity towards the 0.8780 resistance level.
According to the visible range high volume indicator, the highest trading volume in the H1 chart is at the 0.8680 level, which is slightly above the current price. Moreover, the latest intraday high volume level is below the price and shows buyers' interest in the market. The dynamic 20 EMA is the immediate support from which bulls may regain momentum.
Based on the H1 chart, any bullish rejection from dynamic 20 EMA and weekly VWAP would be a bullish opportunity towards the 0.8780 level in this pair. On the other hand, breaking below the 0.8647 level with a bearish H1 candle could open a short opportunity where the main aim is to test the 0.8566 level.
Based on the current multi-timeframe analysis, EURGBP is more likely to extend the bullish pressure, where a bullish breakout above the 0.8722 level would be the trigger point. On the other hand, the selling pressure from the current daily supply zone should come below the 0.8648 level to consider it a valid double top pattern breakout.


