Published: November 7th, 2024
Trump's tariffs have caused Europe's development to stall, and Euronews reports that the European Central Bank (ECB) could be compelled to act quickly, possibly lowering interest rates to almost zero by 2025. The market anticipates that in December, the ECB will reduce the Deposit Facility Rate by the usual 25 basis points (bps).
This week's EU-based data on markets could be more extensive. The summit of EU leaders ends on Friday, and the release of the pan-EU sales at retail figures is planned for Thursday. On Saturday, ECB President Lagarde is scheduled to make a follow-up visit.
Due to reducing inflation, the Bank of England (BoE) lowered the interest rates for the second consecutive time this year. However, UK Finance Minister Rachel Reeves's first budget aimed to increase inflation and lead to a slower rate cut by the BoE, which would provide some support for the GBP.
Let's see the further outlook of this pair from the EURGBP technical analysis:

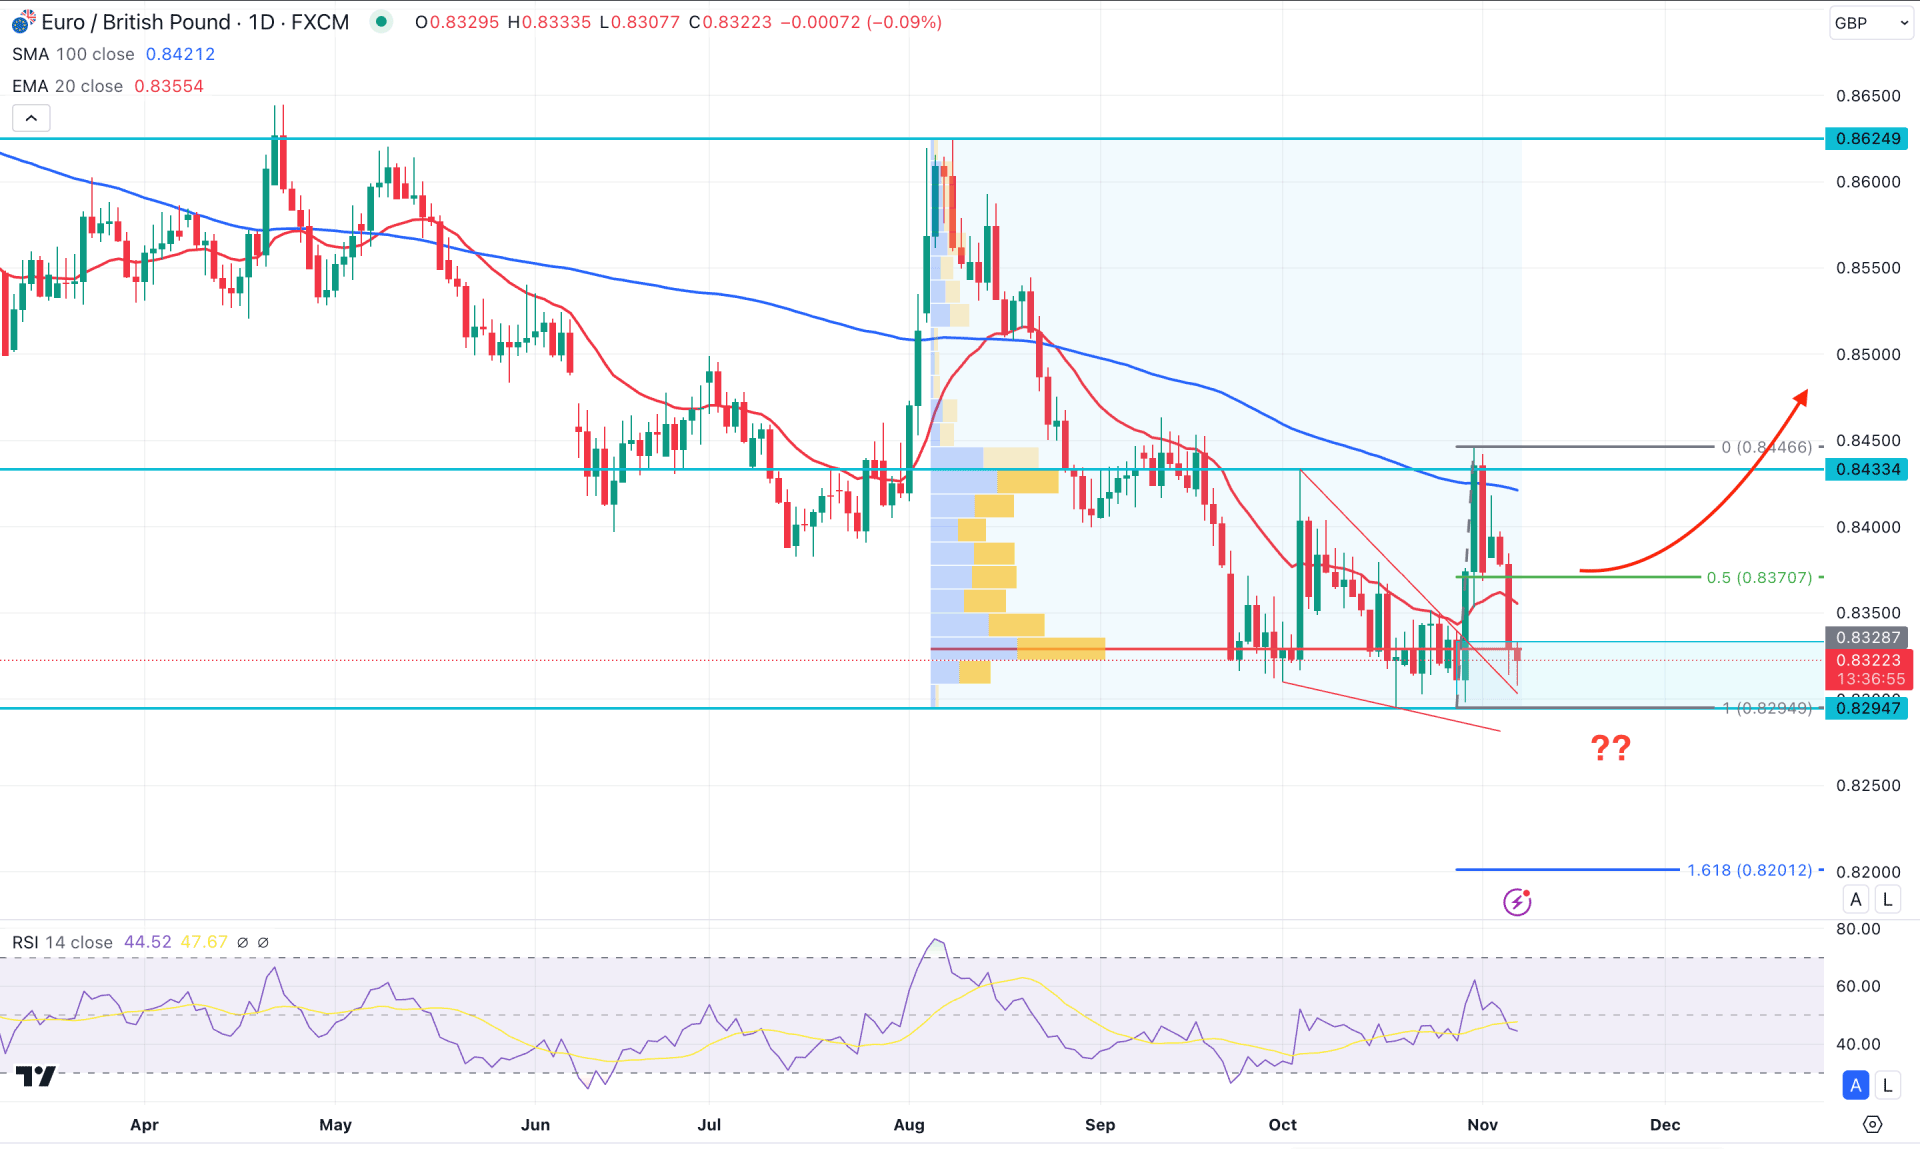
In the daily chart of EURGBP, the price is trading within a bearish trend, where the most recent price trades closer to the yearly low.
In the higher timeframe, the October close came with a bullish engulfing pattern, where the recent price failed to overcome the crucial monthly high of 0.8433 level. The ongoing price action is bearish, where a bullish trend reversal might come after overcoming the Engulfing high.
In the volume structure, the highest volume since August 2024 is within the recent bullish order block. Investors should closely monitor how the price trades at the bottom, as a valid bullish reversal from the high volume line could signal institutions' involvement on the buyers' side.
Looking at the main price chart, the recent price showed a strong bullish reversal from a falling wedge. Moreover, a bullish break of structure is visible above the 0.8433 high, creating an additional bullish signal. However, the price failed to hold the buying pressure above the 100 day SMA line and moved below the 50 day EMA line.
Based on this outlook, the bullish break and a retest from the wedge support might create a potential long opportunity. In that case, the conservative buying approach would come after overcoming the dynamic 50-day EMA line.
On the upside, the 100 day SMA would be the primary target level but breaking above the 0.8400 psychological line could extend the momentum above the 0.8466 level.
On the bearish side, the buy-side liquidity swept from the 0.8433 high creating an immediate bearish reversal, which might result in a bearish continuation. Before opening a short position, a bearish daily candle below the 0.8494 level could signal a new yearly low, aiming for the 0.8200 level.

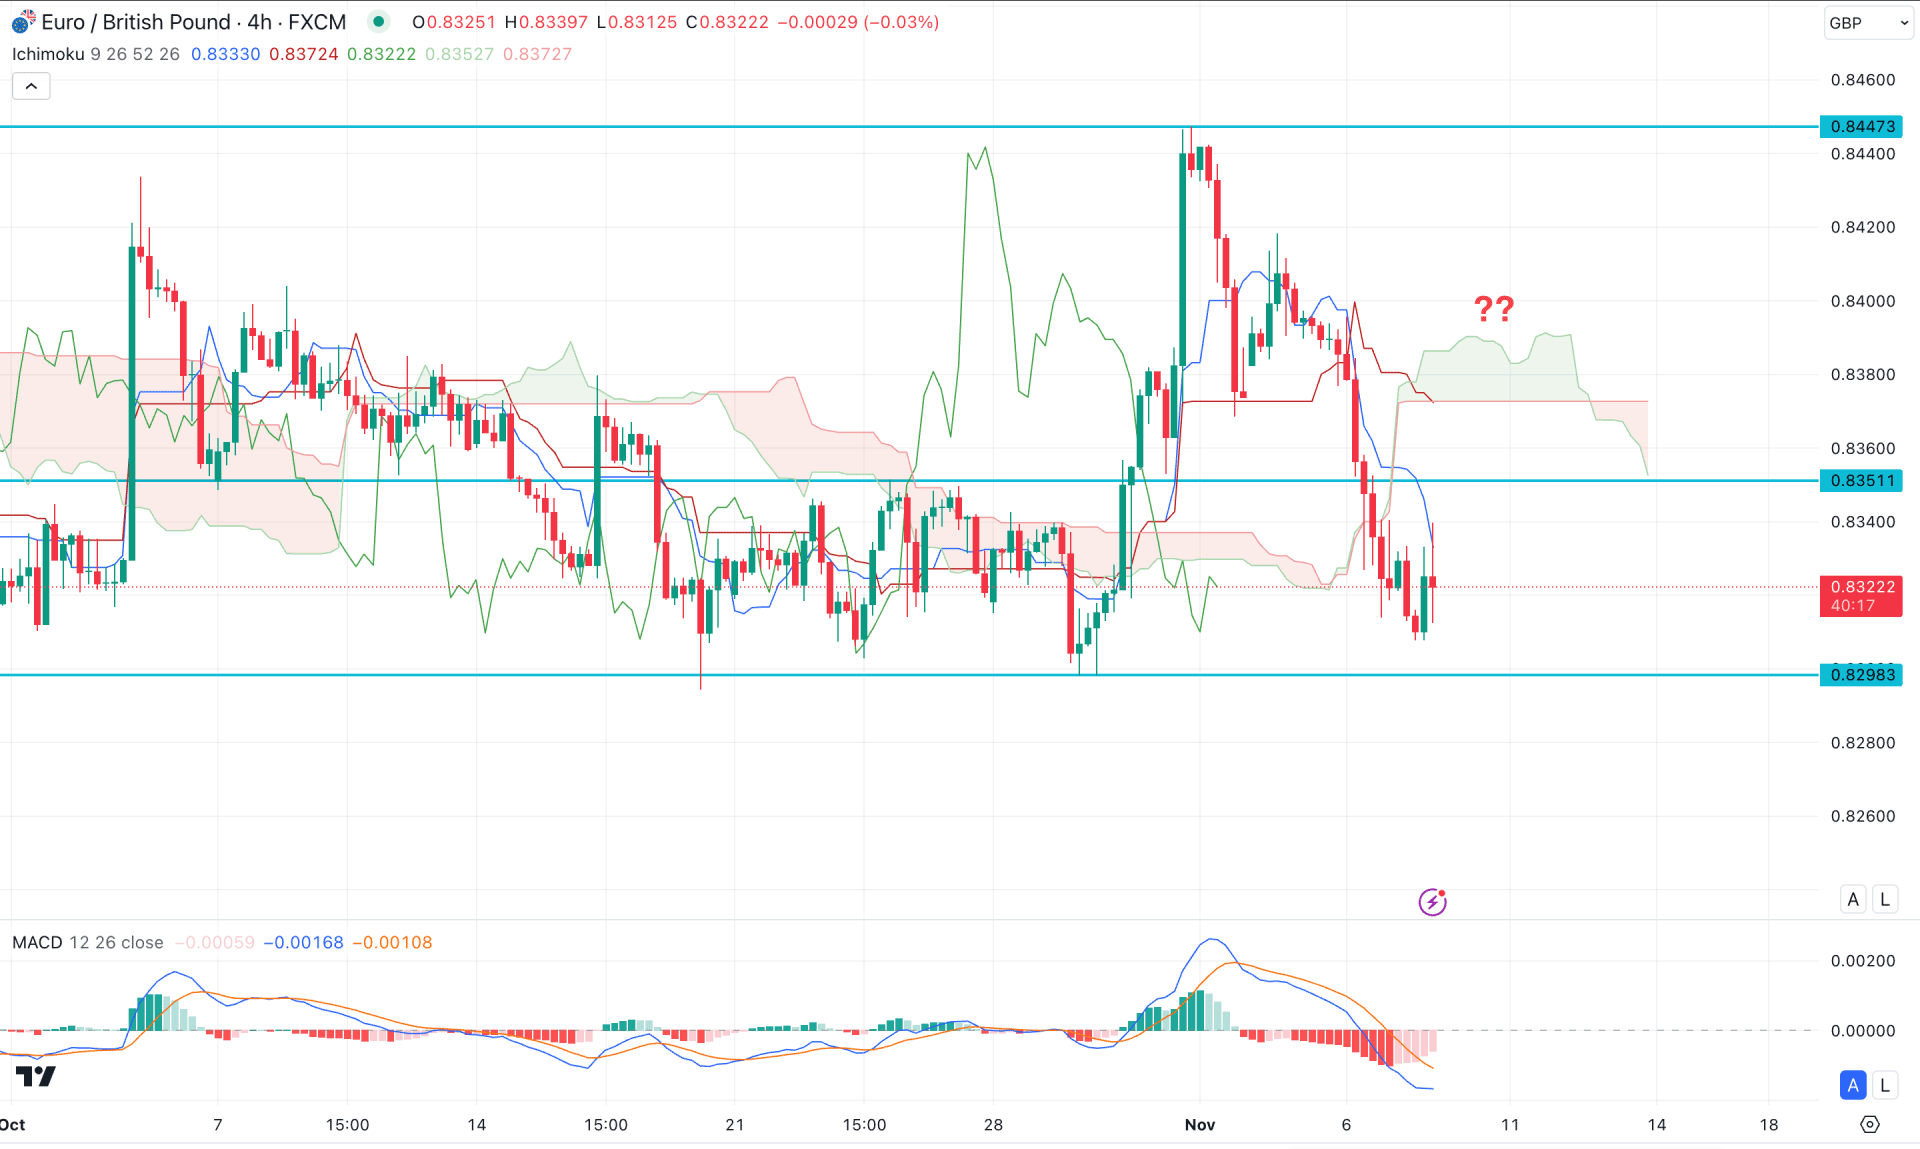
In the H4 timeframe, the ongoing market momentum is indecisive, where the most recent price showed a failure to bulls to hold the momentum above the Kumo Cloud zone.
Primarily a bullish range breakout from the 0.8351 high with an immediate bearish reversal below the line signals a potential downside continuation signal. Moreover, the MACD Histogram remains below the neutral position, suggesting a potential bearish pressure.
Based on the current market outlook, investors should monitor how the price trades at the 0.8351 to 0.8298 zone. A bearish continuation with a bearish reversal from the range top could extend the selling pressure below the 0.8200 area.

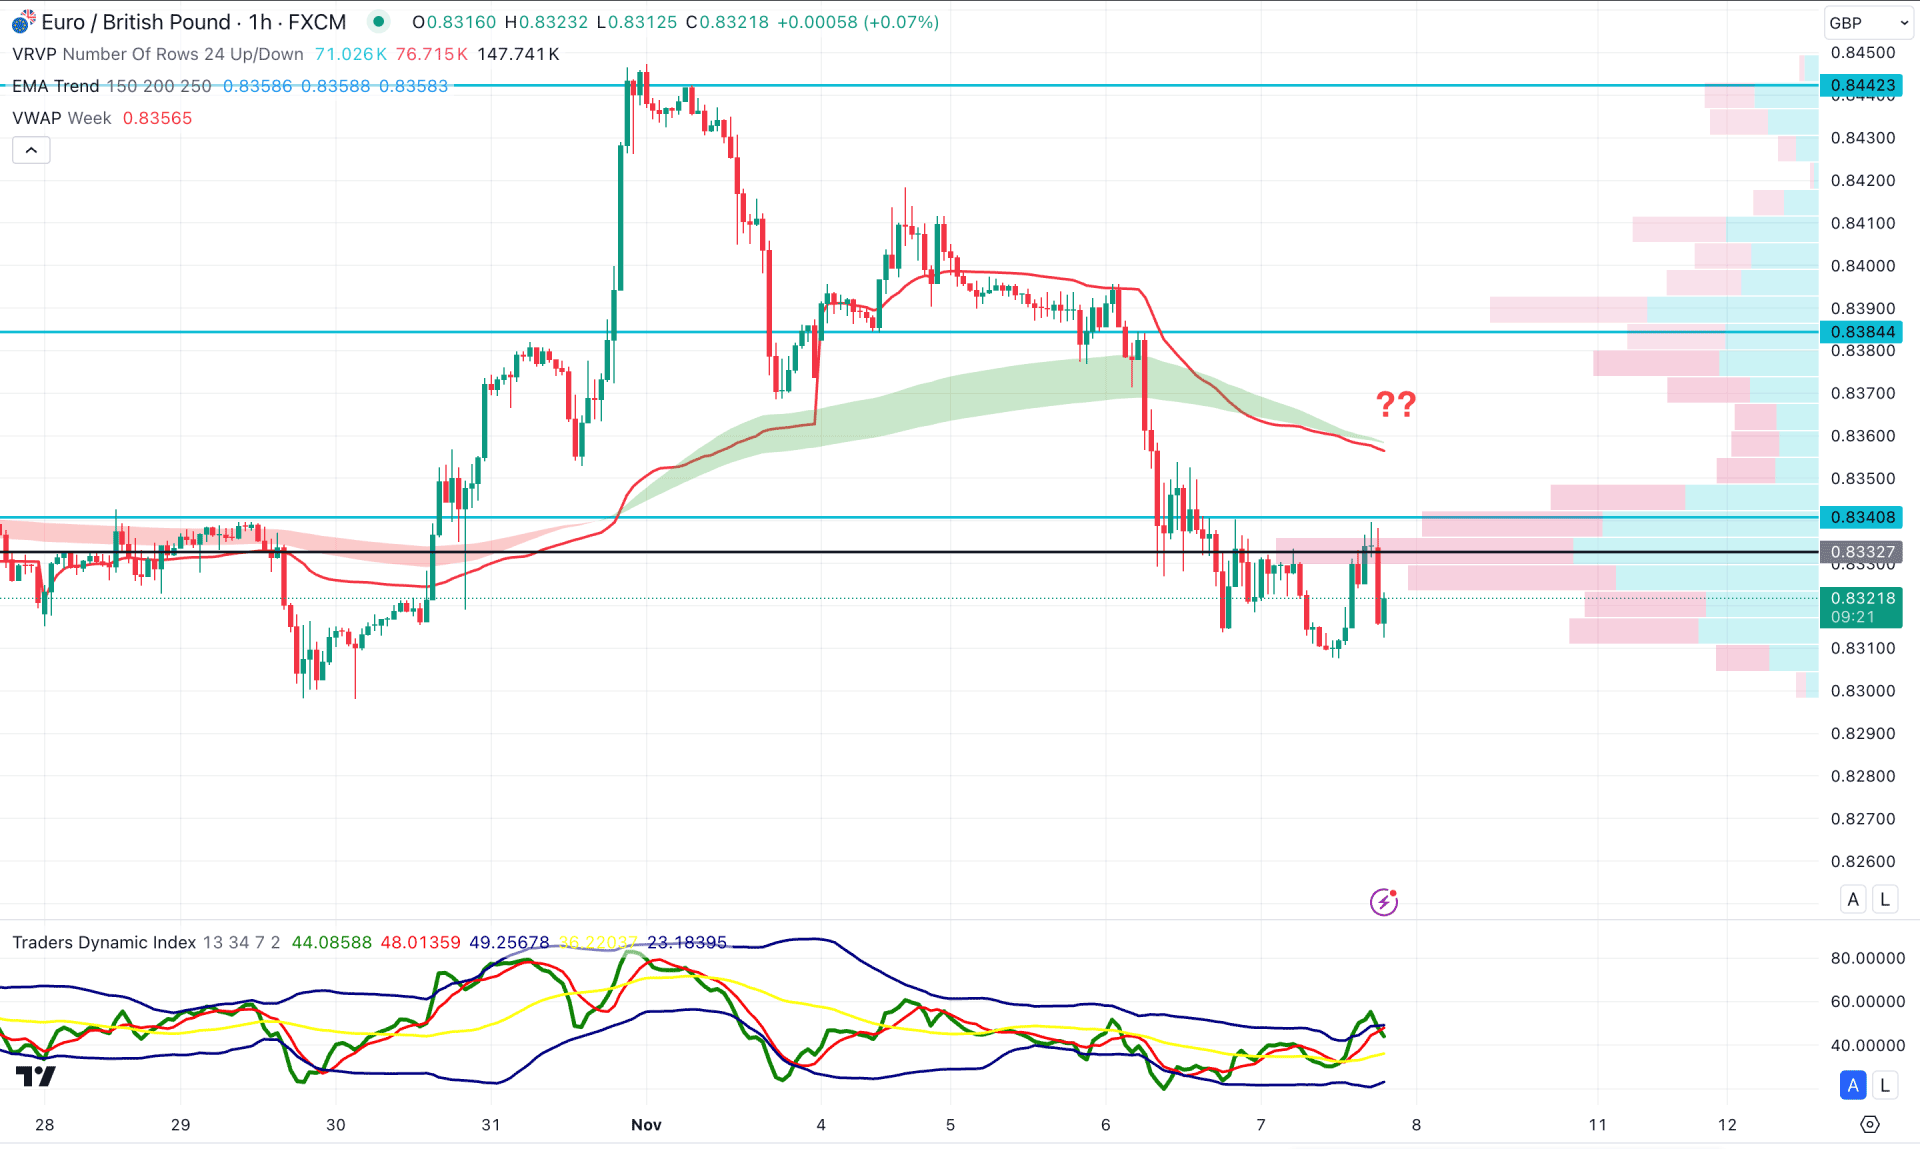
In the H1 timeframe, the recent price showed a selling pressure from the 0.8332 high volume line, suggesting an ongoing selling pressure. Moreover, the Moving Average wave is above the current price, working as a major resistance.
In the indicator window, the Traders Dynamic Index (TDI) reached a peak and formed a bearish reversal. Meanwhile, the weekly VWAP line is above the 0.8340 double top level, working as a crucial resistance.
Based on the hourly outlook, the ongoing selling pressure is more likely to lower the price in the coming hours. However, any buying pressure above the 0.8340 line could eliminate the correct outlook at any time.
The EURGBP bulls can enter into the market as the pair offers a discounted price from the yearly low. However, the intraday price is still bearish from where an invalidation of the bearish continuation is needed before opening a long position.