
Published: July 19th, 2022
The Eurozone ZEW survey for July showed a cruel number, falling to -45.8 from -27.5 in the previous month. The weaker ZEW report came from higher energy prices, ECB rate hikes, Ukraine-Russia wars, and supply chain constraints in China.
One of the prominent inflation gauges, forward-looking 5y swaps, moved below the 2% level for the first time since March 2022, indicating the fear of slowing growth in the market. Moreover, the political uncertainty in Italy led the Italian government's minds to move higher. As a result, the spread between Italian and German government bonds widened, indicating a fear of fragmentation in the Eurozone bond markets.
This week is essential for the Euro as the ECB meeting pay shows a 25 bps rate hike after the July PMI report, which will be the first rate hike in over a decade. The BOE Governor Bailey also showed interest in a 25 bps rate hike in August, whose main aim is to act forcefully on the recession fear. In addition, investors will see employment and preliminary July PMI numbers. However, the primary attention will be on the CPI inflation report, which may come at 9.3%, above the previous report of 9.0%.
The coming trading days will be eventful for the EURGBP pair, which may provide a decent trading opportunity. Let’s see the future price direction of EURGBP from the EURGBP Technical analysis:
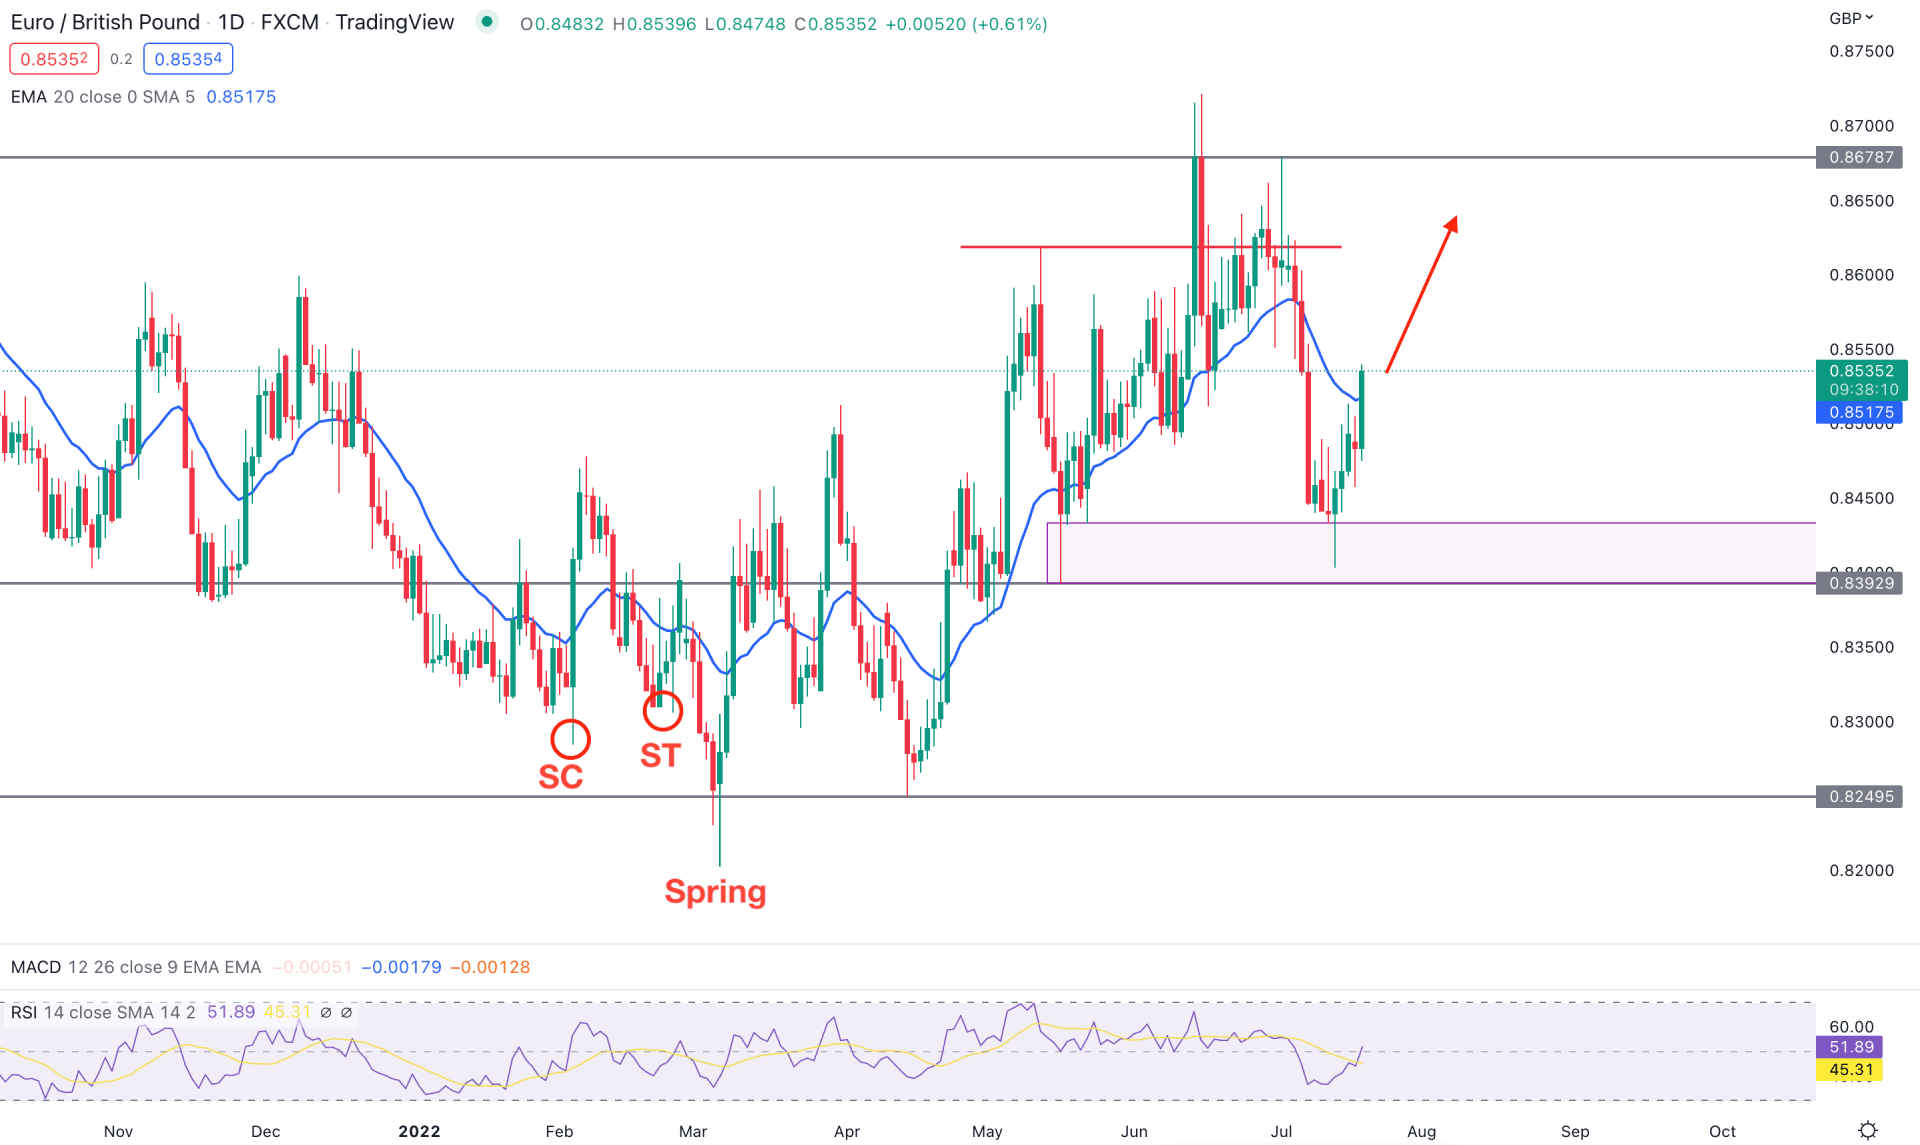
The EURGBP daily chart shows a sign of Wyckoff accumulation. In the Spring section, below the 0.8249 level, the price exhausted and grabbed sell-side liquidity with an immediate rebound. Later, the price corrected lower but left the low untouched. As a result, the price formed the 0.8433 to 0.8392 areas as a valid demand zone from where the current buying pressure appeared.
The indicator window shows buyers' presence in the market, as the Relative Strength Index moved above the 50.00 level and is currently moving up towards the 80.00 area. The near-term resistance level is a dynamic 20-day moving average, which is also taken out today where close attention to the daily close is important.
Based on the daily structure, investors should consider the ultimate price target at the 0.8678 level as long as it trades above the dynamic 20-day moving average. On the other hand, a sharp rebound and a daily close below the 20 EMA could influence bears to test the 0.8433 to 0.8392 demand zone before showing further bullish signs.
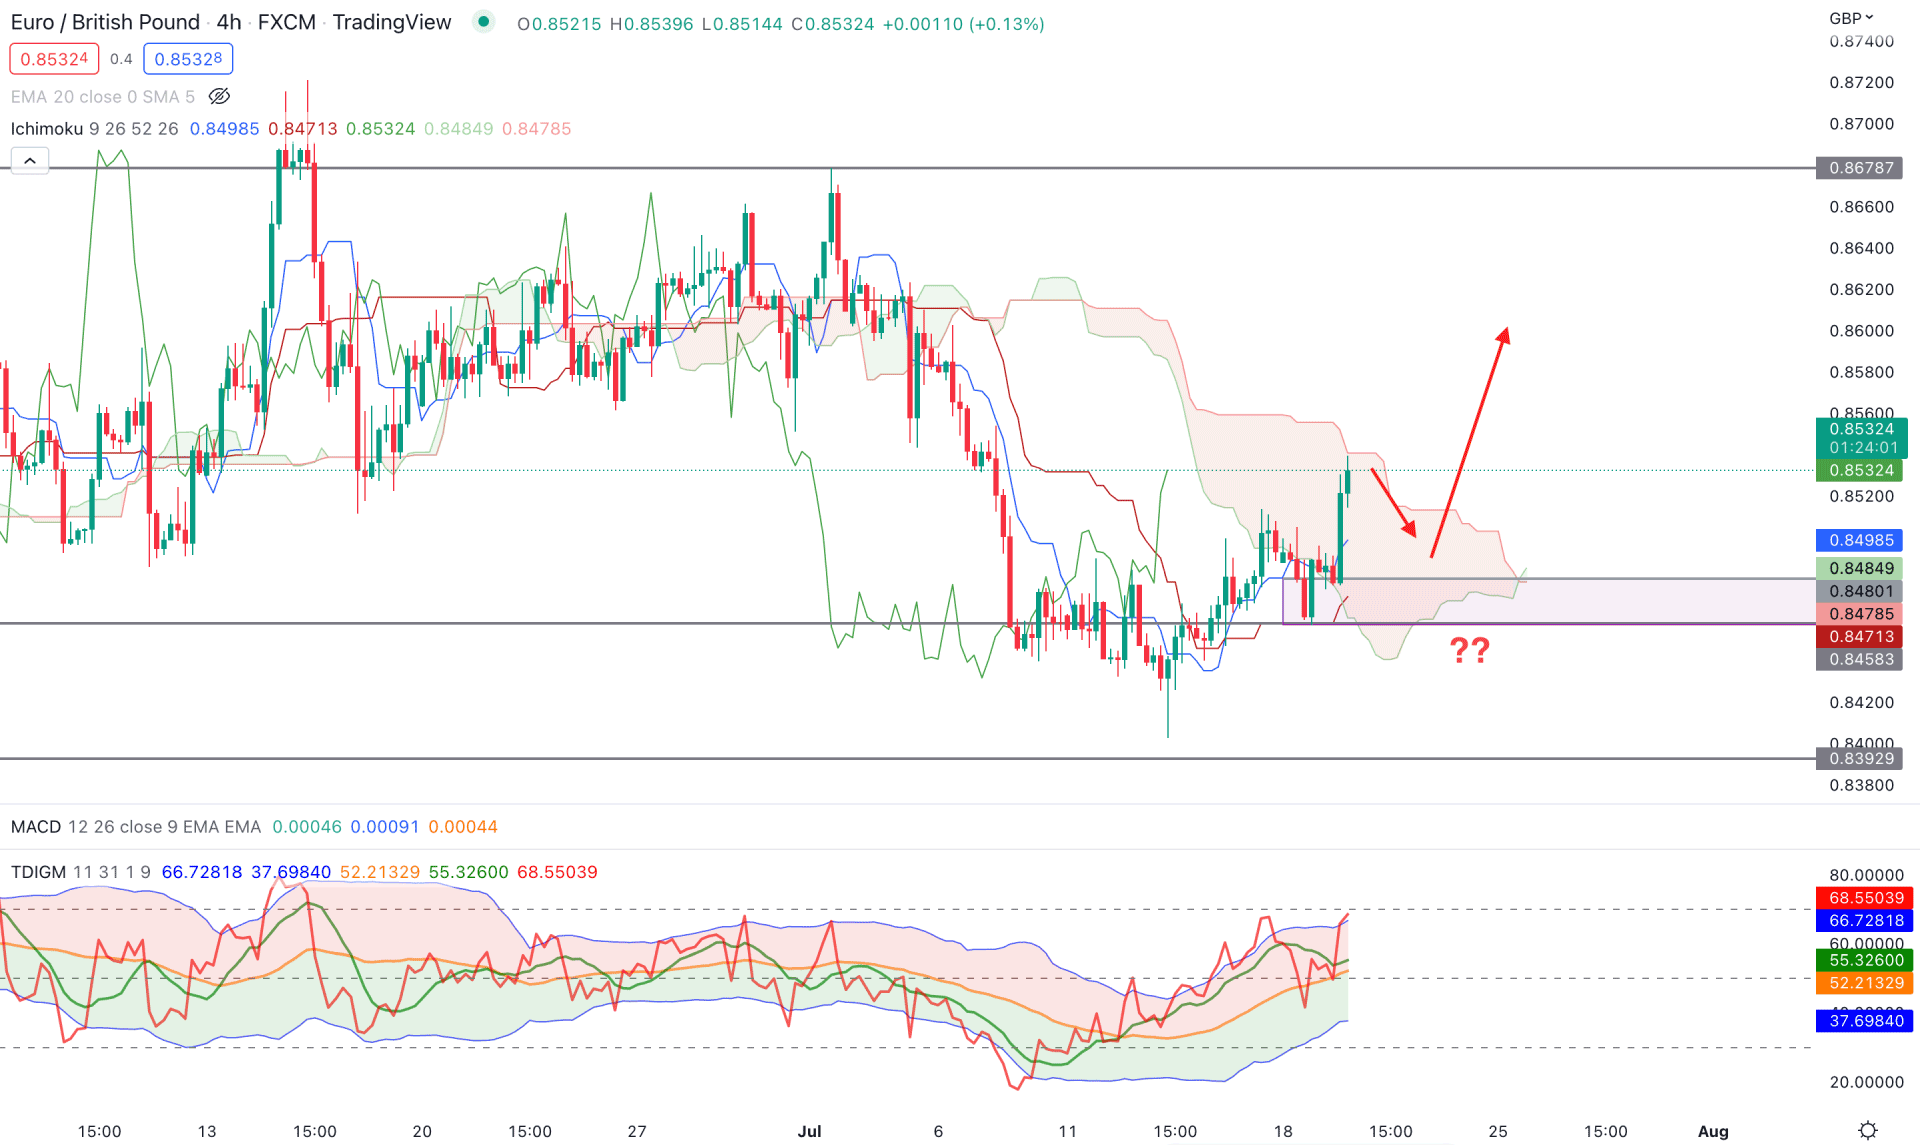
In the Ichimoku Cloud H4 chart, the EURGBP price is trading with a trend-changing momentum where the current price is indecisive within the Kumo Cloud. In the future cloud, the Senkou Span A switched its position above the Senkou Span B, indicating an early sign of a trend change. However, investors should wait for an additional indication from the cloud breakout.
The above image shows the buyers' dominance in the market from the Traders Dynamic Index Indicator. However, the TDI line reached the upper band, signifying that the bulls have reached the top, and further upside pressure may come after a bearish correction. The gap between the price and dynamic Kijun Sen indicates a bearish correction as a mean reversion.
Based on the H4 context, the current price faces cloud resistance from where selling pressure may come. However, as the current price trades above the dynamic Kijun Sen, bulls may regain momentum at any time. In that case, any bullish rejection from the 0.8500 to 0.8470 zone with a candle close above the Tenkan Sen level would be a solid bullish opportunity in this pair.
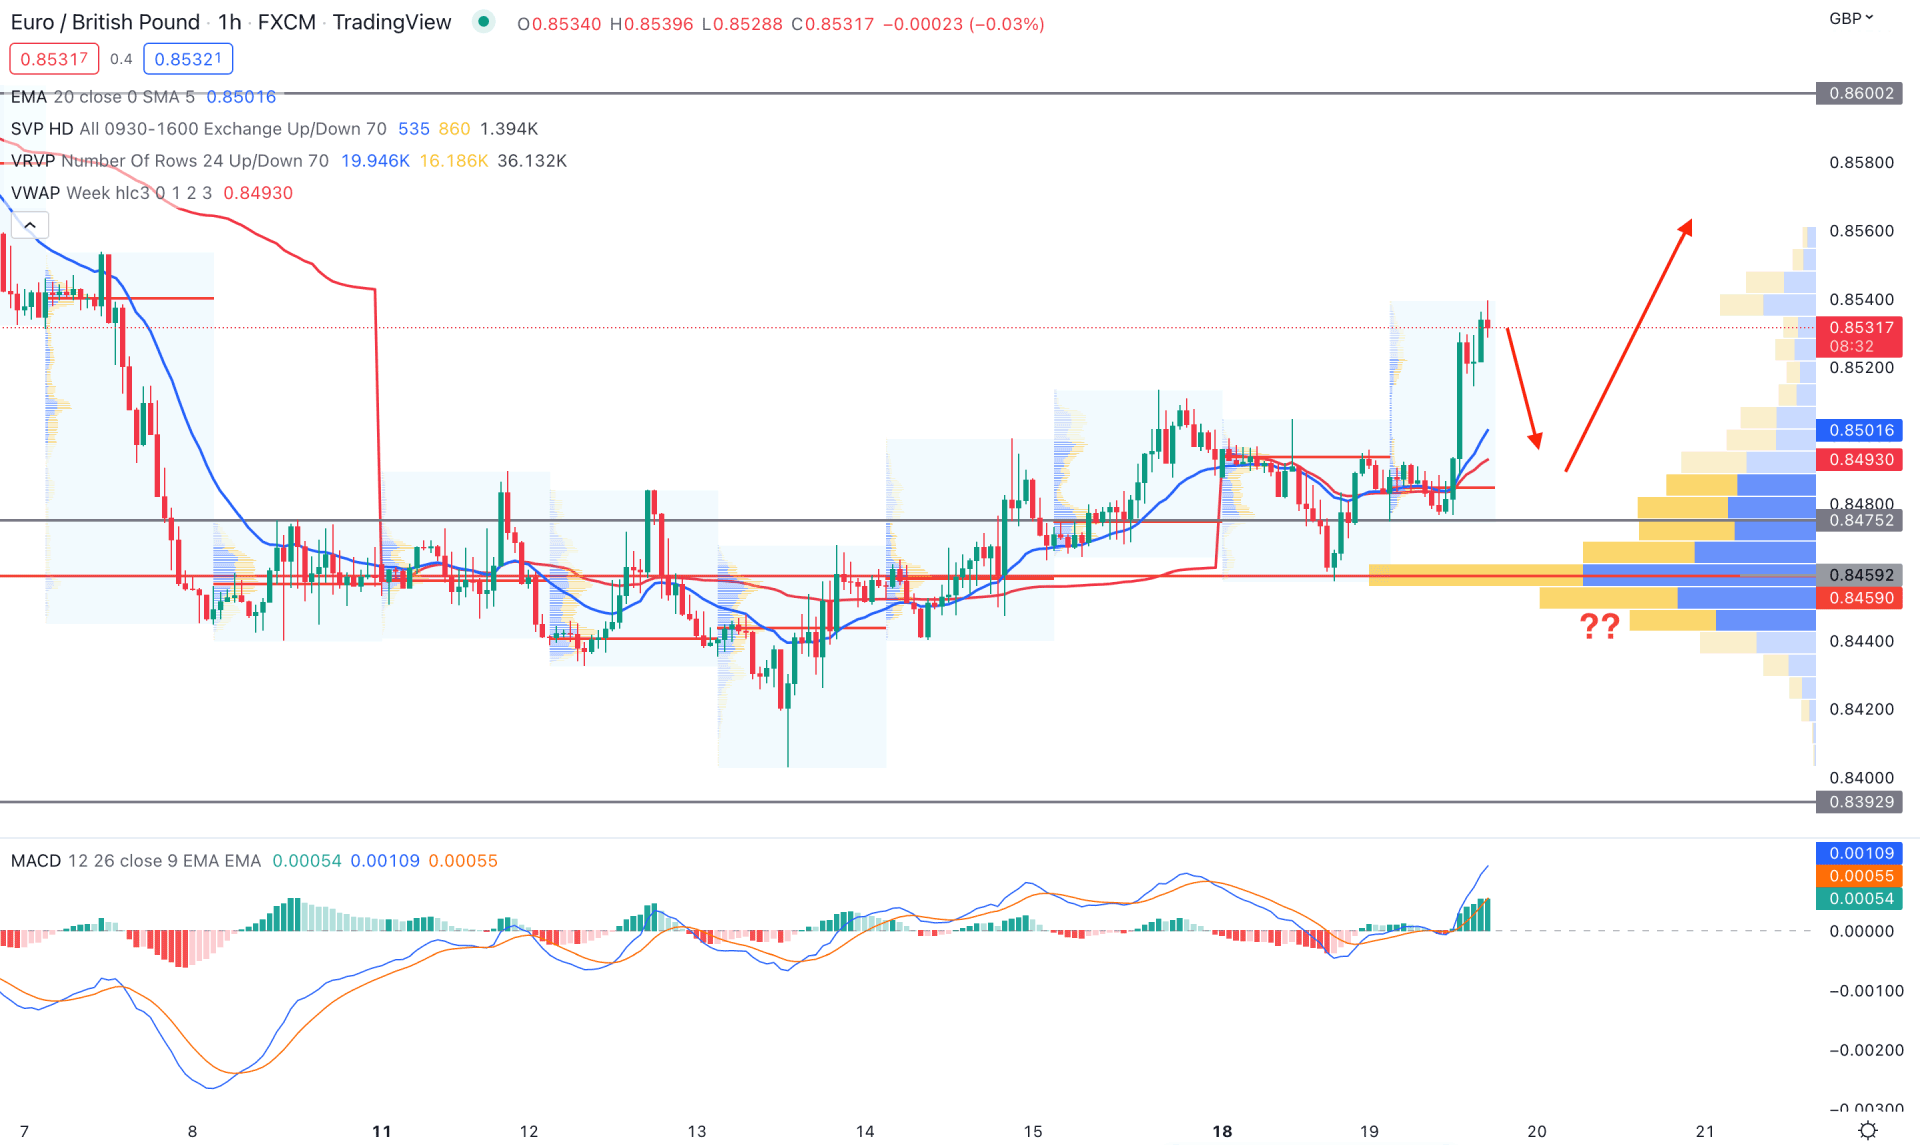
In the H1 chart, the EURGBP price is trading with a bullish expectation as the current price is above the dynamic 20 EMA. Based on the visible range volume structure, the highest trading volume level of 0.8459 is below the current price, indicating buyers' dominance. In that case, the primary aim of this pair is to buy as it trades above the 0.8459 level.
The above image shows a strong bullish position in MACD Histogram, while a minor bearish correction is pending as a mean reversion. In that case, any rebound from 0.8500- 0.8460 zone would provide a bullish opportunity in this pair towards 0.8600 level.
On the other hand, the break below the 0.8459 level with a bearish H1 candle may invalidate the current setup and initiate the correction towards the 0.8392 level.
Based on the current multi-timeframe analysis, EURGBP is more likely to increase in the coming days, where the main aim is to test the 0.8678 level. Therefore, any bullish opportunity in the intraday H4 chart could provide the most reliable trading opportunity in this pair.


