
Published: December 11th, 2025
As investors await the publication of key UK economic data ahead of the Bank of England's (BoE) announcement next week, the pound (GBP) is trading cautiously against its main rivals.
The UK GDP data, expected to show the economy grew 0.1% after falling at a similar rate a month earlier, will be closely watched by investors on Friday. At a time when the UK's fiscal watchdog has raised its GDP forecast for this year to 1.5% from 1.0% in March, a strong start to the fourth quarter would boost confidence in growth prospects.
Investors will pay particular attention to the Manufacturing and Production in Industry figures within the GDP data. Given the low base effect, both economic indices are expected to rise each month.
On Wednesday, when speaking at the Financial Times Global Boardroom Conference in London, Christine Lagarde, the president of the European Central Bank (ECB), adhered to her typical rhetoric. She reaffirmed that the bank's fiscal stance remains sound and added to evidence that the easing cycle is coming to an end, speculating that ECB officials may raise the region's growth projections again.
Let's see the complete outlook from the EURGBP technical analysis:
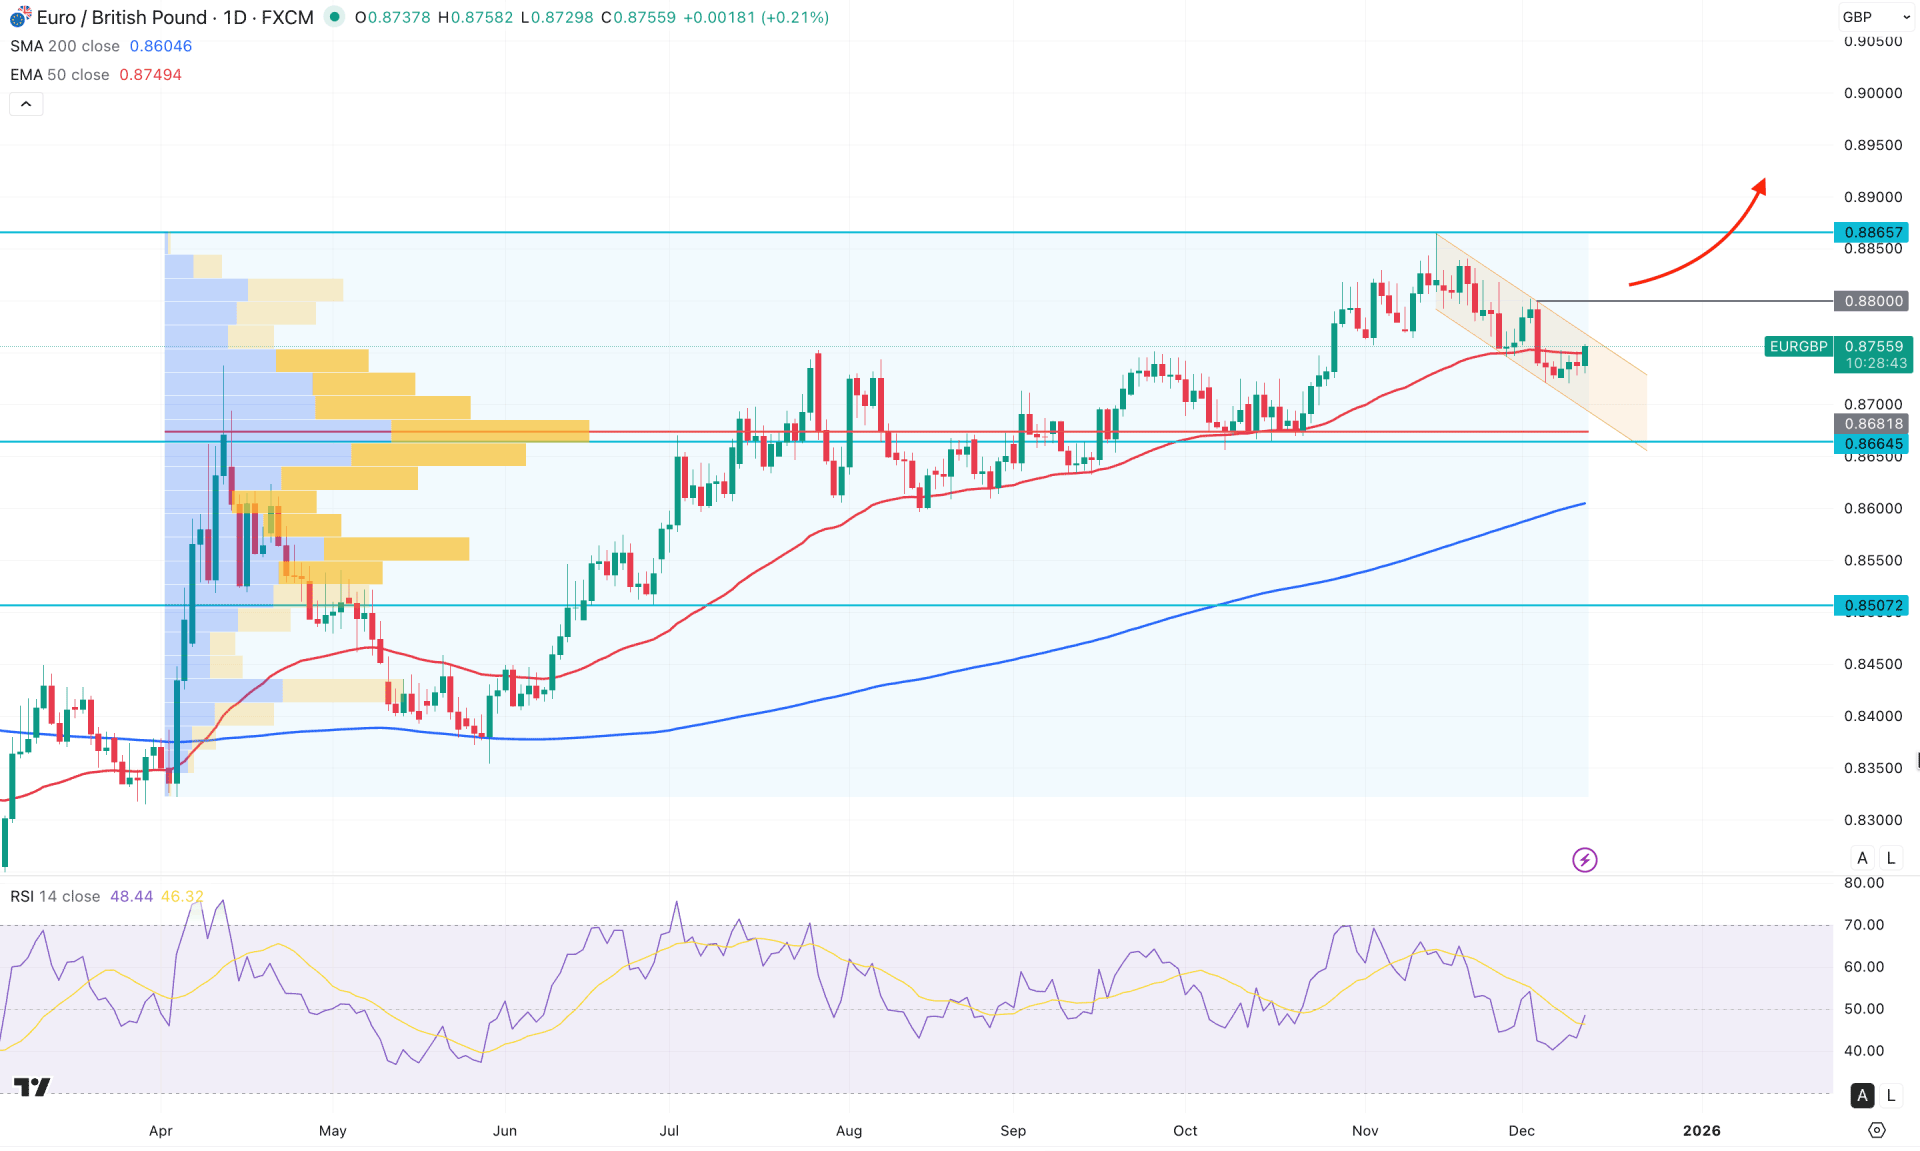
In the daily chart of EURGBP, ongoing bullish pressure is evident as the price continues to rise without showing any meaningful bearish rejection at the top. The stable bullish momentum, supported by dynamic levels, suggests that the primary bias remains to look for long opportunities only.
On the higher timeframe, the monthly candle has formed a shooting star at the top, which could pose a challenge for buyers. However, the yearly decrease period has arrived, and a significant directional shift would require a confirmed monthly close. Meanwhile, the weekly chart shows the price still trading in a bearish zone with no indication of a bullish recovery.
From a volume perspective, the price is in a bullish zone as the most significant volume level since March 2025 lies below the current price. As long as the price holds above this high-volume line, a bullish continuation may occur, even if minor corrective pullbacks appear as part of price normalization.
In the main price chart, the market structure is clear, with the price hovering between the 50-day Exponential Moving Average and the 200-day Simple Moving Average. The 200-day SMA is acting as a major support below the 0.8664 level with a bullish slope. In this context, a bullish recovery that closes daily above the 50-day EMA could reinforce the existing bullish trend.
The Relative Strength Index (RSI) tells a similar story, showing a minor bullish rebound without testing the 30.00 oversold line. As the RSI attempts to decisively breach the 50.00 neutral zone, investors may treat this as an early bullish signal.
In the primary chart, a valid breakout of the descending channel with a daily close above the 0.8800 psychological line could create a highly probable long opportunity, targeting the 0.8900 psychological zone.
Alternatively, the price is still moving within the channel range and below the 50-day EMA. In this scenario, a bearish rejection at the channel resistance, followed by a daily close below the 50-day EMA, could extend the current range-bound movement and drive the price back toward the 0.8664 support level.
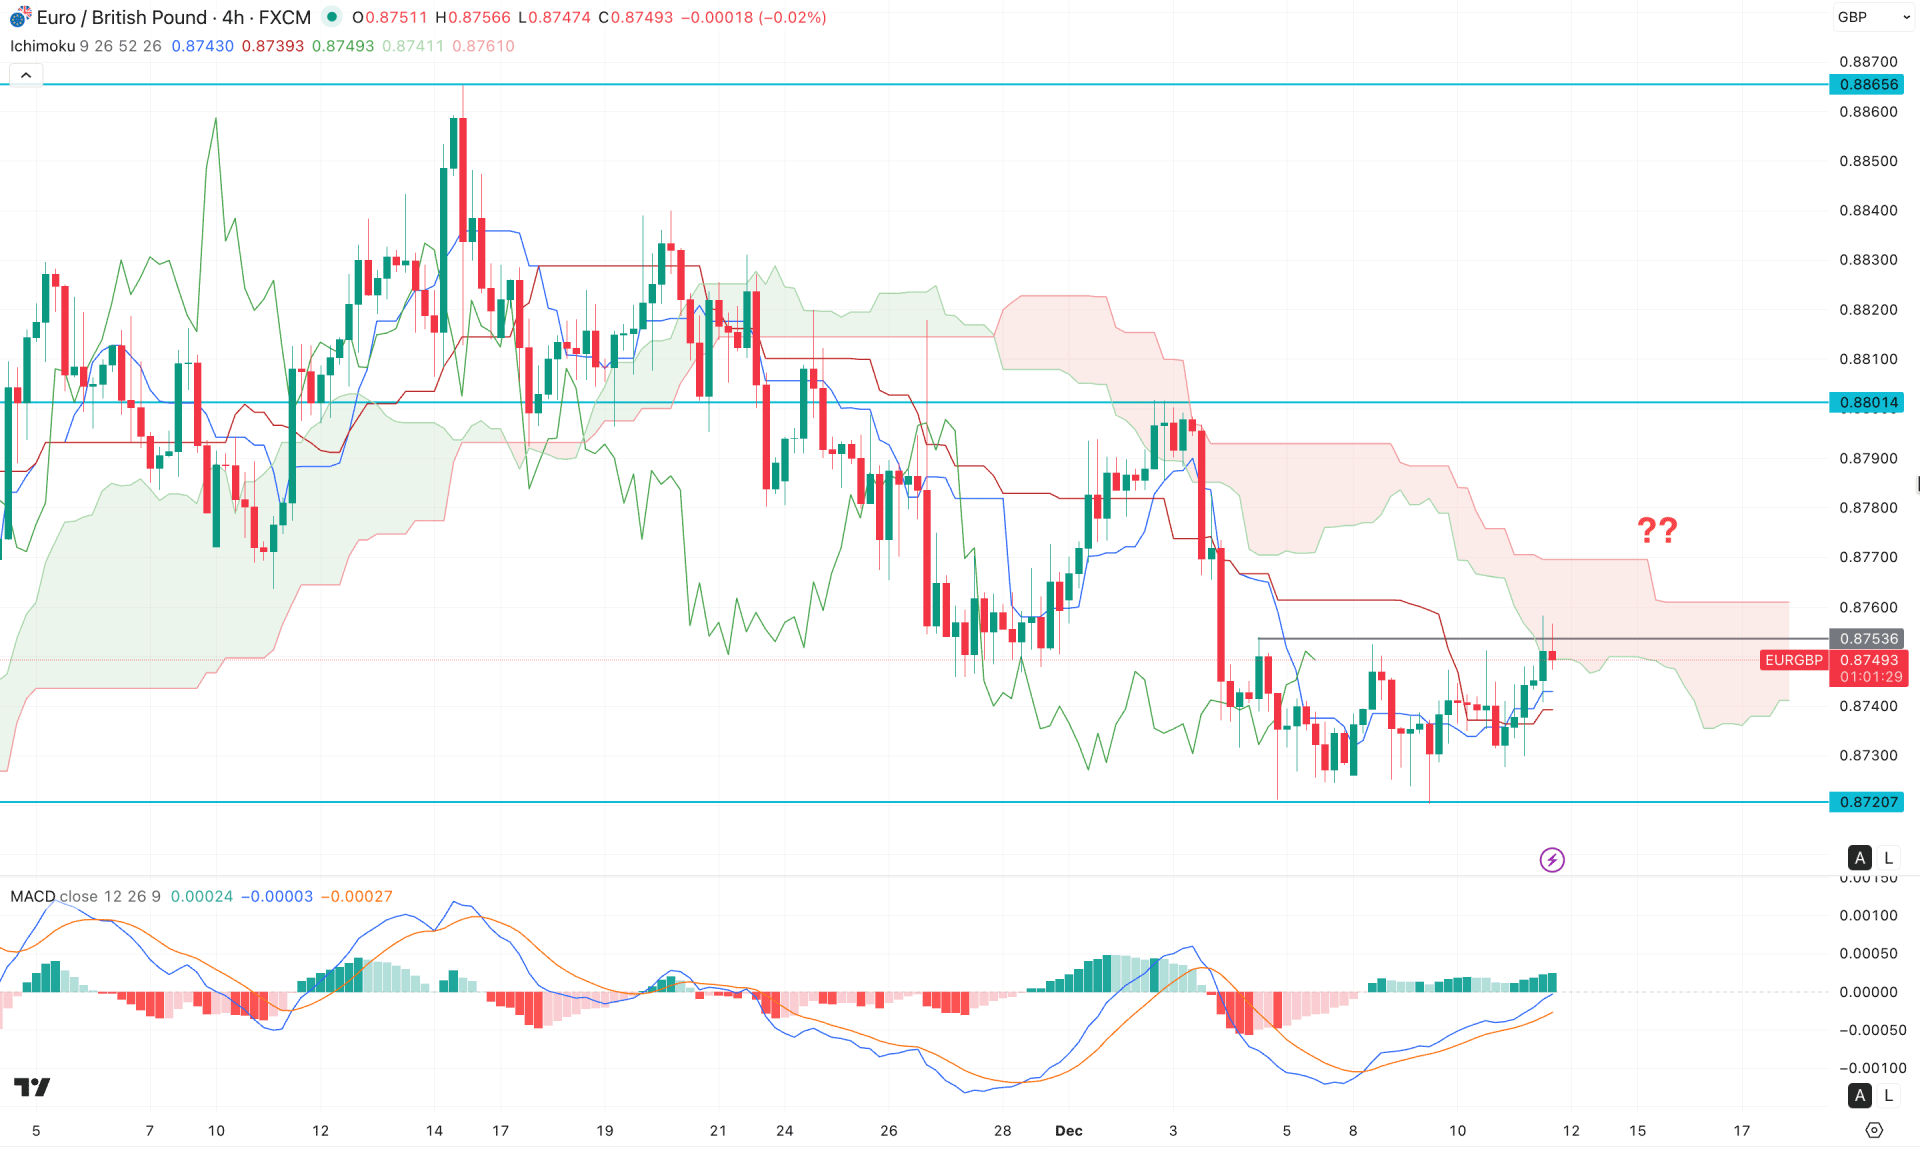
In the H4 timeframe, the most recent price action is trading below the Ichimoku Cloud with a sideways movement. However, the impulsive selling pressure that broke through the cloud created a potential imbalance, which may need to be filled before the ongoing bearish pressure can extend further.
In the future cloud, both Senkou Span lines remain aligned, supporting a bearish continuation. However, multiple bullish four-hour candles forming above the dynamic line indicate an ongoing upward correction. Proper validation is required at this stage before assuming the prevailing trend will continue.
In the secondary indicator window, the MACD histogram has maintained bullish momentum, moving higher for several consecutive candles. In this context, investors should closely monitor how the price reacts to the nearest resistance level at 0.8753. A false break above this level, followed by an immediate recovery back below it, could validate a short opportunity targeting the 0.8700 level.
On the other hand, an extended bullish breakout above 0.8780, followed by consolidation, could confirm a cloud breakout and open the door to a move toward 0.8860.
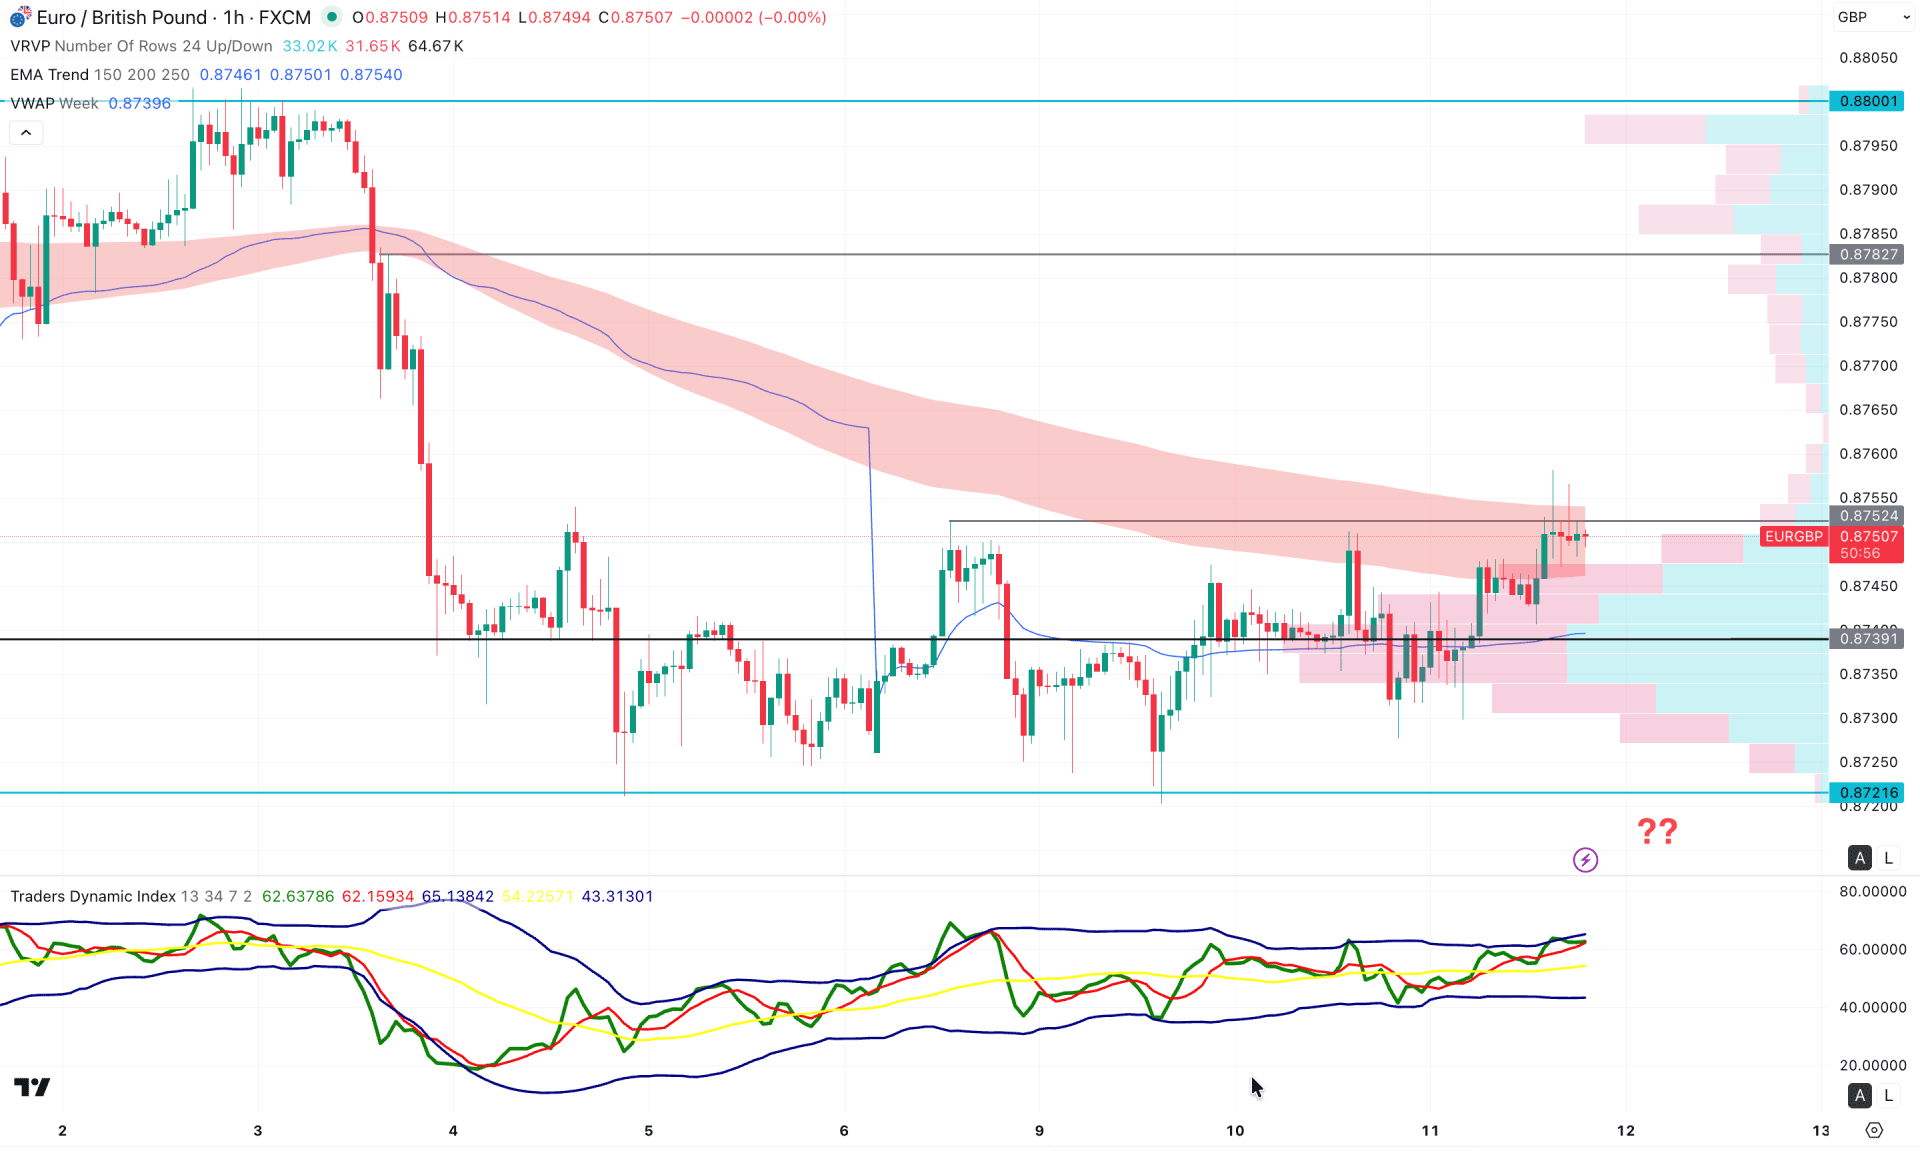
In the hourly timeframe, extended volatility is visible as the price struggles with reduced liquidity during the holiday season. However, the price is still consolidating after a strong bullish rally, with multiple buy-side liquidity sweeps, suggesting a potential downside correction.
In the main price chart, the Exponential Moving Average wave is acting as immediate resistance, while the price continues to consolidate within the Ichimoku Cloud. The VWAP level has flipped below the current price and now serves as immediate support. Additionally, the high-volume node has shifted below the current market level, providing confluence for bullish pressure.
Based on the overall market structure, a bullish breakout remains likely if a valid hourly candle closes above 0.8760, which could increase the likelihood of a continuation toward 0.8800. Conversely, any immediate bearish pressure below the 0.8739 support level may extend the decline toward the 0.8721 support. A break below this level would expose the next support zone at the 0.8700 area.
Based on this scenario, EURGBP bullish momentum is solid even if the higher timeframe price action signals a mixed sentiment. Investors should closely monitor the daily chart as a valid channel breakout could be a trend continuation opportunity.


