
Published: July 31st, 2025
The EURGBP maintained the intraday buying pressure as traders keep their confidence that the Bank of England (BoE) is going to reduce interest rates in the coming months following a barrage of poor UK economic reports.
After a quarter-point cut in May, the BoE's Monetary Policy Committee (MPC) approved six to three last month to maintain rates at 4.25%. Because of softening job markets and increased price inflation in the UK, analysts anticipate that the United Kingdom central bank will lower interest rates at its August meeting. This could therefore continue to pressure the GBP and serve as a short-term tailwind for the cross.
According to Reuters, the BoE is also anticipated to reduce the 558 billion-pound ($754 billion) government bond holdings by slowing quantitative tightening. Economists expect that next week will provide some insight into the BoE's longer-term objectives for the stockpile.
According to Eurostat's data released on Wednesday, the second quarter's (Q2) GDP for the Eurozone was better than anticipated. Compared to 0.6% in Q1, the Eurozone economy gained 0.1% QoQ in Q2, exceeding the 0% estimate. The Eurozone GDP grew 1.4% every year in Q2, stronger than the 1.2% anticipated, after expanding 1.5% in Q1.
Businesses are adjusting to trade uncertainties, according to the positive GDP figures, which may lessen the need for additional interest rate cuts by the European Central Bank (ECB) to boost the union and sustain the common currency.
The preliminary assessment of the July Harmonised Index of Consumer Prices (HICP) data, which is anticipated later on Friday, will provide traders with additional guidance.
Let's see the complete outlook from the EURGBP technical analysis:
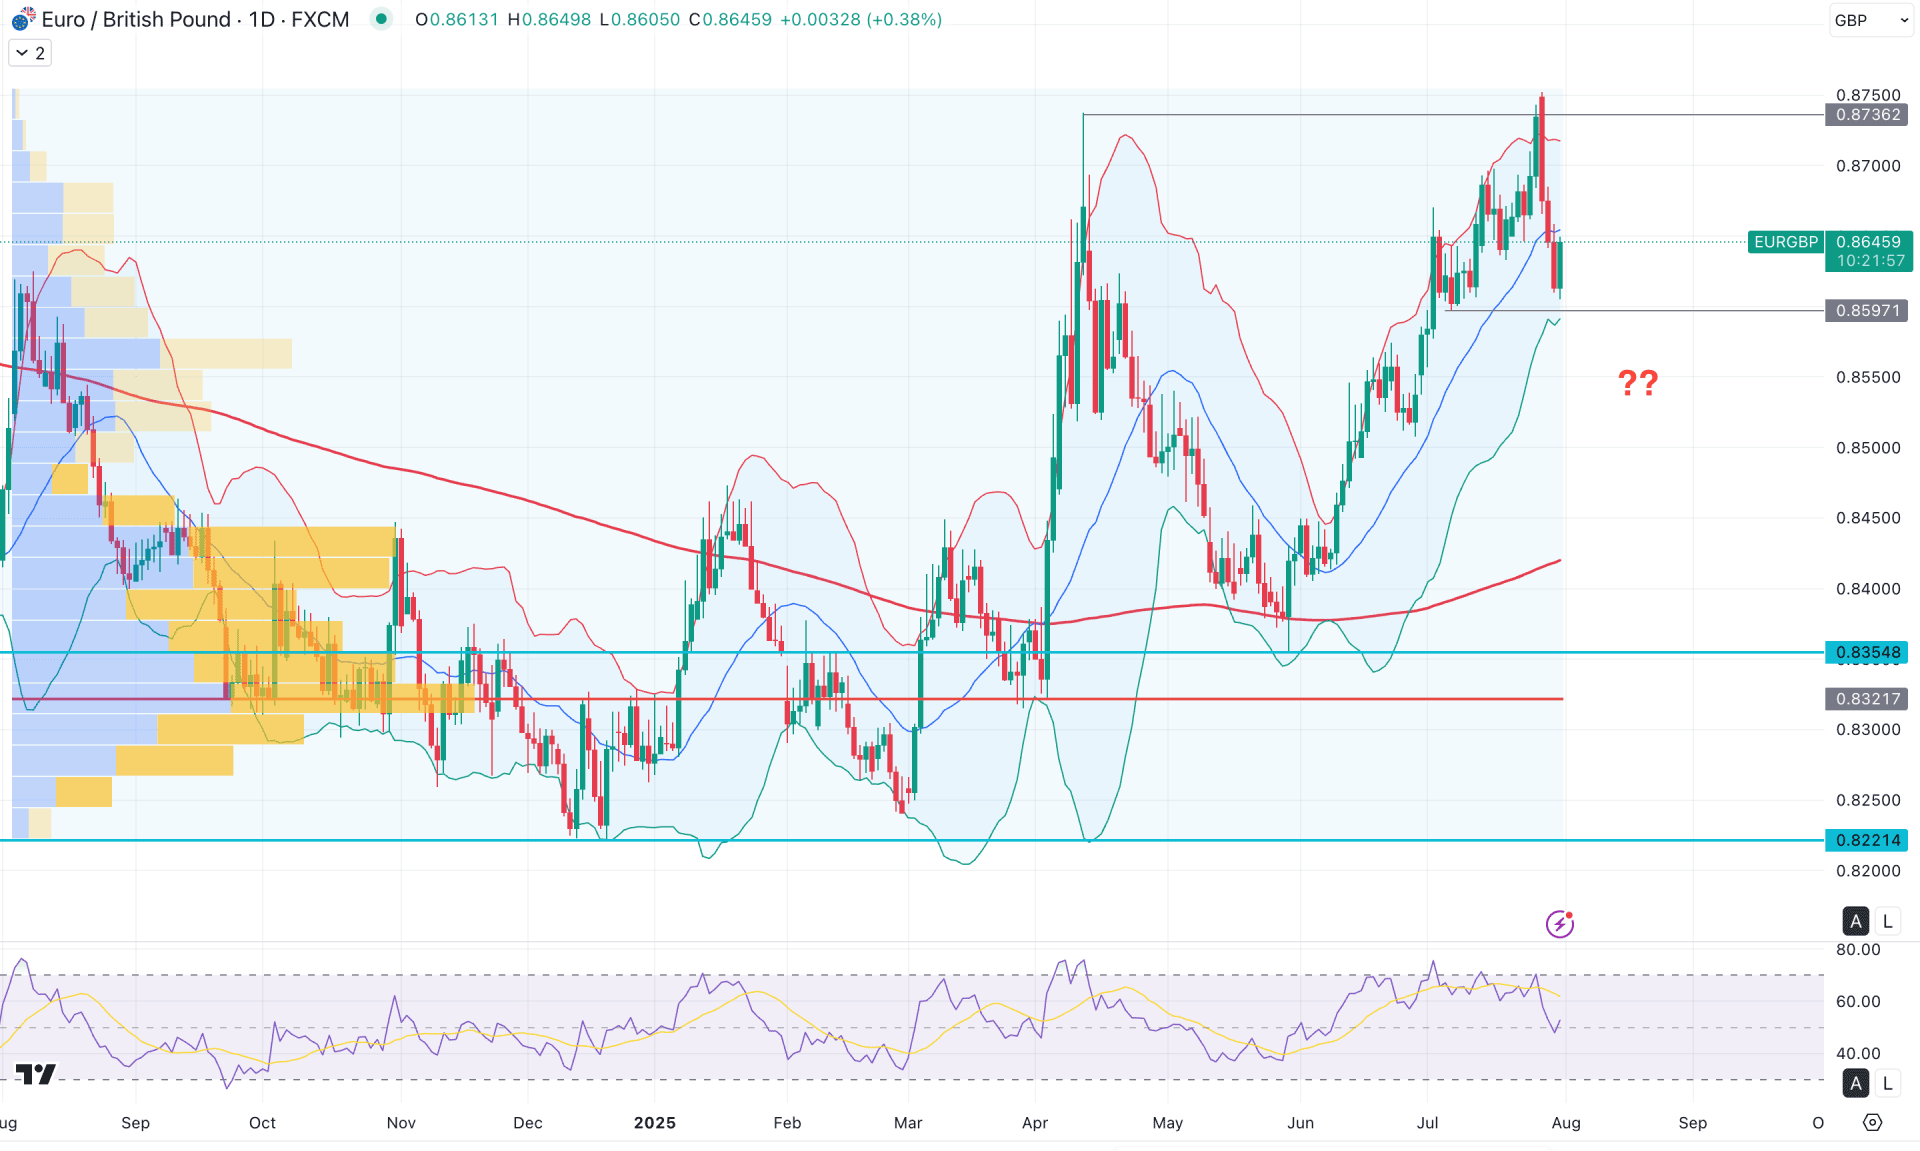
In the daily chart of EURGBP, the recent price action rebounded and created a new yearly high before forming three consecutive bearish daily candles. As the bearish momentum emerged from the premium zone, a sufficient downside correction might occur soon.
In the higher timeframe, the price is still trading within a long monthly consolidation zone. The most recent candle is positioned in the premium area. Moreover, the weekly chart shows a similar structure, as the latest candle is trading bearishly from a key resistance level.
In terms of volume and structure, the broader outlook remains bullish, but a downside correction is likely as a mean-reversion move. According to the high-activity indicator, the strongest volume level since October 2024 is located at 0.8321, which is significantly below the current price.
On the main chart, a sweep of buy-side liquidity occurred, followed by an immediate bearish reversal from the Bollinger Bands resistance level. As a result, the price reacted from the recent swing high, indicating a potential corrective phase ahead.
On the other hand, the 200-day Simple Moving Average (SMA) is positioned below the current price and is acting as dynamic support. As long as the price remains above this level, the major market trend is expected to stay bullish.
In the secondary indicator window, the Relative Strength Index (RSI) has recently returned from the 70.00 level, suggesting a possible reversal. However, the price is still trading within the mid-Bollinger Bands range, and further confirmation is required before anticipating a strong bearish move.
Based on the daily market outlook, EURGBP is more likely to extend the current correction within the broader bullish trend. Investors should closely monitor the 0.8597 level, as a failure to hold above this area could trigger a short-term bearish opportunity. In that case, the price may decline toward the 200-day SMA for support.
Alternatively, a failure to break below the lower Bollinger Band could signal a bullish continuation. In that scenario, a stable price above the dynamic 20-day EMA could offer a long opportunity, with a potential target at the 0.8750 level.
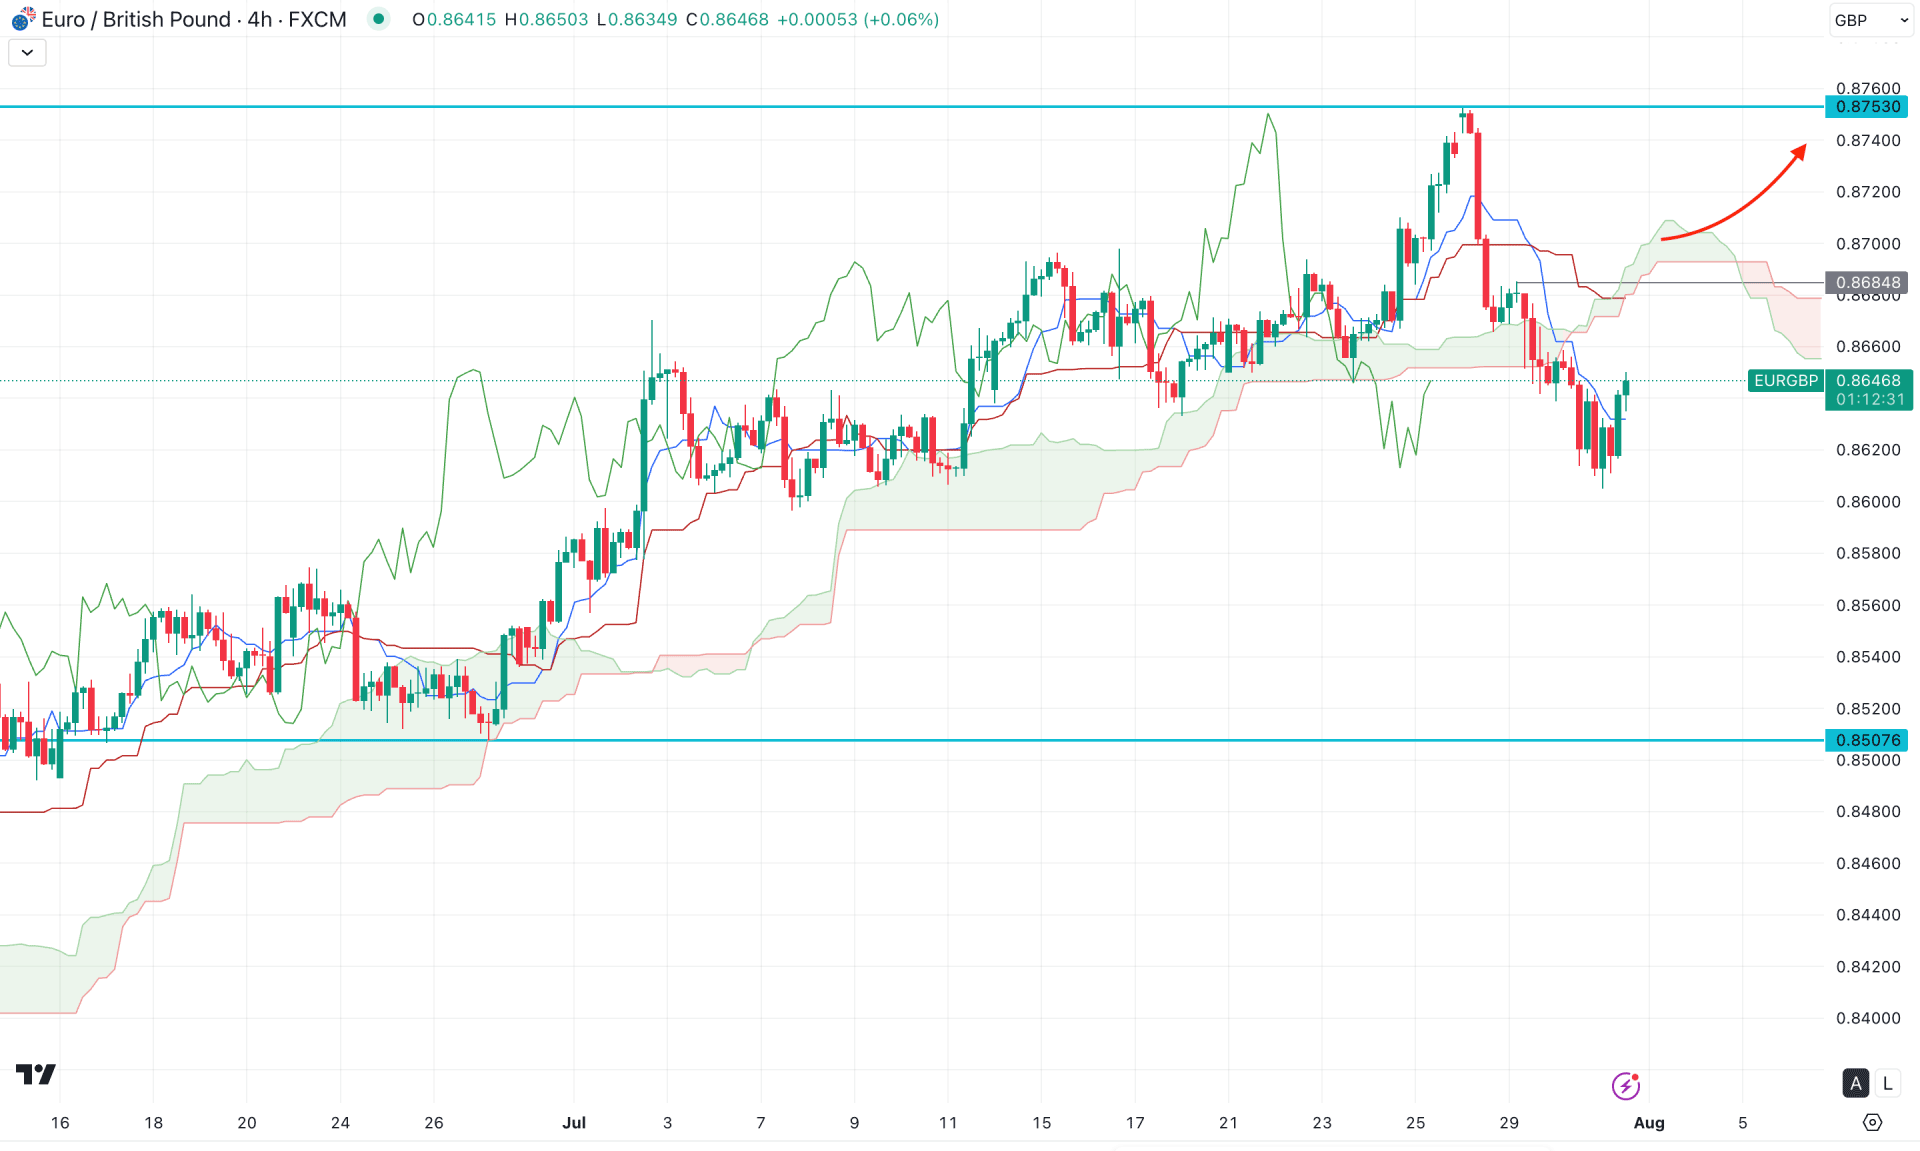
In the H4 timeframe, the recent price action shows a bearish reversal below the Ichimoku Cloud, suggesting a potential market shift. Moreover, the Future Cloud remains favorable to bears, as both Senkou Span A and B are sloping downward and acting as a key resistance zone.
On the other hand, selling pressure appears to have bottomed out, as the most recent price has moved above the 10 level.
Based on the four-hour outlook, a continuation below the cloud resistance requires a valid rejection from the near-term resistance area. A bearish rejection from the dynamic key levels could present a short opportunity, targeting the 0.0700 level.
Alternatively, any immediate bullish breakout above the cloud's upper boundary could invalidate the current bearish structure. In that case, a strong bullish continuation may follow, with the potential to create a new yearly high.
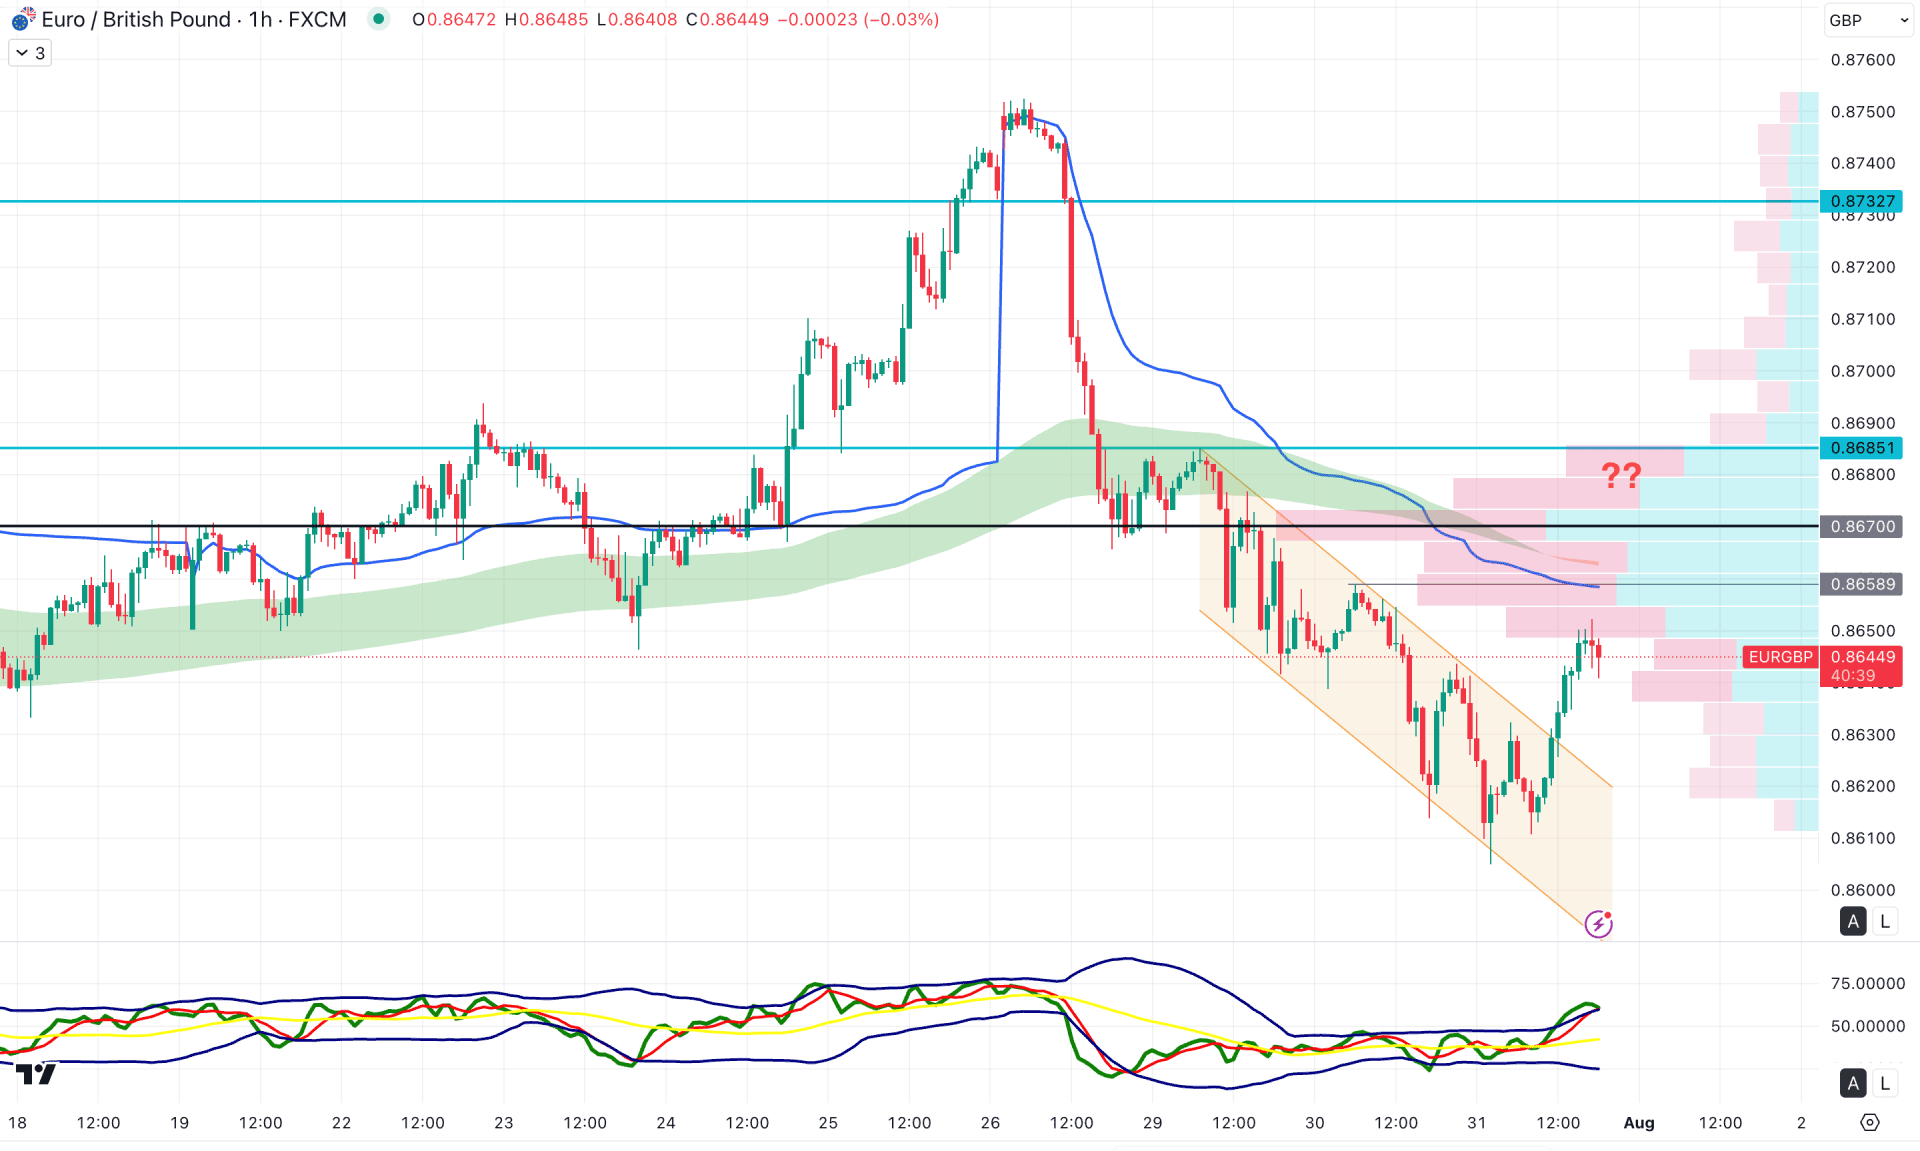
In the hourly timeframe, EURGBP is trading with a bullish tone following a decent descending channel breakout. However, the major market trend remains bearish, as the higher timeframe resistance line is still above the current price.
Moreover, the moving average wave is showing a bearish slope, aligned with the weekly VWAP level, signaling additional downside pressure.
From the current outlook, the existing bearish trend is still intact, and the price is likely to resume selling pressure after a valid rejection from any dynamic resistance.
The primary resistance area remains near the previous high before targeting the 0.8600 level. On the other hand, an extended bullish move toward the 0.8670 resistance level could invalidate the short-term setup and trigger renewed upward pressure.
Overall, EURGBP is attempting to break out from the premium zone, and any sign of internal selling pressure could present a short-term short opportunity. Investors should closely monitor how the hourly price reacts above the channel breakout zone, as a possible top formation could resume the existing bearish trend below the 0.8600 mark.


