
Published: August 30th, 2022
The Eurozone Preliminary PMI data for August showed a bleak picture of the EU economy. The manufacturing report exceeded expectations but remained below the lowest level since June 2020. Moreover, the Composite plunged deeper into the contraction by coming at 49.2, down from 49.9 in July.
All of these reports indicate a contraction in the Q3 GDP. According to a report from S&P Global, the slower demand & output and decline in export orders might be a negative factor for the Eurozone economy. Moreover, the German IFO survey showed a second consecutive month of decline while the GFK consummate sentiment fell to the lowest level since 2005.
In Switzerland, the SNB total sight deposit for the week ending 19 August came at 752.8 billion CHF, up from 751.3 billion CHF the previous week. The increase in the sight deposit came for seven consecutive weeks, which increased the possibility of tightening policies by the CNB.
Let’s see the future price direction of EURCHF from the EURCHF technical analysis:
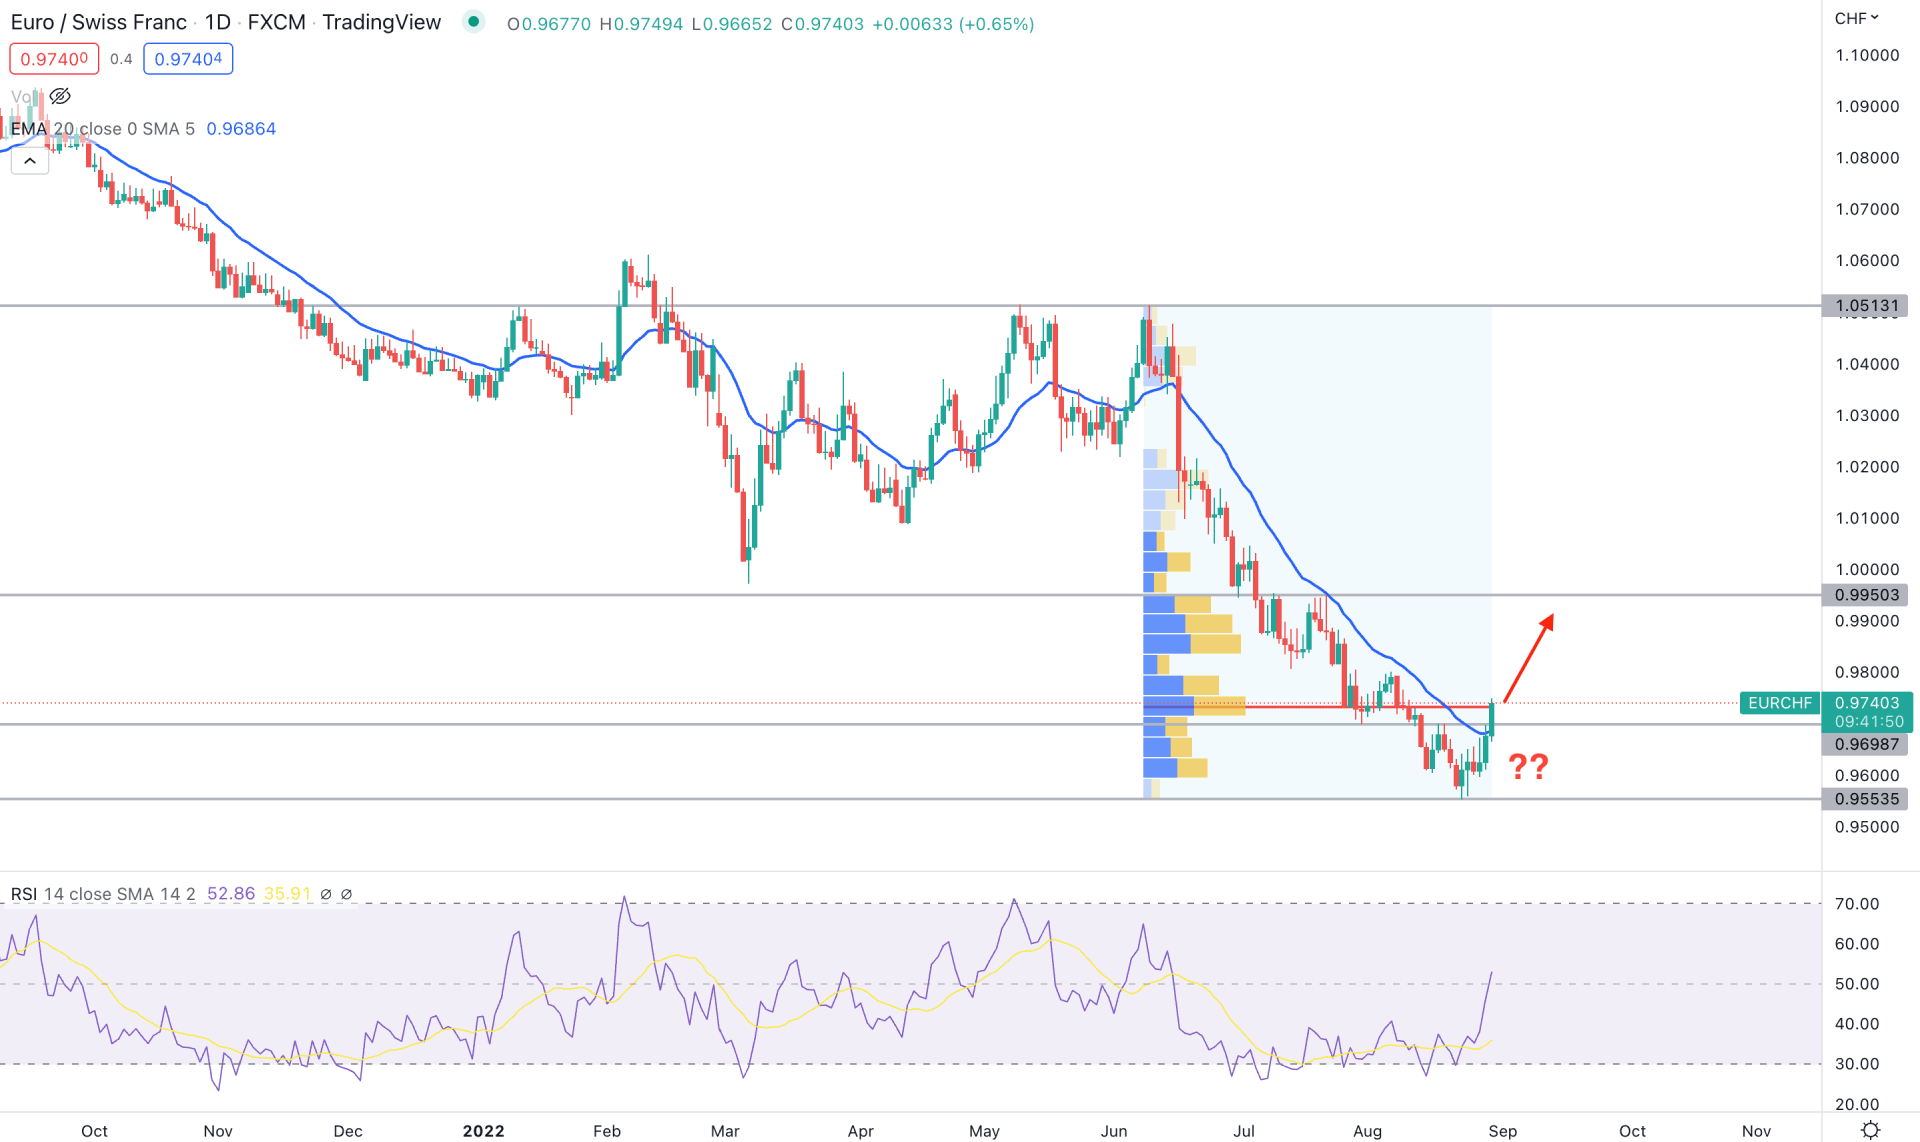
In the daily chart of EURCHF, the bearish pressure from June 2022 came with an impulsive momentum by providing a 9% price decrease. Therefore, the extreme bearish pressure found ground at the 0.9553 level, from where a bullish correction may appear.
Based on the trading volume indicator from June 2022 high to the August 2022 low, the highest trading volume was found at the 0.9730 level, which would be the primary barrier to bulls. In that case, any stable buying pressure above the 0.9730 level with a bullish daily close might increase the price towards the 0.9950 level.
In the price chart, the dynamic 20-day Exponential Moving Average is below the current price, while the current RSI level is above the 50% level.
Based on the EURCHF daily technical analysis, the buying possibility in this pair is potent as the bullish rejection from the 0.9553 level came with a bullish Quasimodo pattern. However, the bulls should take the price above the 0.9730 high volume level before aiming for the 0,9950 key resistance level.
On the other hand, the broader market trend is still bearish, where a bearish daily close below the 0.9698 support level might alter the current market structure and lower the price towards the 0.9553 level.
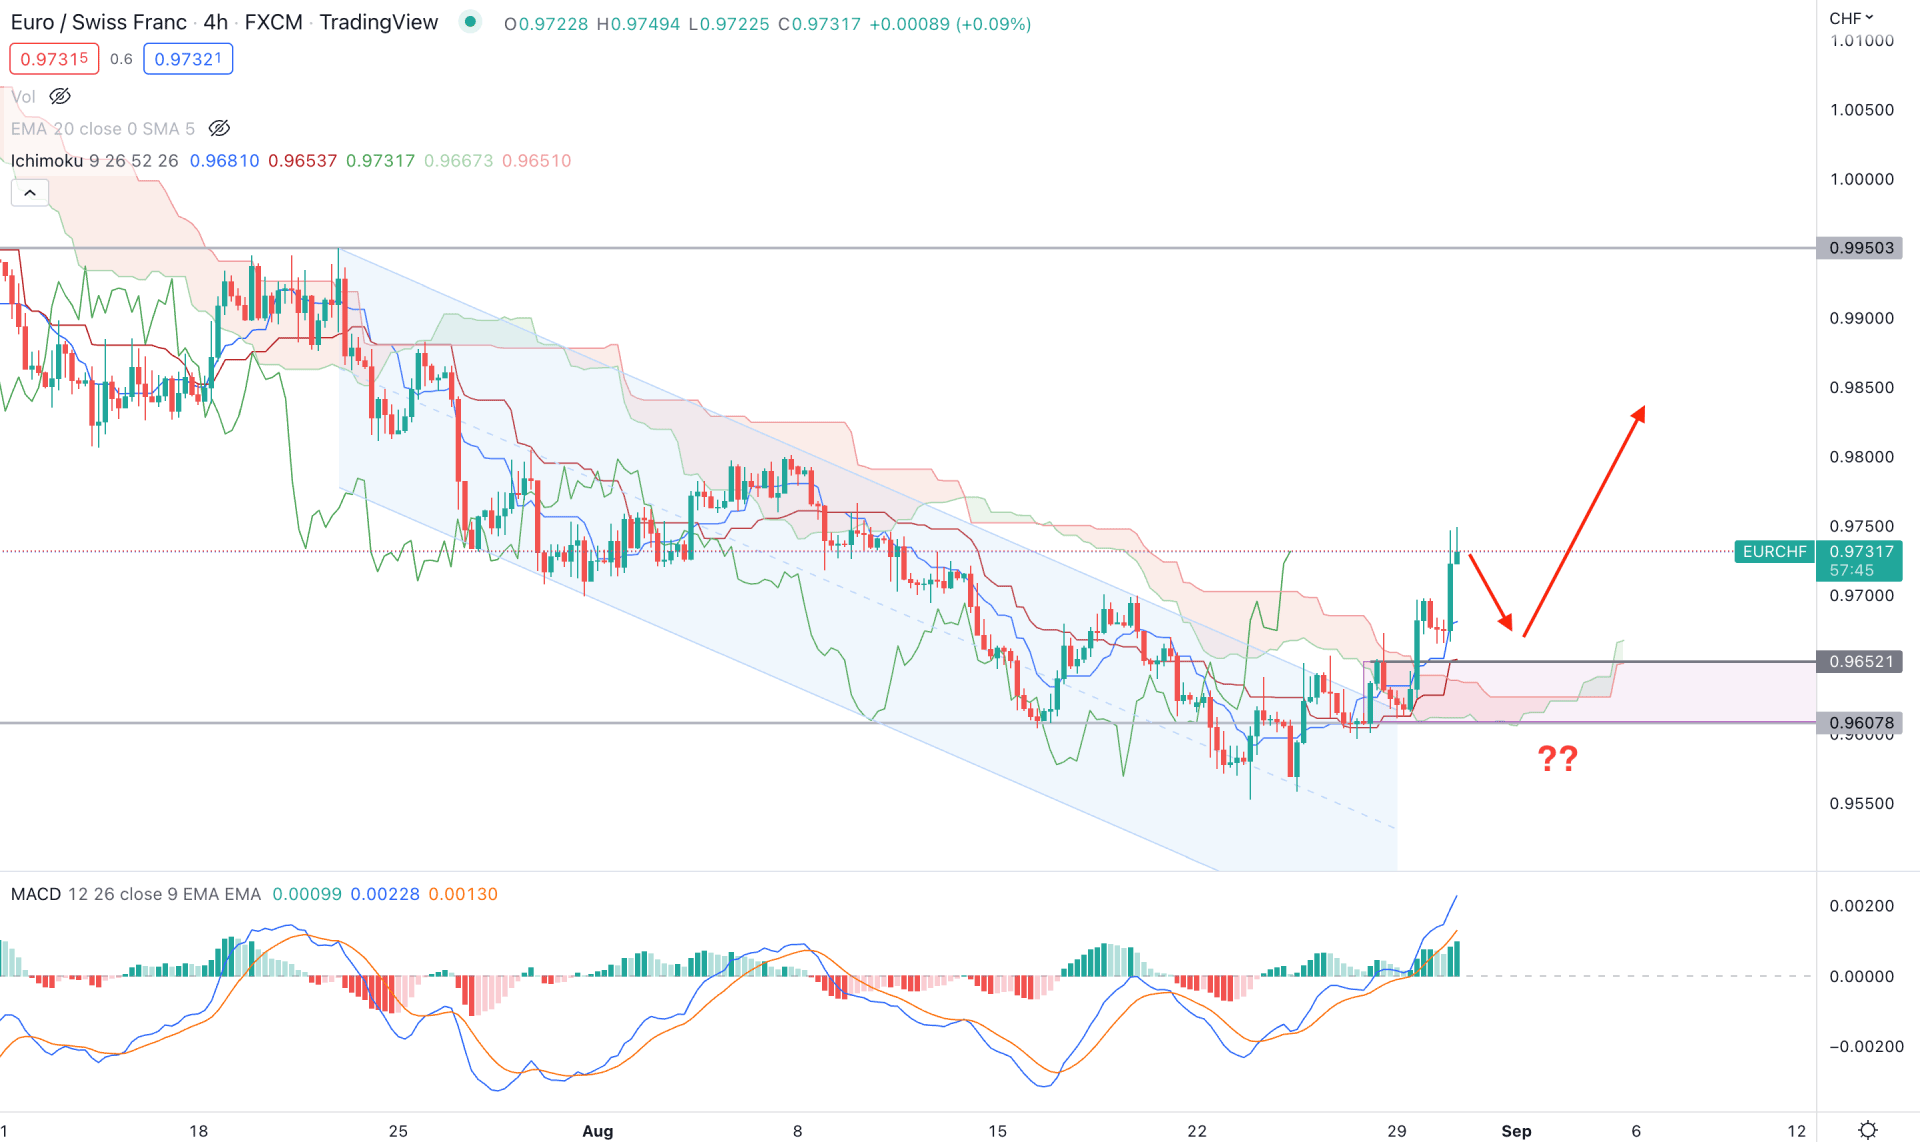
In the EURCHF H4 chart, the market sentiment shifted the direction from bearish to bullish with a cloud breakout. As a result, the future cloud shifted its direction to the upside, where Senkou Span A is above Senkou Span B. Moreover, the Lagging Span is above the price and aimed higher.
The MACD Histogram remained bullish in the indicator window for a considerable time, while the price made consecutive higher highs. However, the current MACD EMA level reached the overbought position, which may lead to a bearish correction in the price.
Based on the H4 timeframe, the current bullish pressure needs to correct lower, where any bullish rejection from 0.9652 to 0.9600 zone would be a decent buying point towards the target of 0.9950 level.
The alternative trading approach is to find the price below the 0.9600 level with a strong bearish H4 close, which may increase the possibility of testing the 0.9500 level.
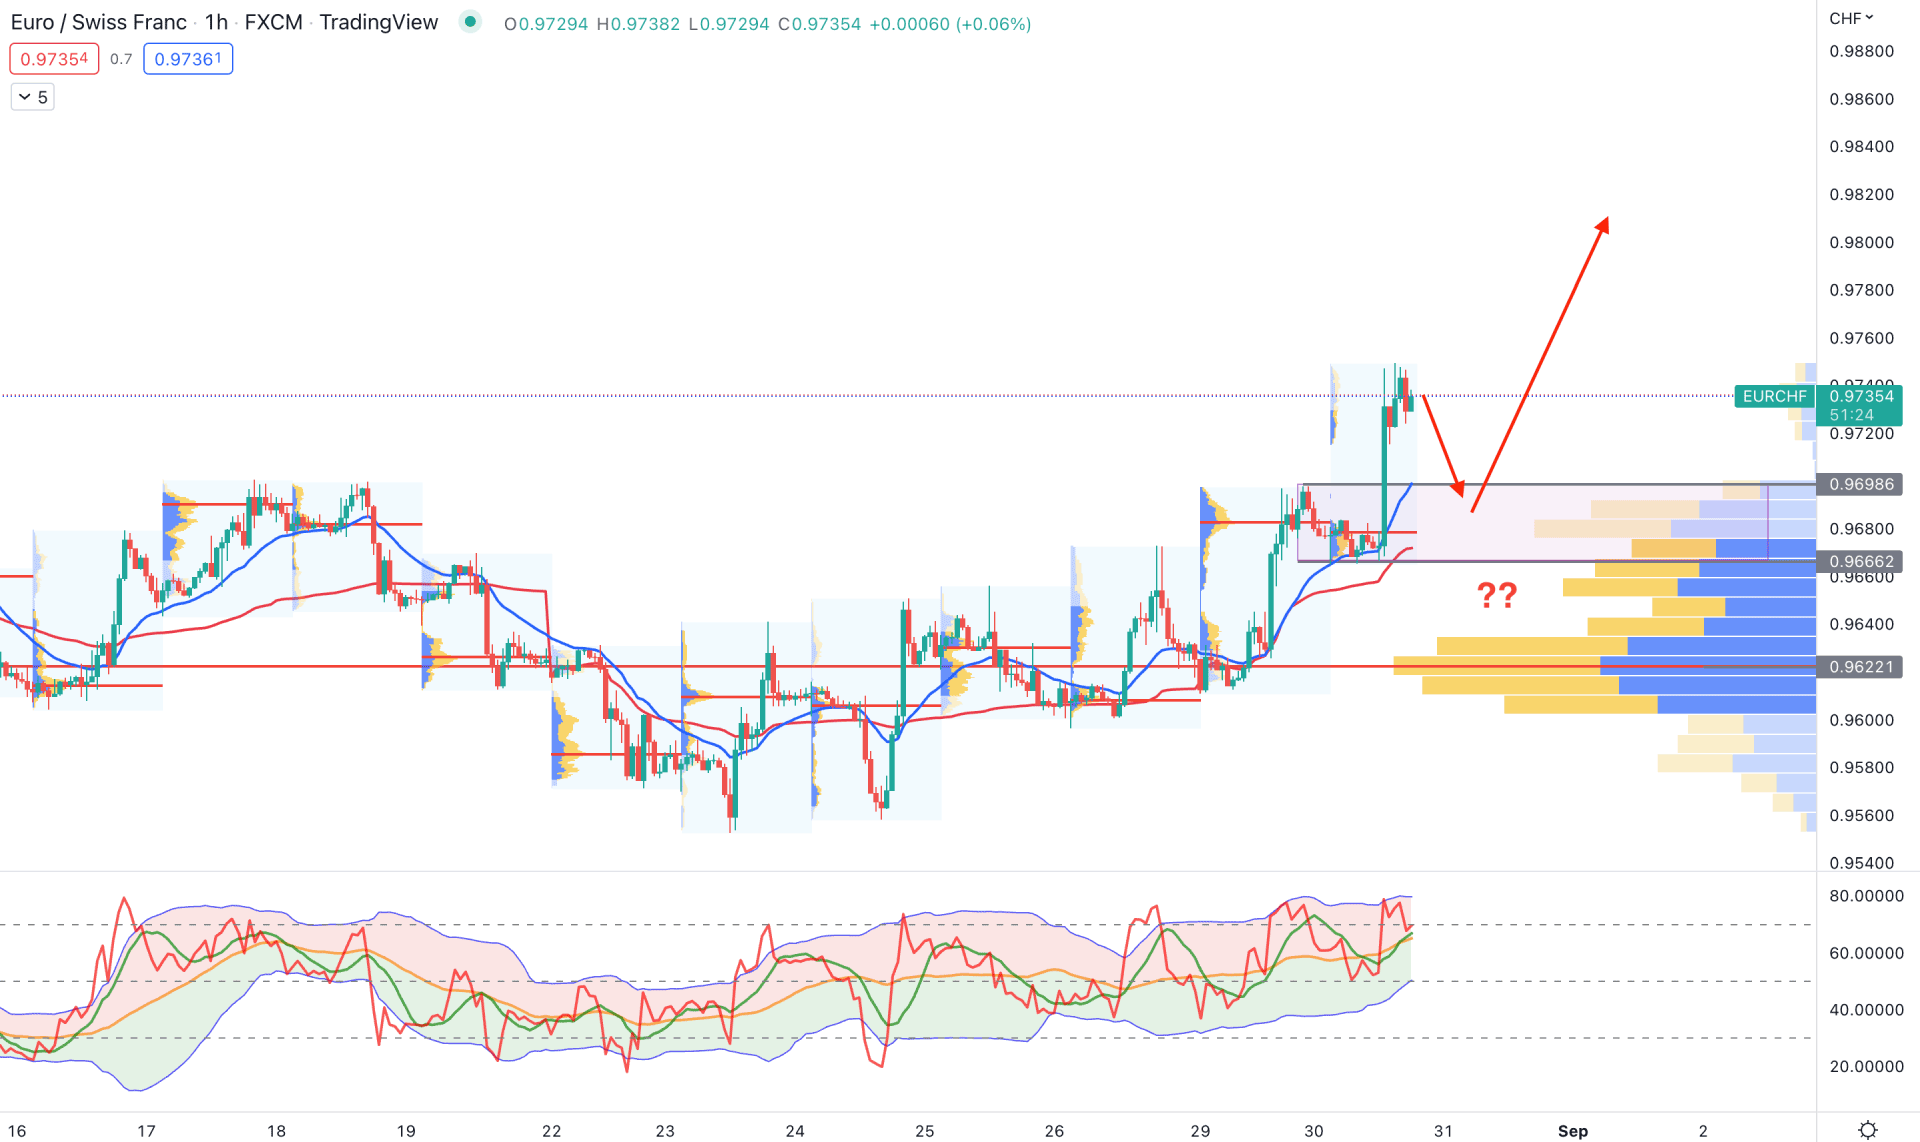
In the EURCHF hourly chart, the current price trades with a strong bullish momentum coming from the bullish breakout with a U-shape recovery. Moreover, the visible range trading volume indicator shows the highest trading volume is at 0.9622 level, which is a crucial breakout level. Moreover, the current dynamic 20 EMA and weekly VWAP are below the price, while the current intraday high volume level is at 0.9680 level.
In the indicator window, the current TDI level is above the 50% area, indicating strong buyers' presence in the market. However, the TDI level reached the overbought barrier, which hints at a possible bearish correction in the price.
Based on the H1 chart, a minor bearish correction towards the 0.9698 to 0.9666 zone is pending from where any bullish rejection candlestick could hint at a bullish possibility. In that case, the primary target of bulls will be towards the 0.9800 key resistance level.
On the other hand, the bullish possibility is valid until the price breaks below the 0.9622 visible range high volume level.
Based on the current multi-timeframe analysis, EURCHF is more likely to move higher in the coming days if a daily candle closes above the current high volume level. On the other hand, the broader market is still bearish, and traders need to be cautious while taking any counter-trend trades.


