
Published: October 19th, 2022
Throughout the week, ECB members have presented cases for 75bp and 50bp rate hikes with Luis de Guindos Jurado, ECB vice president. According to Jurado, it was tough to determine the terminal rate adding when it comes to further moves, as the bank is data-dependent.
In August trade balance continued to deteriorate, coming in -€50.9bn vs. in July -€34bn. Exports increased 24% y/y; but imports rose 53.6% y/y. Year-to-date energy imports rose surprisingly 154%, declaring the European energy crisis magnitude.
This week, the final CPI y/y showed development by coming down to 9.9% from 10.0%, which could offer a buying possibility in Euro.
On the other hand, the total sight SNB deposits for the week came in at CHF639.3bn ending 7 Oct vs. the previous week's CHF669.6bn. As investors move away funds from SNB, another big drop in sight deposits (-30.3bn) could come with a selling pressure for CHF.
Let’s see the future price of EUR/CHF from the EURCHF technical analysis:
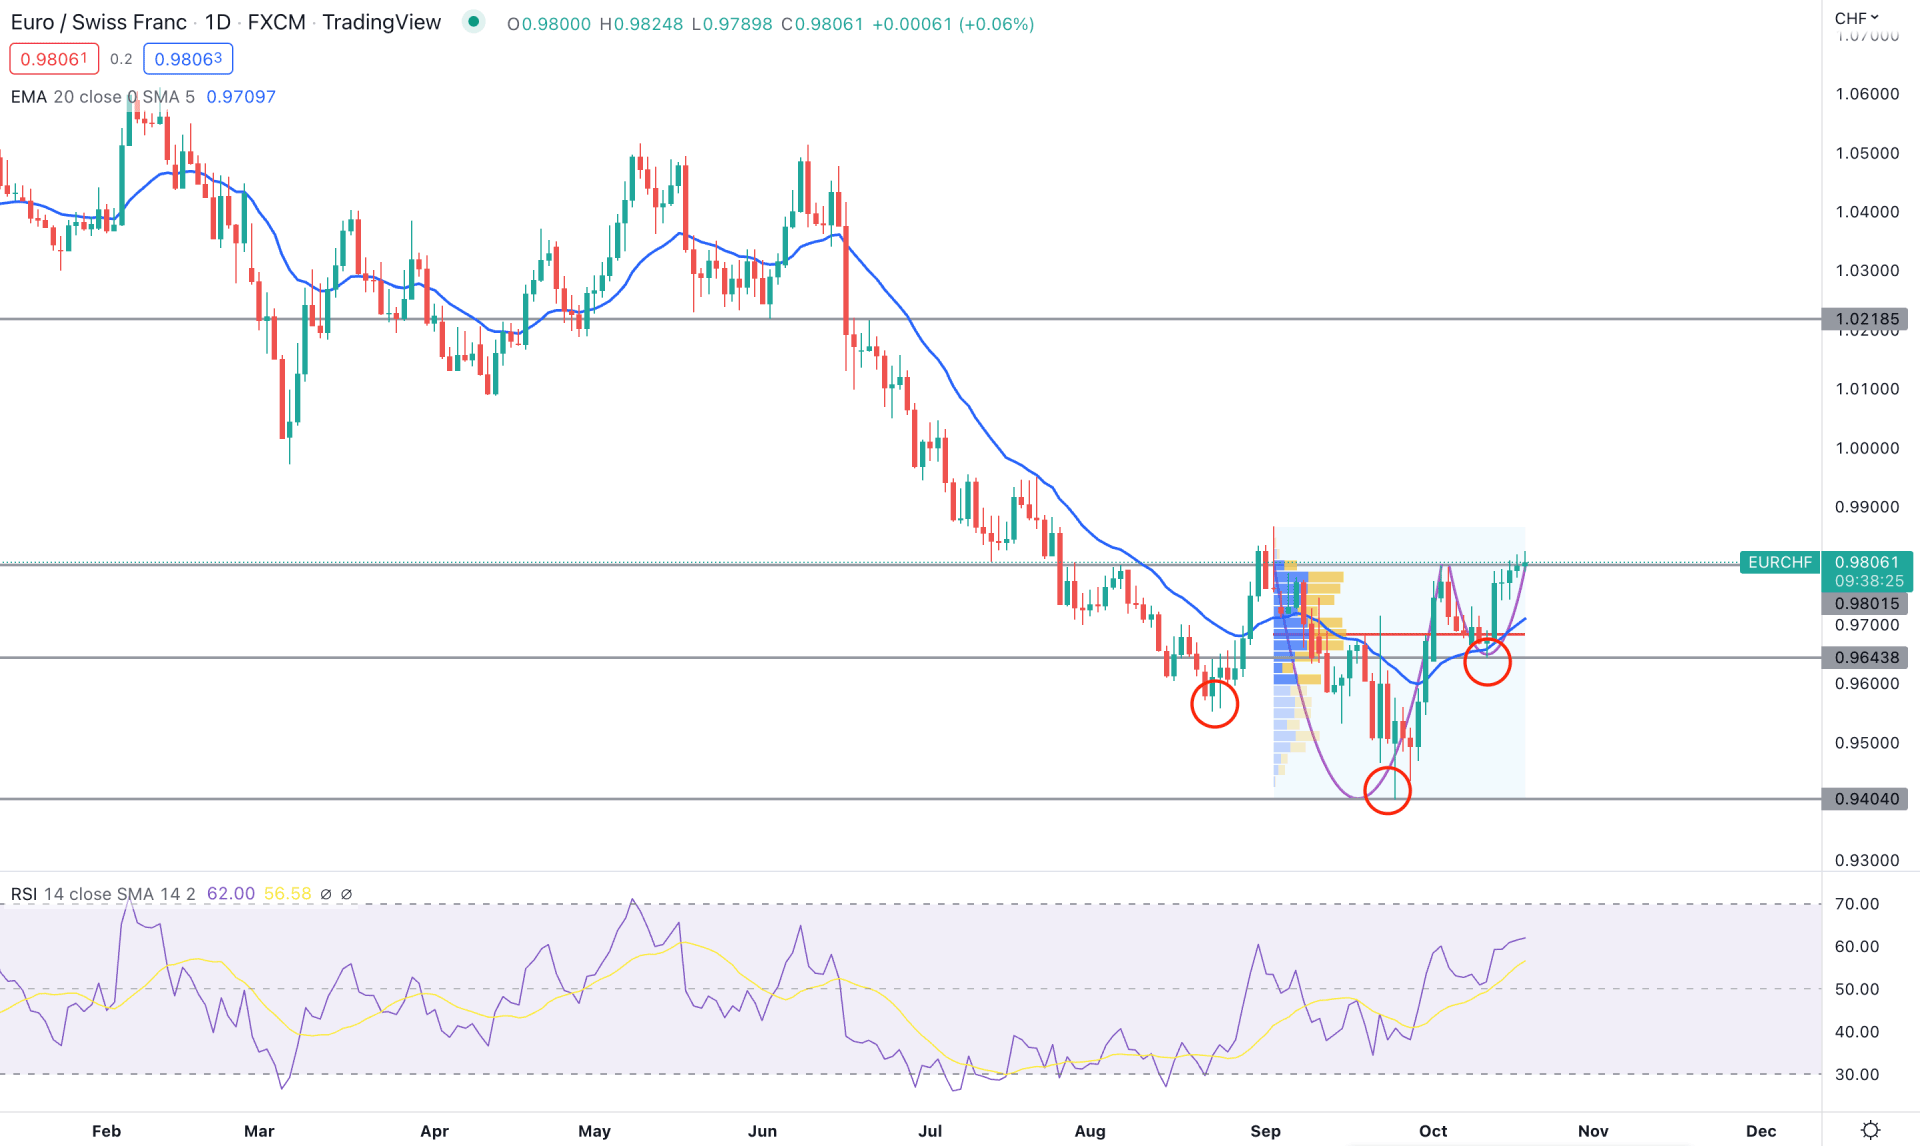
The broader market context for EURCHF is extremely corrective as bears failed to extend the momentum after a strong rally from June 2022 high.
The lack of sellers' interest influenced bulls to form a potential inverse head and shoulders pattern, where a bullish breakout at the pattern neckline is pending. Moreover, the potential cup and handle pattern is also in play, which could offer confluence support for bulls if the breakout happens.
Based on the volume structure, the latest sell side volume faded as the current price is trading above the high volume level from the August high to the September low. A strong buying pressure with a massive increase in volume after a bearish rally is a sign of a potential reversal momentum, where close attention to intraday price action is needed.
On the other hand, the price showed a strong buying pressure above the 20 DMA, while the near-term support level is 0.9643 level. The Relative Strength Index is also supportive of bulls where the test of the overbought 70 level is pending, with bullish price action in the main chart.
Based on the daily outlook, a bullish daily candle above the 0.9801 level would confirm the Inverse Head and Shoulders breakout, with a possibility of reaching the 1.0218 level in the coming days.
On the other hand, the selling pressure is valid if the price comes below the 0.9643 level with a bearish daily candle, which could extend the loss toward the 0.9404 area.
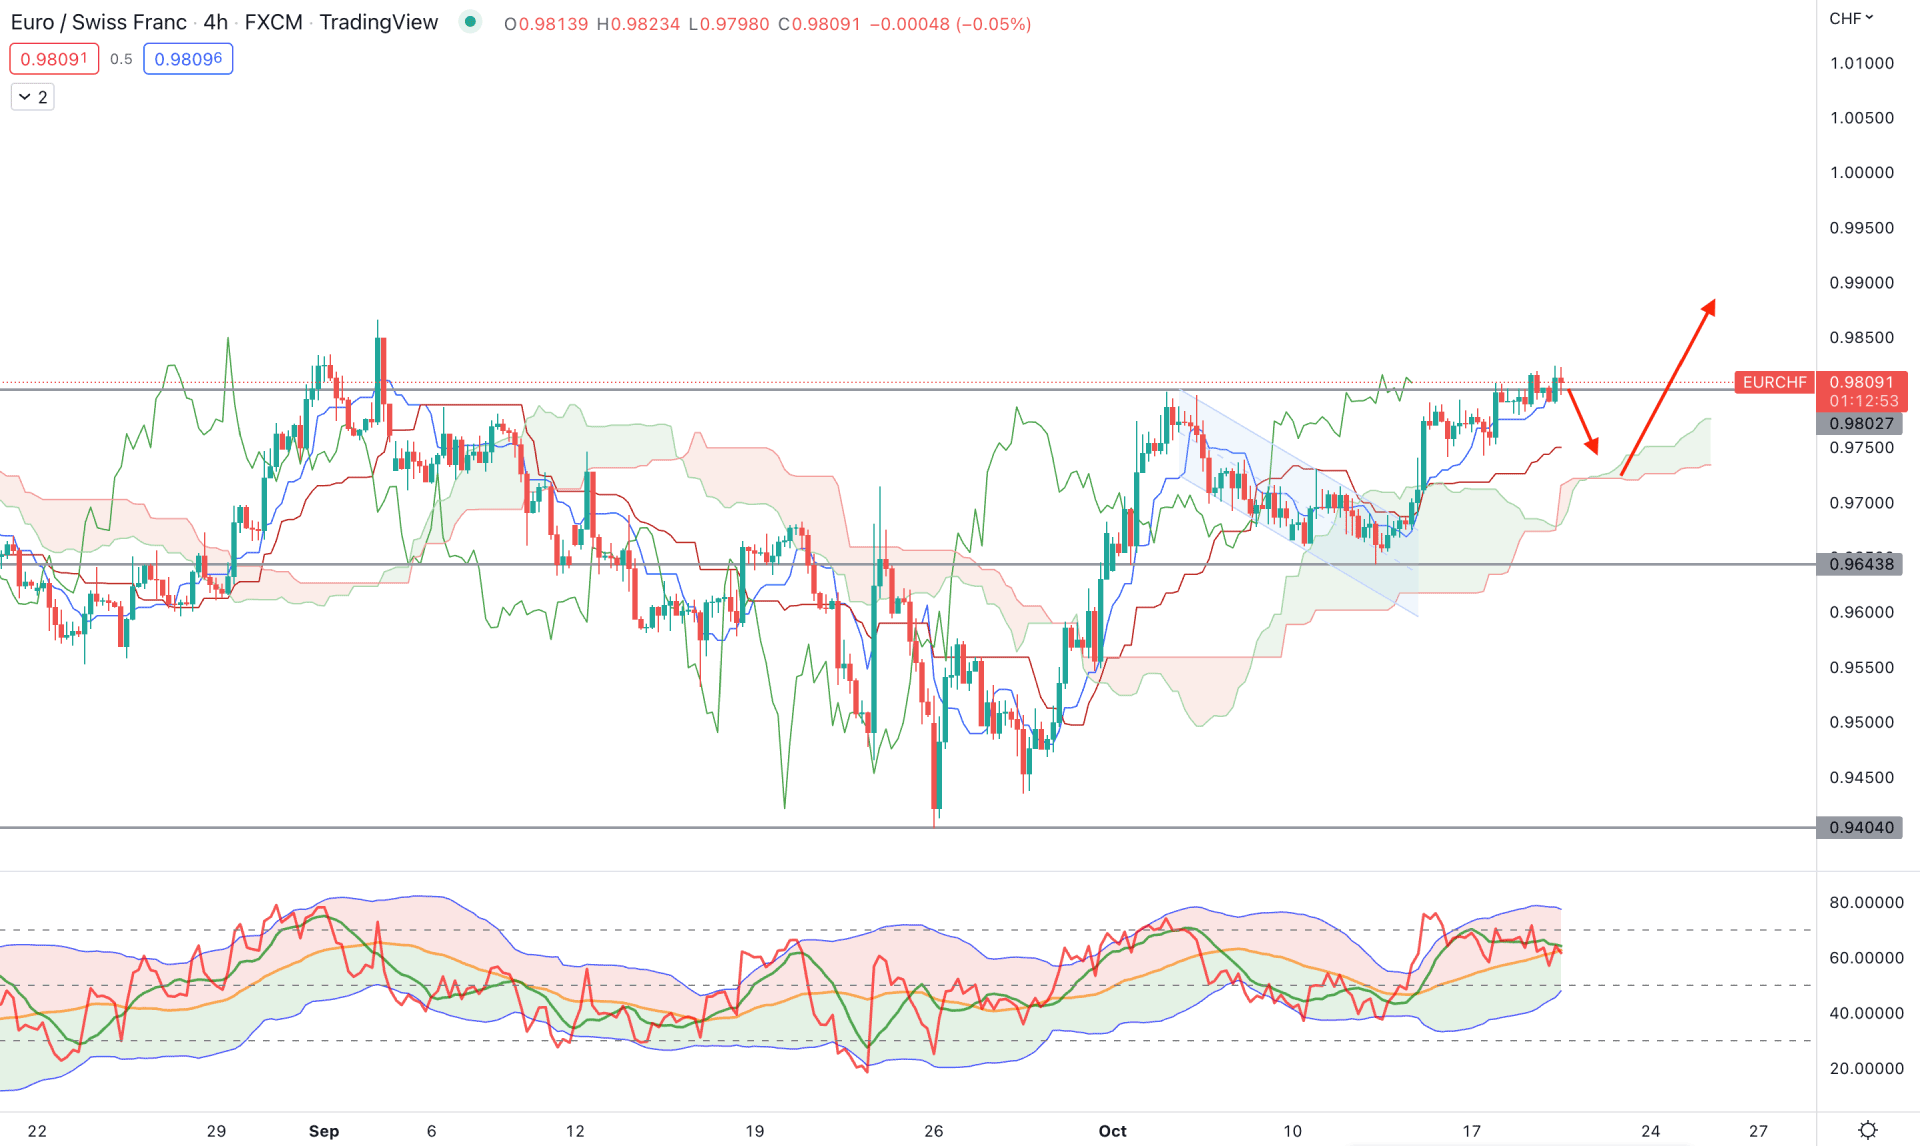
The overall market structure is supportive of bulls in the H4 timeframe, as the most recent prices are aiming higher above the Kumo Cloud level. Moreover, the future cloud shows buying pressure as the Senkou Span A is Above the Senkou Span B with upward momentum.
Dynamic Tenkan Sen and Kijun Sen are below the price and aiming higher, which could offer bullish pressure from the dynamic area. On the other hand, the Lagging Span is also above the price, signifying a buying momentum.
In the indicator window, the bullish possibility is still valid as the current TDI level is above the 50% neutral line, aimed at the overbought area.
Based on the H4 outlook, any minor bearish correction and bullish rejection from the 0.9650 to 0.9740 area could offer a long opportunity. In that case, a buying pressure with an H4 close above the Kijun Sen line would be a conservative approach.
On the other hand, the break below the 0.9640 level could offer a bearish opportunity, where the main aim is to test the 0.9400 key support level.
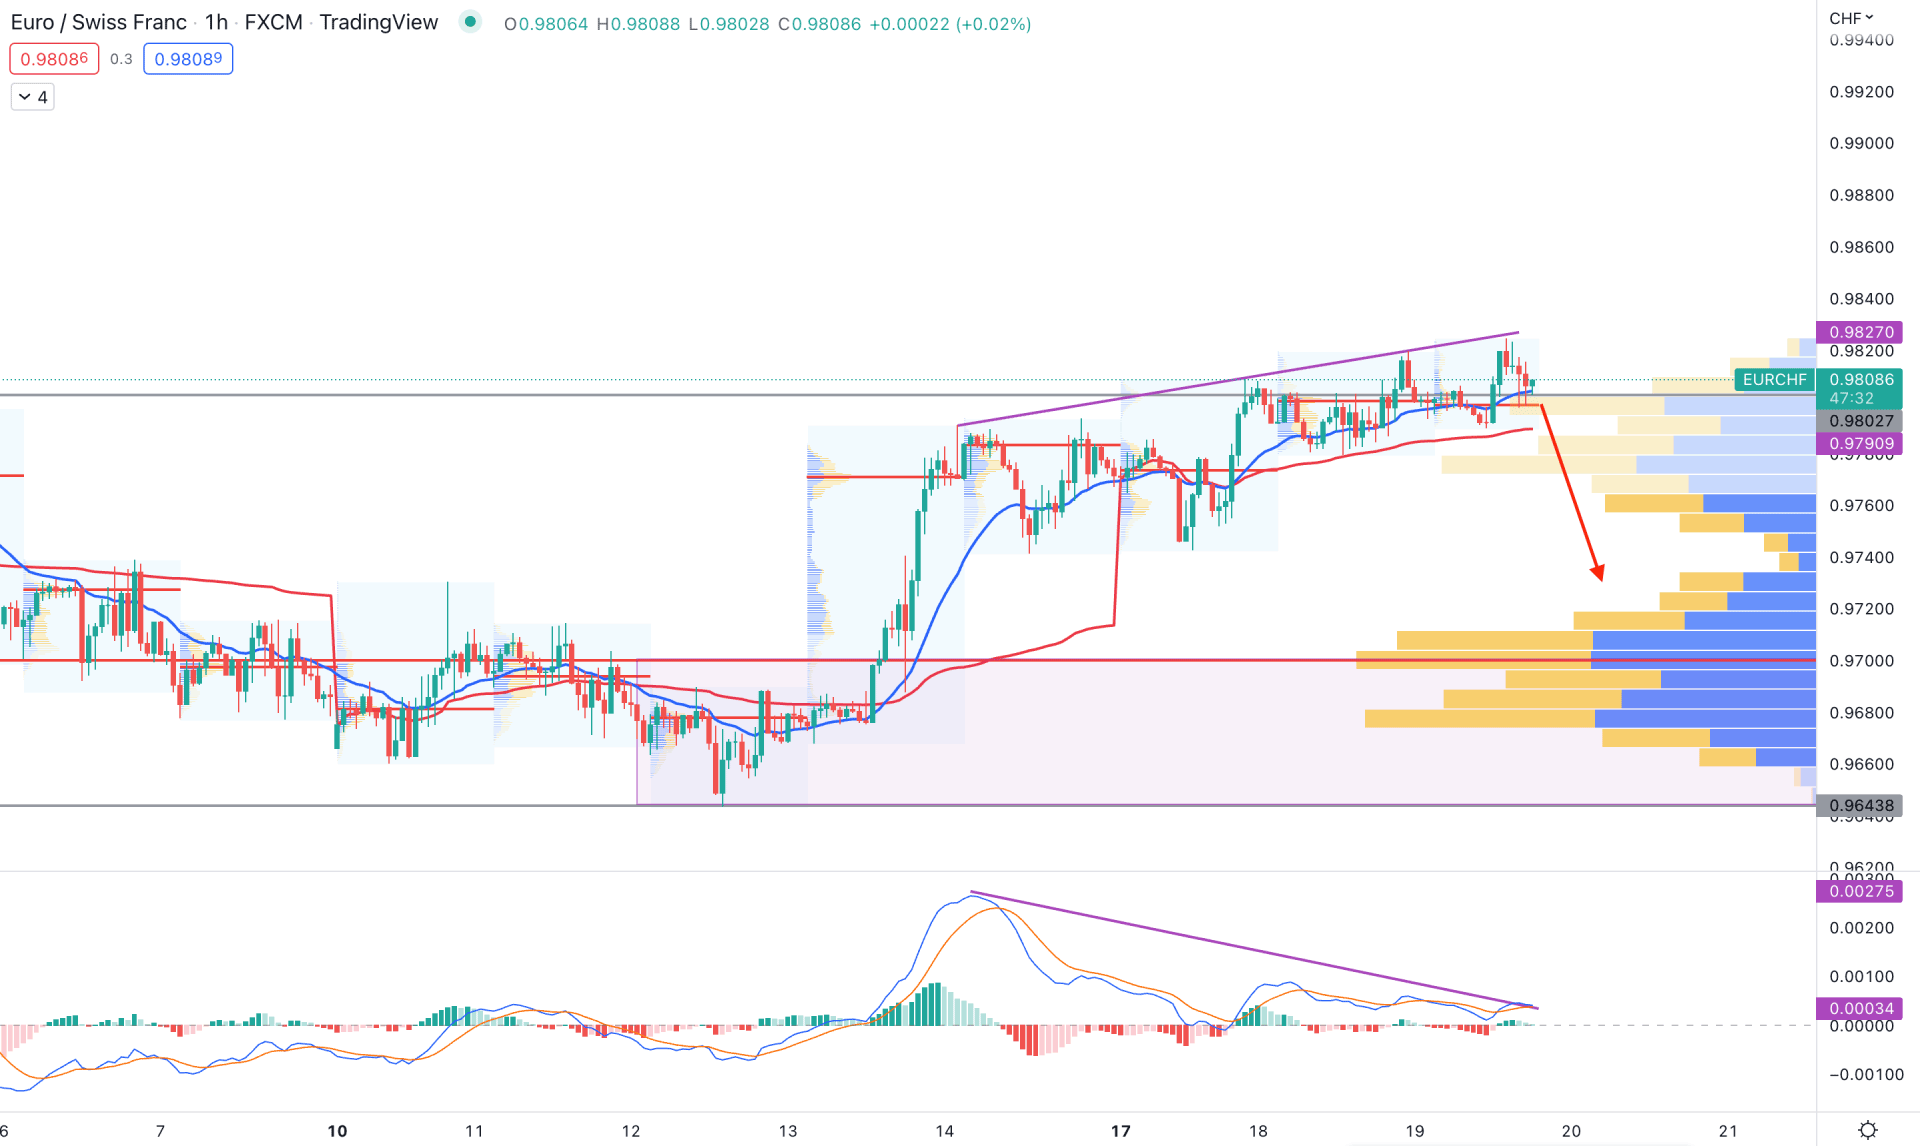
The H1 price action shows a corrective momentum, which needs a bearish correction before forming another bull run. The current price is above the visible range high volume level of 0.9700, indicating that the major outlook for this instrument is still bullish.
However, the divergence with MACD lines with corrective price action above the dynamic 20 EMA offers a possibility of a bearish correction in the coming hours.
Based on the H1 structure, a bearish correction and buying pressure from 0.9643 to 0.9710 could offer a bullish possibility in this pair. However, breaking below the 0.9640 level with a strong bearish H1 candle might eliminate the current outlook and increase the selling pressure toward the 0.9200 area.
Based on the current market structure, EURCHF is still in sellers’ zone but a bullish breakout above the H&S neckline could offer a buying possibility. In that case, investors should closely monitor the intraday price action to find the long opportunity from the near-term order block.


