
Published: August 18th, 2022
Eurozone inflation showed an unchanged momentum for Germany and France after reaching the 7.5% YoY and 6.1% YoY peak. Moreover, the spike in inflation came with a price surge in natural gas by over €200, pushing countries like Germany to fire up coal power plants. The Russian ban on supplying gas to the Eurozone is active, pushing Germany to look at the US and Australia for gas imports.
Industrial production for Europe came at 0.7% MoM, up from 0.2% expectation. However, the backlog from existing orders and downside pressure on new orders are still active, indicating a possible dark time for the European industry.
The Canadian Economy is in a better position than Europe, where the annual inflation for July came at 7.6%. The CPI report eased from the drop in gas prices by 9.2% in July. However, the Bank of Canada believes there will be more rate hikes this year, increasing the selling pressure on the EURCAD price.
Let’s see the future price direction from the EURCAD Technical analysis:
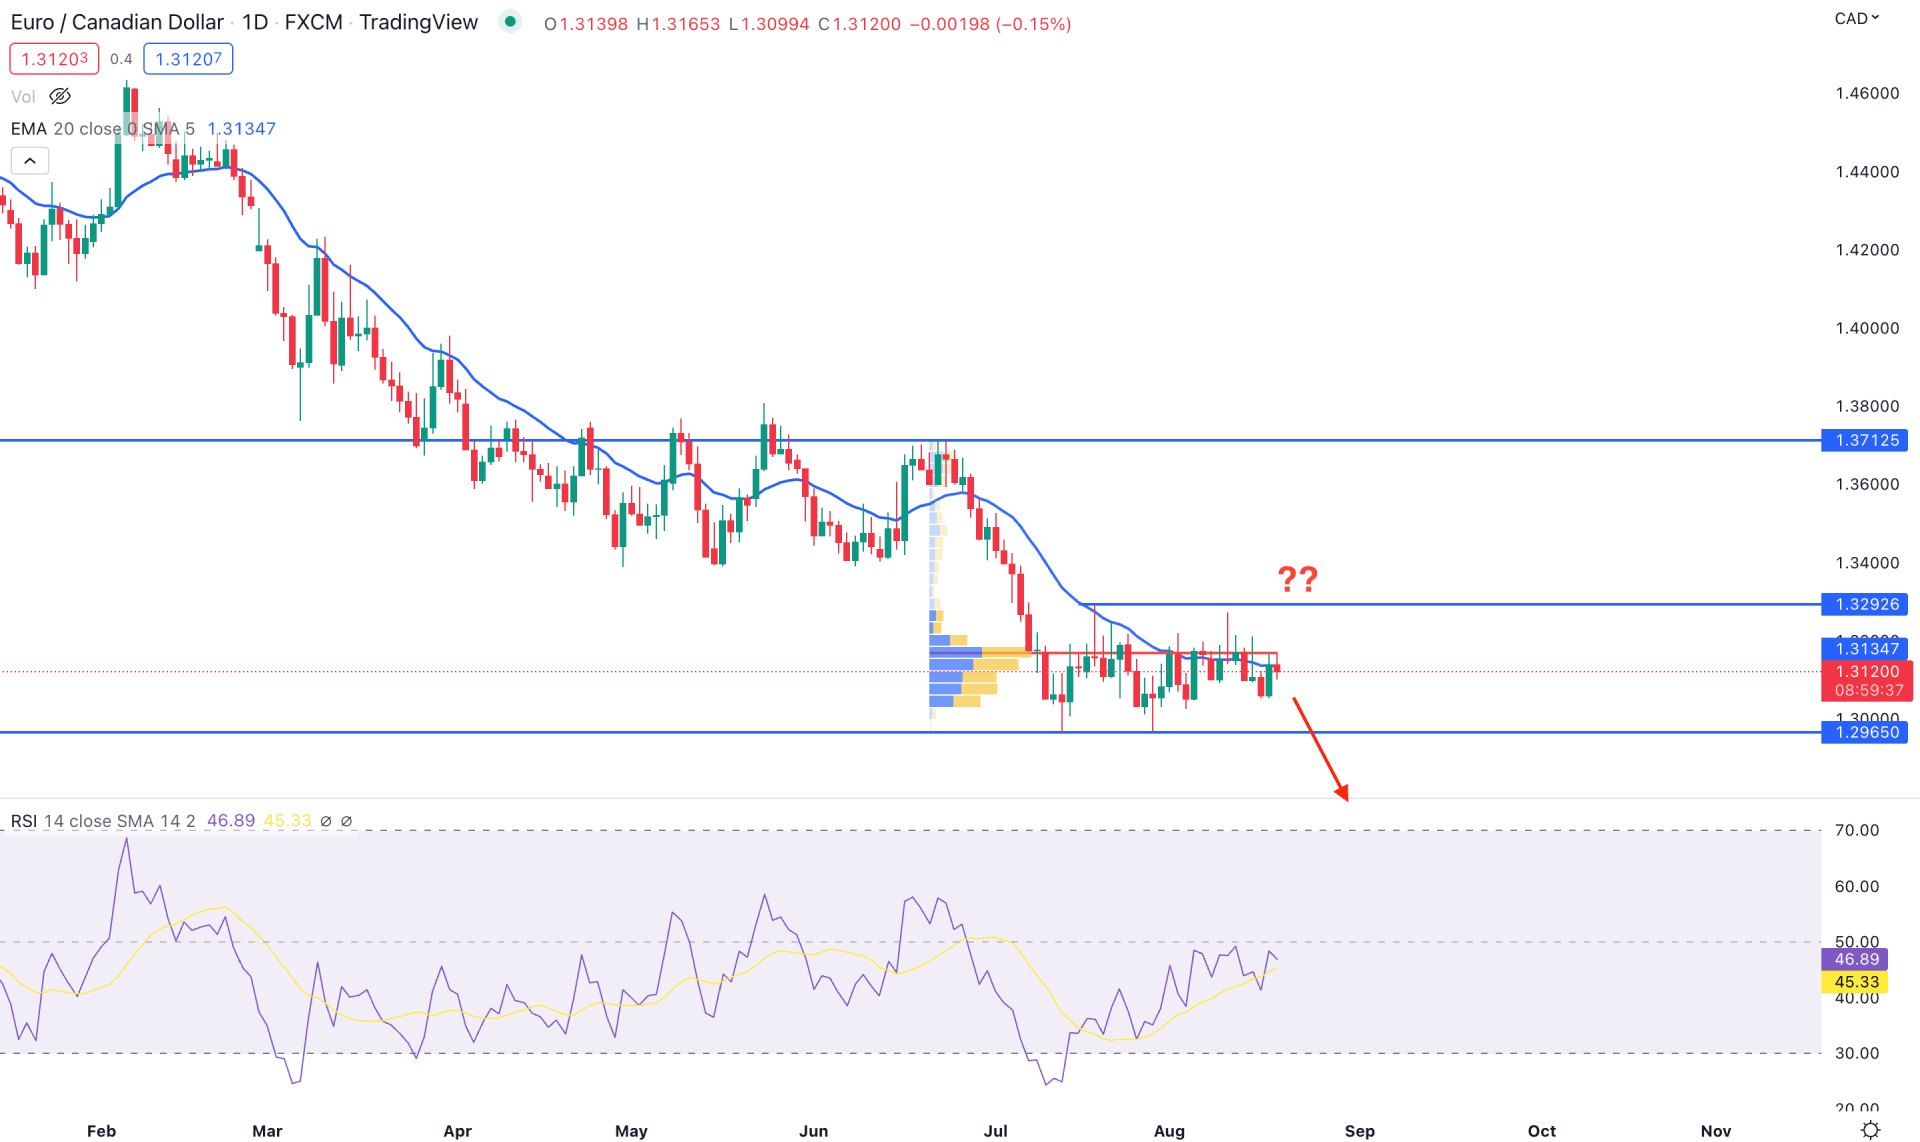
In the EURCAD daily chart, the existing market trend is bearish, starting from the 1.4600 key resistance level. Moreover, the bearish pressure extended after having a stable bearish momentum below the 1.3712 resistance level, pushing bears to have 700 pips of a rally.
The selling momentum is still valid as the price trades below the strong volume level of 1.3163, which came from the visible range trading volume indicator. Moreover, the dynamic 20-day Exponential Moving Average is also above the price, providing a minor resistance. In that case, investors should monitor how the price trades in the range between 1.2965 to 1.3292 to find a stable breakout point. Any bearish opportunity from the range breakout would provide a reliable short opportunity to traders.
Based on the daily price structure, investors should monitor how the price trades below the 1.3163 high volume level. Any bearish opportunity from 1.3165 to 1.3100 would open a bearish possibility towards the target of 1.2900 area. On the other hand, the alternative approach is to find the price above the 1.3300 level with a bullish daily candle to consider the current bearish opportunity invalid.
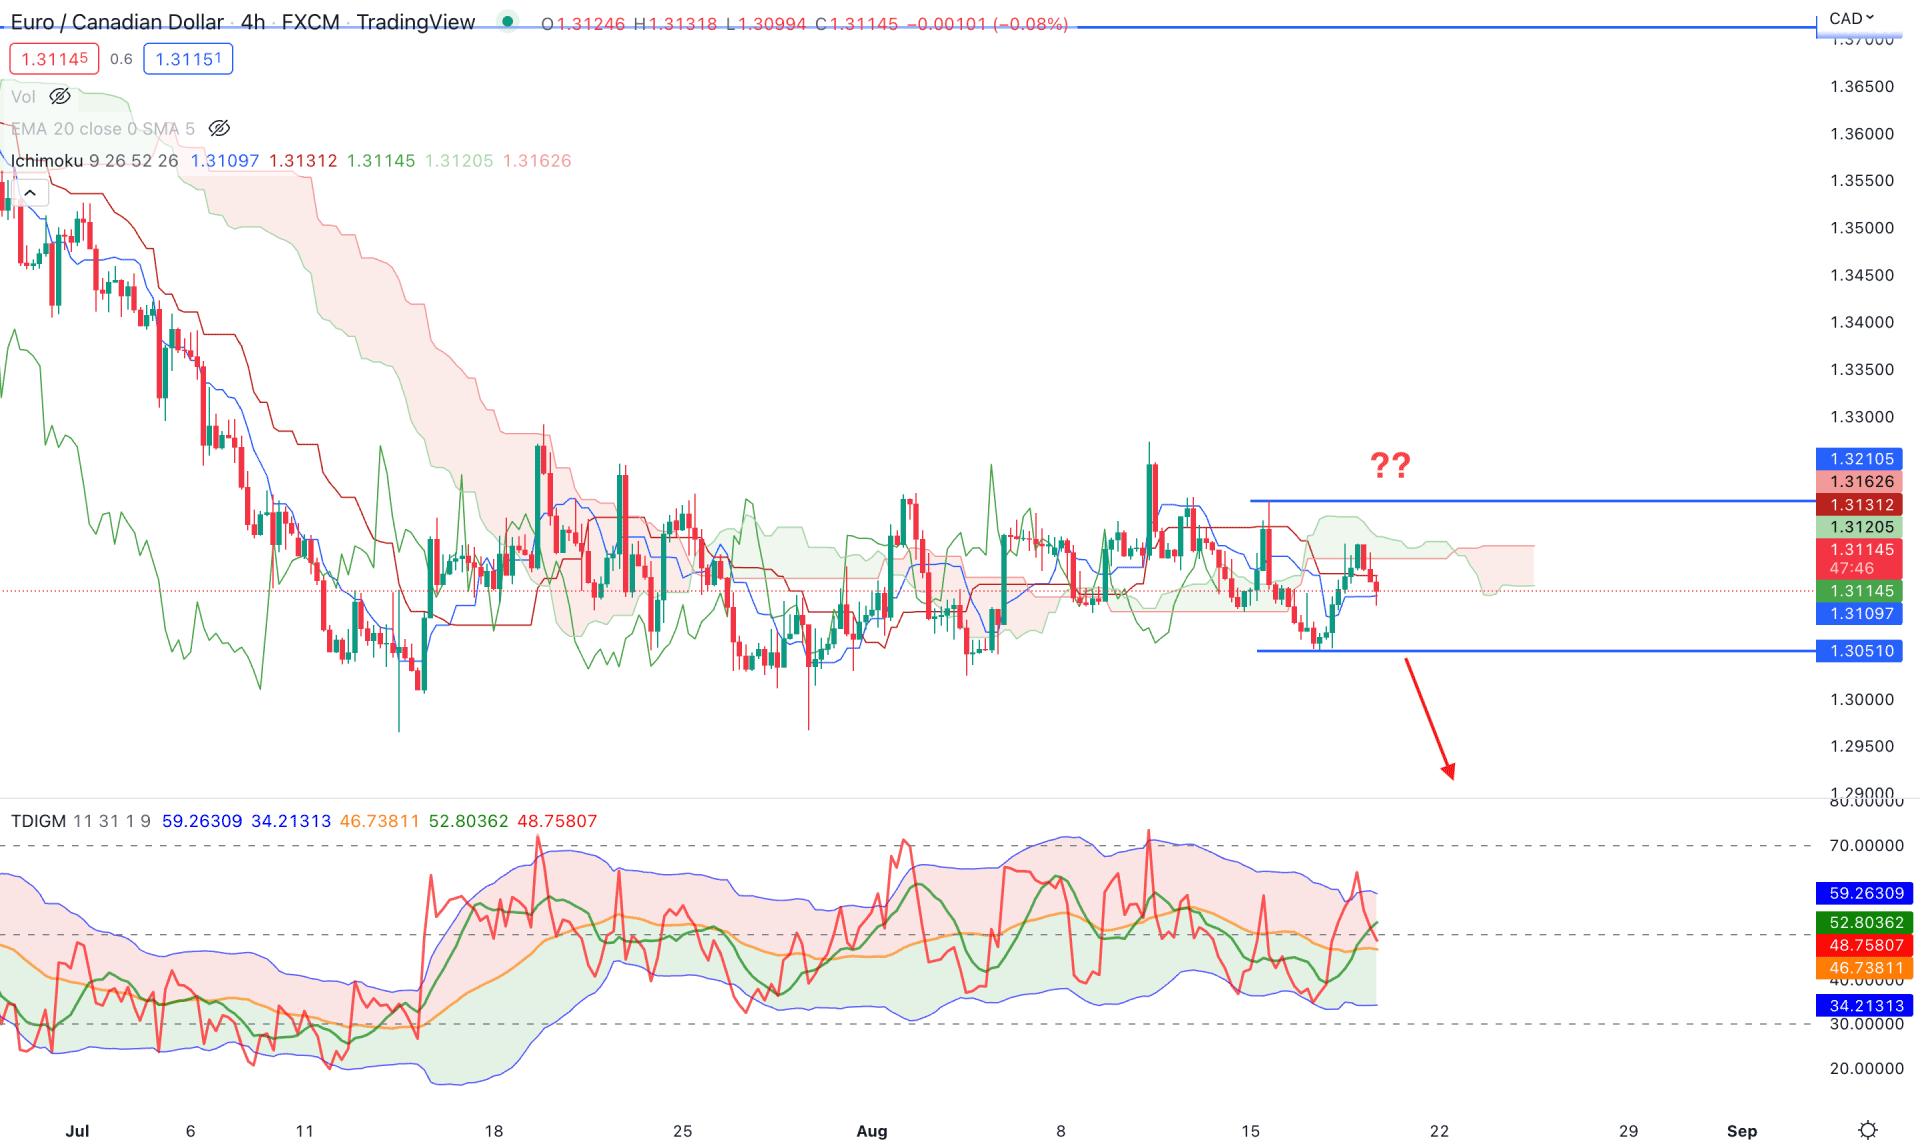
In the H4 chart, the Ichimoku cloud shows that the EURCAD price is trading with a bearish opportunity where the current market momentum is extremely corrective. The price went volatile from 11 July 2022, when several violations above or below the Kumo Cloud were seen. However, in the latest price action, the future cloud is bearish where Senkou Span A and B are flat.
In the indicator window, the Trades Dynamic Index showed a rebound after visiting the overbought zone, where the current TDI level is at 50% area. On the other hand, the dynamic Kijun Sen is still below the price that sellers should take out.
Based on the H4 context, investors should wait for a bearish breakout in this pair, where a bearish H4 close below 1.3051 could increase the selling opportunity towards the 1.2900 key level. On the other hand, a bullish break-of-structure with a candle close above 1.3210 could alter the current market structure by eliminating the short opportunity.
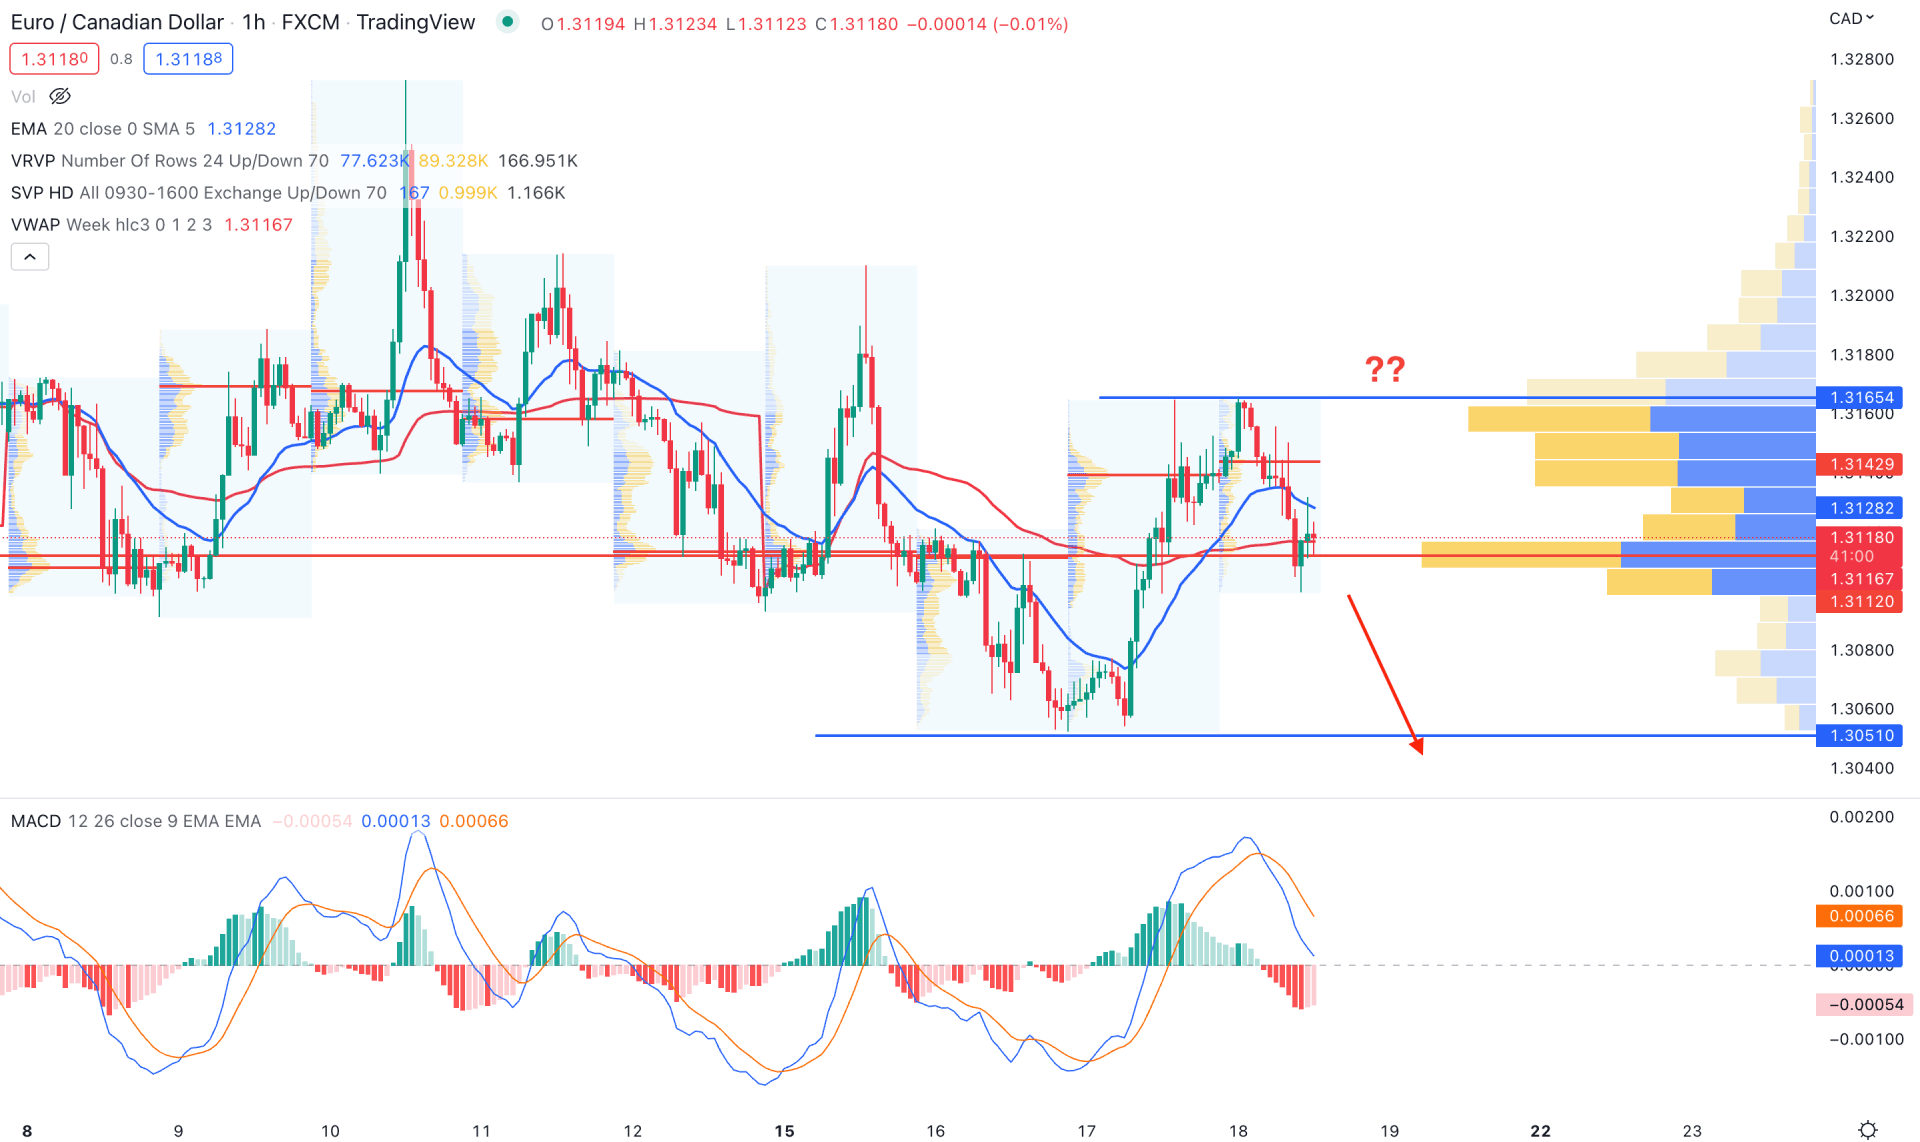
In the EURCAD H1 chart, the broader market sentiment is corrective, where a strong breakout is needed to rely on the upcoming price direction. Based on the visible range volume, the intraday high volume level is 1.3118, which is at the current price. In that case, investors should find the price below this high volume level with a candle close before opening a short trade.
On the other hand, the dynamic 20 EMA and weekly VWAP are above the price, showing a corrective momentum. The intraday high volume level is at 1.3142, which is below the current price.
Based on the H1 price action, a bearish H1 candle below 1.3051 could open a bearish opportunity in this pair towards the target of the 1.2900 level. However, if the price fails to overcome the visible range volume level, it could increase higher where a bullish H1 candle above the 1.3165 would eliminate the current bearish possibility.
Based on the current multi-timeframe analysis, the EURCAD bearish possibility is solid from the long-term trend. In that case, investors should monitor the intraday price action, where the bearish range breakout could hint at a possible trading opportunity.


