
Published: June 11th, 2025
Last Thursday, the European Central Bank (ECB) at the other end of the Atlantic lowered its savings rate by 25 basis points to 2.00%. President Christine Lagarde's statement had a surprising hint of hawkishness.
Given that the growth projections were a little stronger than most anticipated, that might be the final cut for some time. "The ECB is now in a good position to deal with the problems that are coming up," Lagarde said. She indicated neither a drive for a stricter policy nor a new round of easing by not pointing to any upcoming rate reductions and by making it plain that only a significant increase in trade disputes would alter that position. Rather, Lagarde remained "steady as she goes."
Data from the CFTC indicates that the European currency is becoming more optimistic. Overall public interest increased over 781K contracts, the most significant level in the previous three years, while net long positions reached a three-week record of about 82.8K contracts. Commercial hedgers increased their short-term positions to around 138.3K contracts, indicating that institutional interest in controlling Euro upside risk is expanding.
The Canadian dollar (CAD), which is tied to commodities, may find support from the higher crude oil prices. As of this writing, the price of a barrel of West Texas Intermediate (WTI) oil is still above $64.00. Reducing trade tensions between the United States and China generates good risk sentiment, which supports crude oil pricing.
Let's see the upcoming price direction of EURCAD based on the technical analysis:
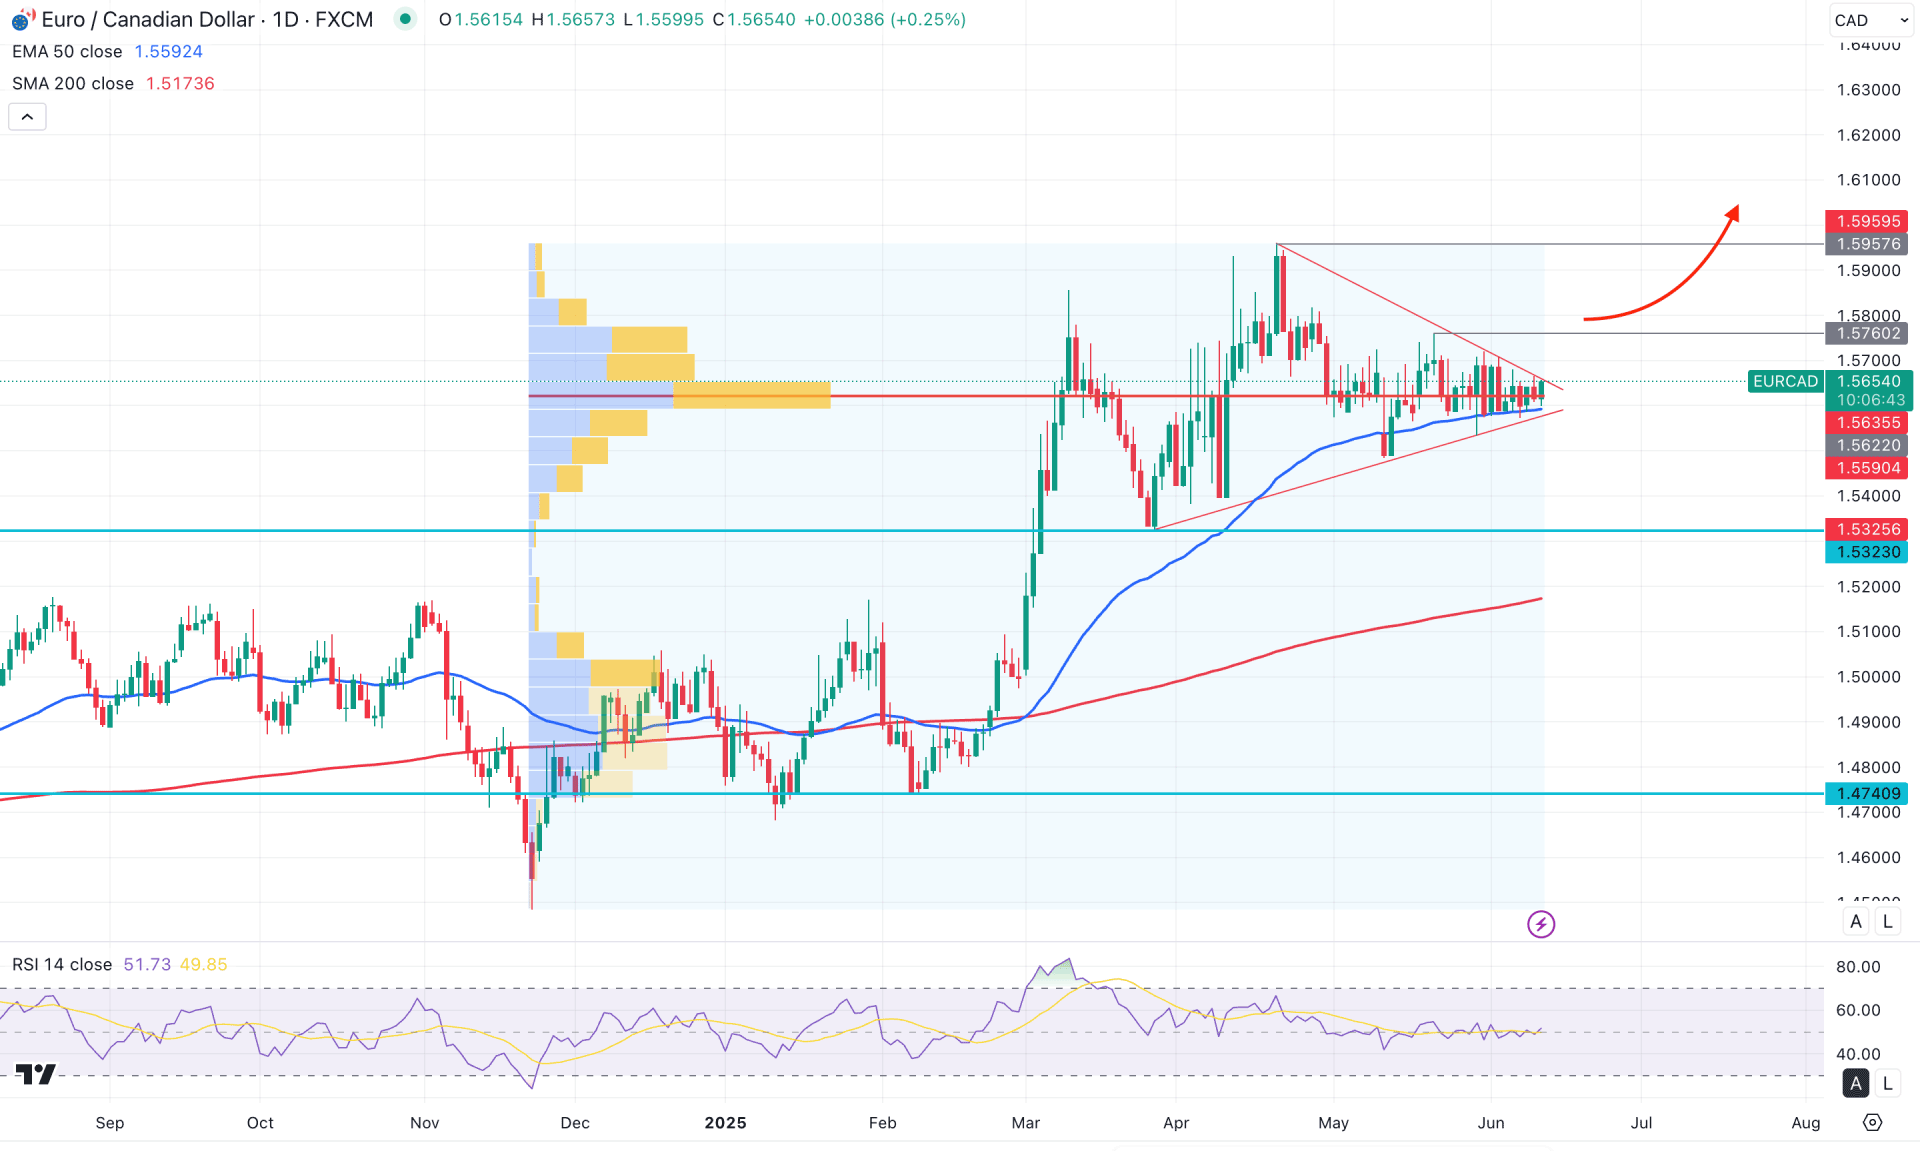
In the daily chart of EURCAD, the recent price action is bullish after sweeping the liquidity from the June 2024 low. After forming a bottom at the 1.4480 level, the price consolidated before advancing toward the 2020 high. With the current price trading sideways near the yearly peak, buying pressure may continue to dominate.
The monthly candlestick chart indicates a sideways consolidation following March 2024's strong bullish candle. Two consecutive doji candles suggest a potential breakout within the prevailing trend.
The most significant volume activity occurred in November 2024 at the 1.5622 level, which now acts as nearby resistance. Recent price action reflects indecisive momentum, likely signalling order block accumulation before the next directional move.
The 200-day SMA serves as major support, while the 50-day EMA provides dynamic near-term support. As long as these levels hold, the bullish bias remains intact. However, a rejection near the 1.5622 resistance could trigger a liquidity sweep downward before any sustained upward movement.
The RSI has been oscillating around the neutral 50.00 level for over a month, reflecting balanced momentum. A sustained push above 56.00 could reinforce bullish strength, potentially driving the RSI toward the 70.00 overbought zone.
A bearish breakdown below the 50-day EMA, followed by a retest as resistance, may offer a shorting opportunity with a target at 1.4711. Conversely, a decisive breakout above 1.5760 could open the path for a long trade targeting 1.6200. Should selling pressure emerge, a pullback toward 1.5323 may attract buyers, but a close below the 200-day EMA would invalidate the bullish structure, potentially extending losses toward the 1.4740 low.
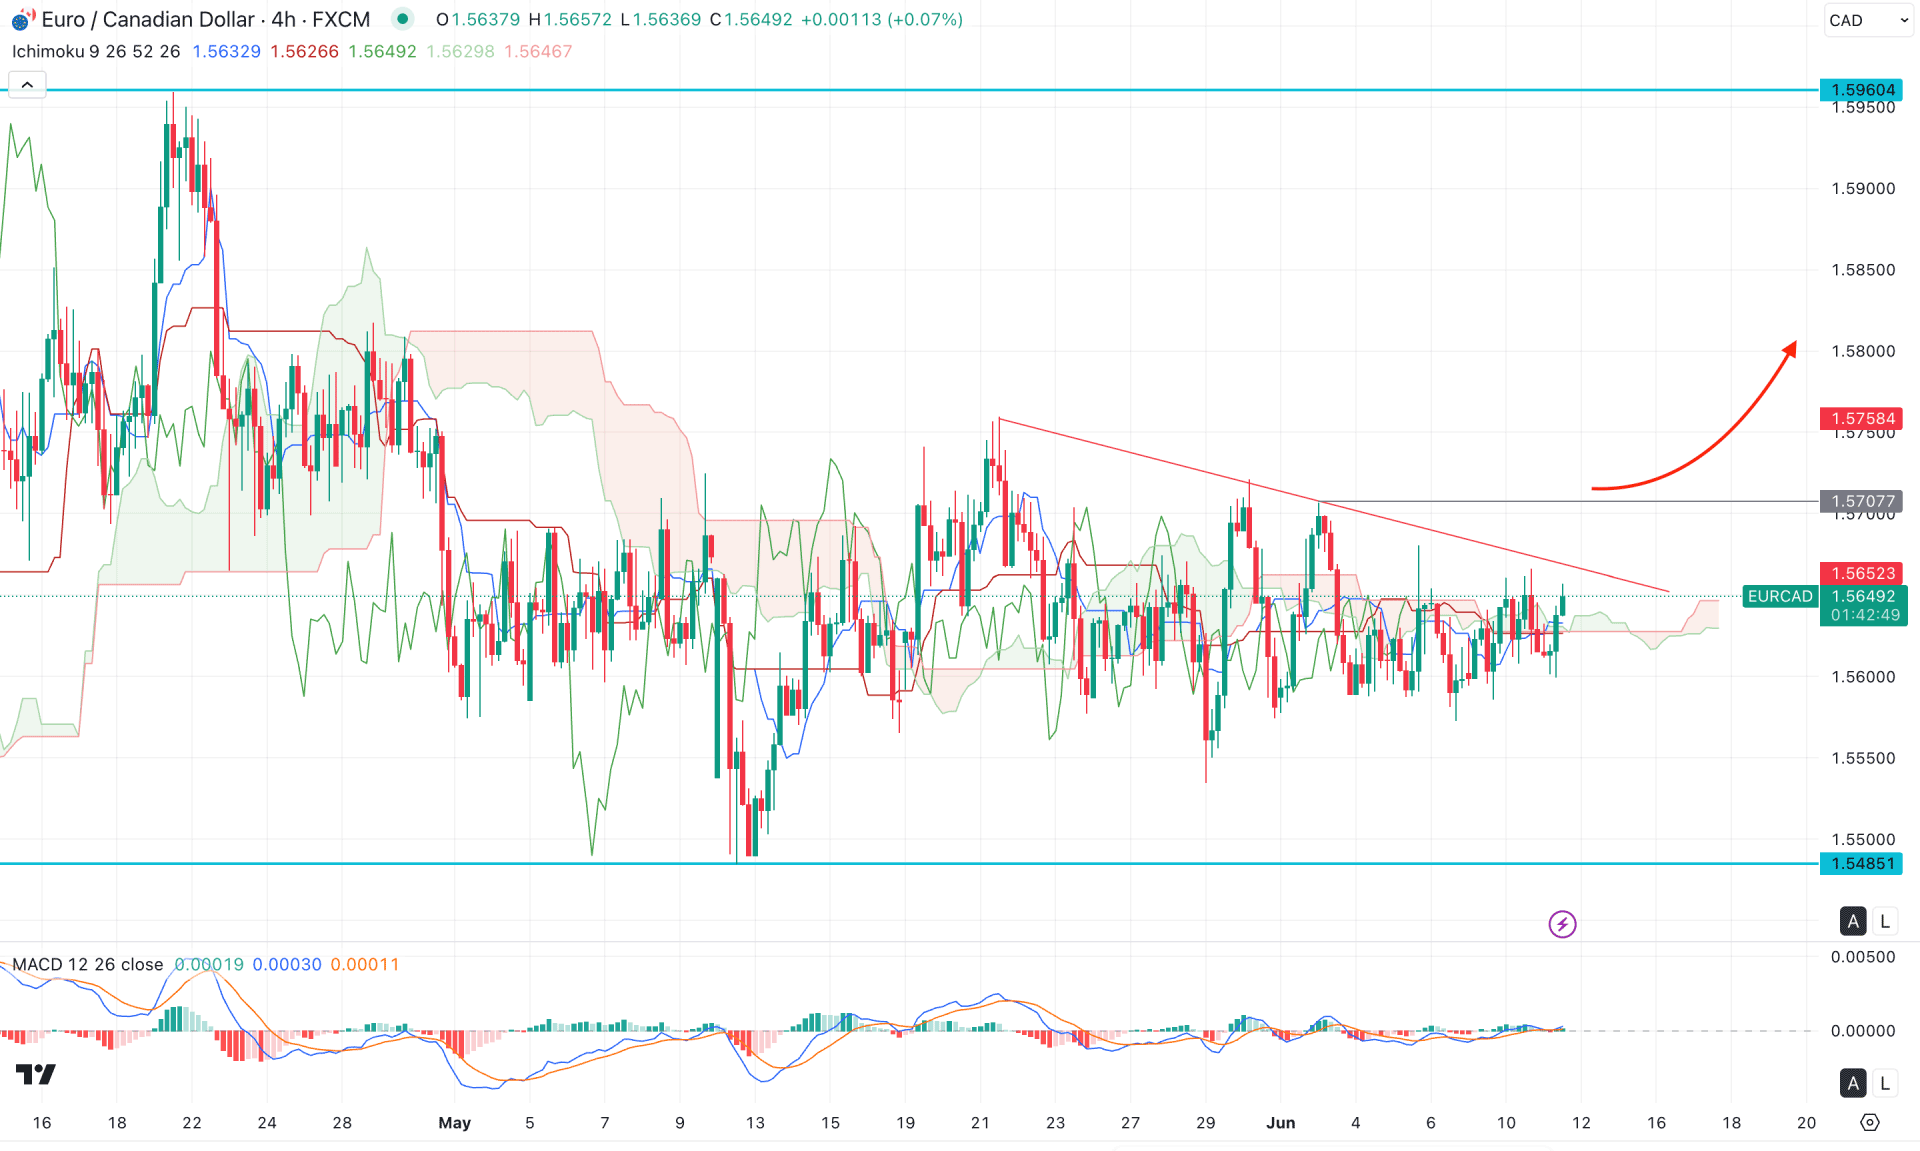
In the H4 timeframe, the recent price is trading within a volatile market structure as no clear trend is visible at the dynamic Ichimoku Kumo Cloud zone. As the dynamic Tenkan Sen and Kijun Sen are closer to the current price, more confirmations are needed before anticipating a stable trend.
In the indicator window, the MACD Signal line and Histogram are closer to the neutral point, which signals an indecision. Moreover, the Future Cloud has aimed higher where the Senkou Span A is still below the Senkou Span B.
Based on the current outlook, the bullish market structure is valid as long as the price is trading above the dynamic Ichimoku Cloud area. Primarily, a bullish trendline breakout with a consolidation above the 1.5707 high could be a potential long opportunity, aiming for the 1.5960 high.
The alternative trading approach is to find the price below the Ichimoku Cloud zone, as it might create a dip below the 1.5550 level before offering another long opportunity.
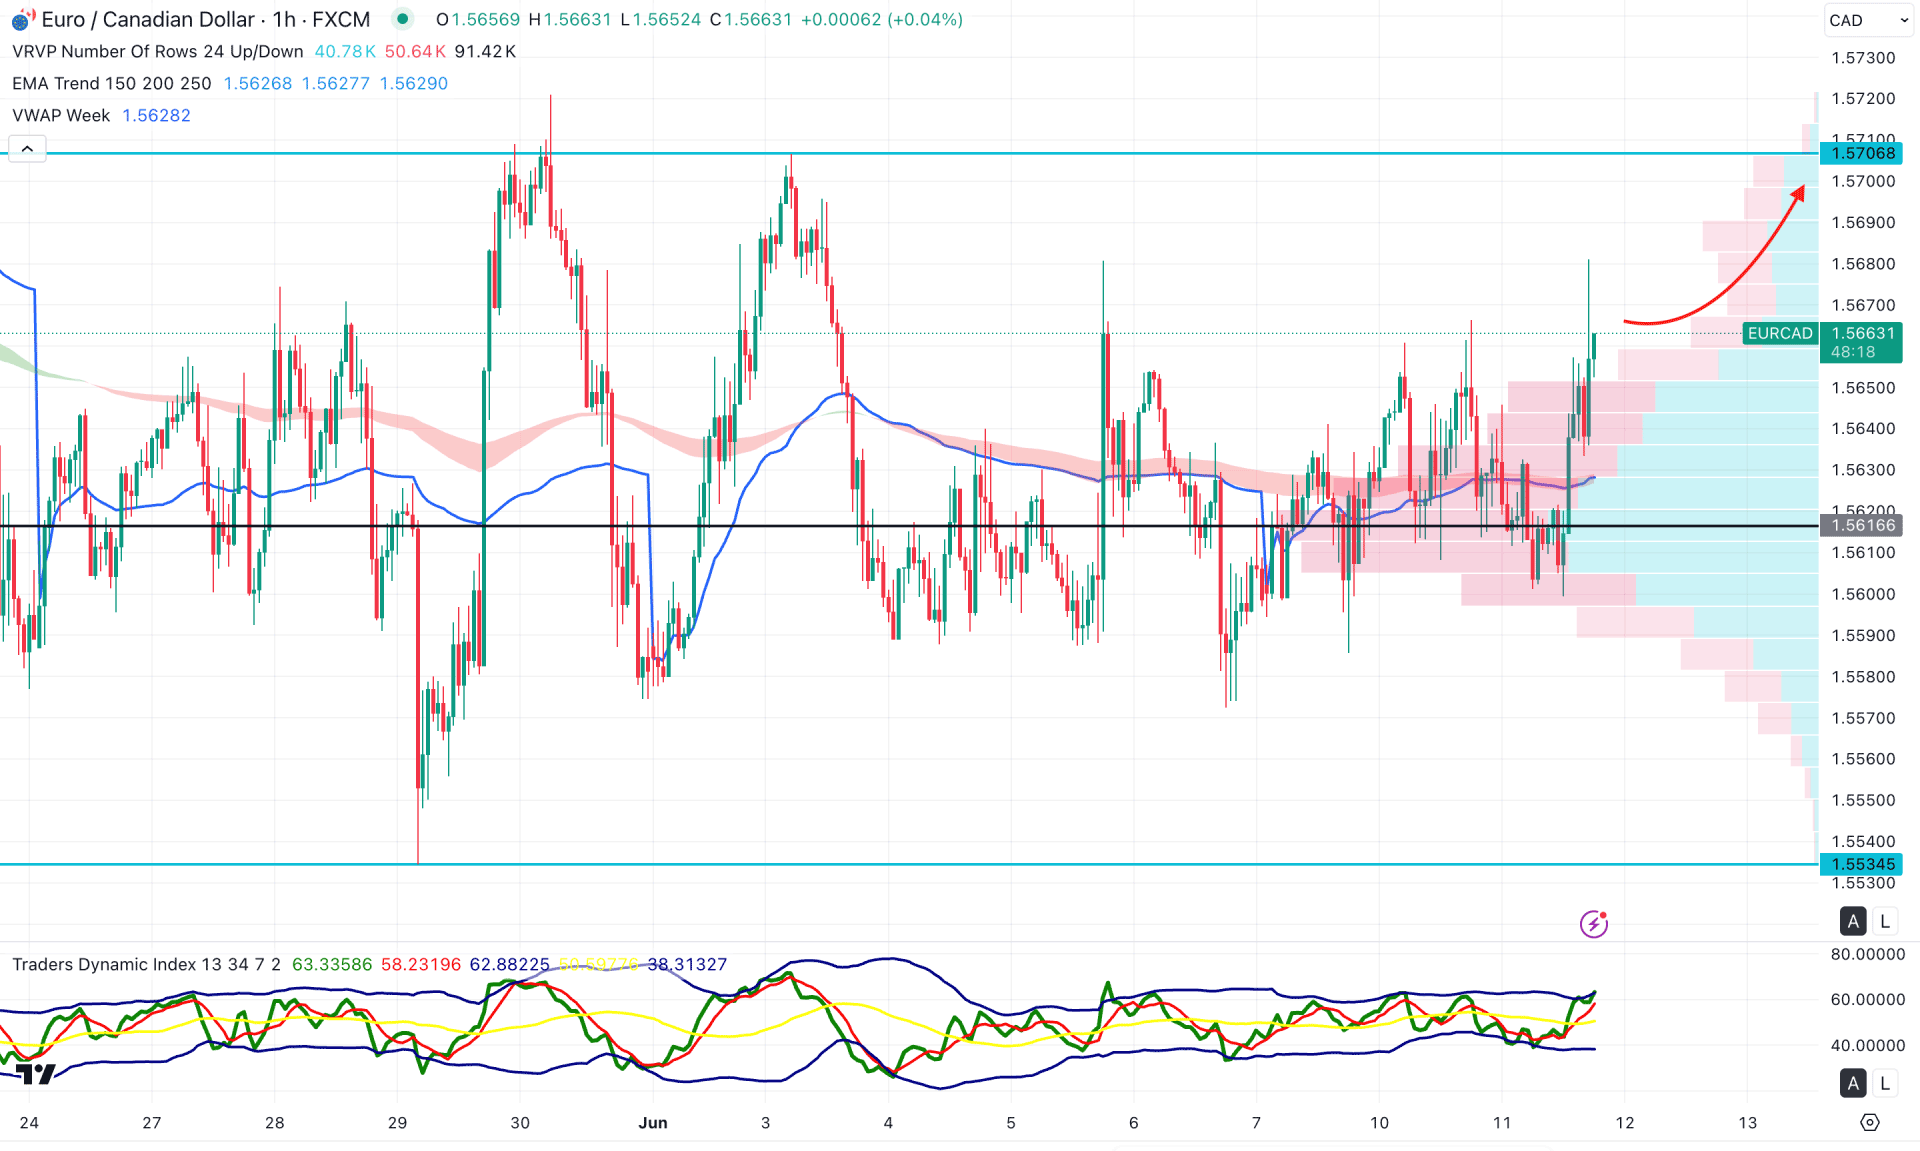
The hourly chart of EUR/CAD shows high volatility with no clear direction. Investors should monitor how the price reacts to the near-term support and resistance levels before anticipating future price movements.
Currently, the key support level is below the moving average, where both lines act as support. Additionally, the dynamic VWAP line is also below the current price, serving as immediate support. As long as the price remains above these dynamic levels, it is more likely to move higher and test the range high.
On the other hand, the Traders Dynamic Index (TDI) has reached the upper peak, signalling active buying pressure in the market.
Based on the hourly outlook, the ongoing buying pressure from the highway line could extend and face resistance at the 1.5706 level. If the price overcomes the range high, it could validate the long-term bullish trend, as seen in the daily chart.
Based on the current market structure, EURCAD is more likely to extend the buying pressure once the bullish continuation is validated in the daily chart. As the current price is still trading within a sideways market, a bullish symmetrical triangle breakout could be the first sign of the bull run.


