
Published: June 22nd, 2021
European Central bank policymakers are not in unity regarding the new inflation strategy. However, they are still hopeful regarding the agreement, but investors should unite before the pandemic-fighting program in September.
According to the consensus at the June 18-20 gathering, ECB may tolerate the inflation rate to its new goal of 2%, but details about the inflation report may come at the September 9 meeting.
On the other hand, the impressive rally in Crude oil caused a CAD strength last Monday. Therefore against the US Dollar, CAD recovered almost 0.2% in a single day after losing nearly 100 pips.
Due to the impressive demand outlook, West Texas Intermediate (WTI) reached the highest level since October at $73.98 on Monday. Later on, the price has lost almost 1% before the American Petroleum Institutes (API) weekly crude oil stock report. Currently, the loonie’s worth mostly depends on the next Crude Oil move where any strength could create a bearish pressure on the EURCAD price.
Let’s see the future price direction from the EURCAD technical analysis:
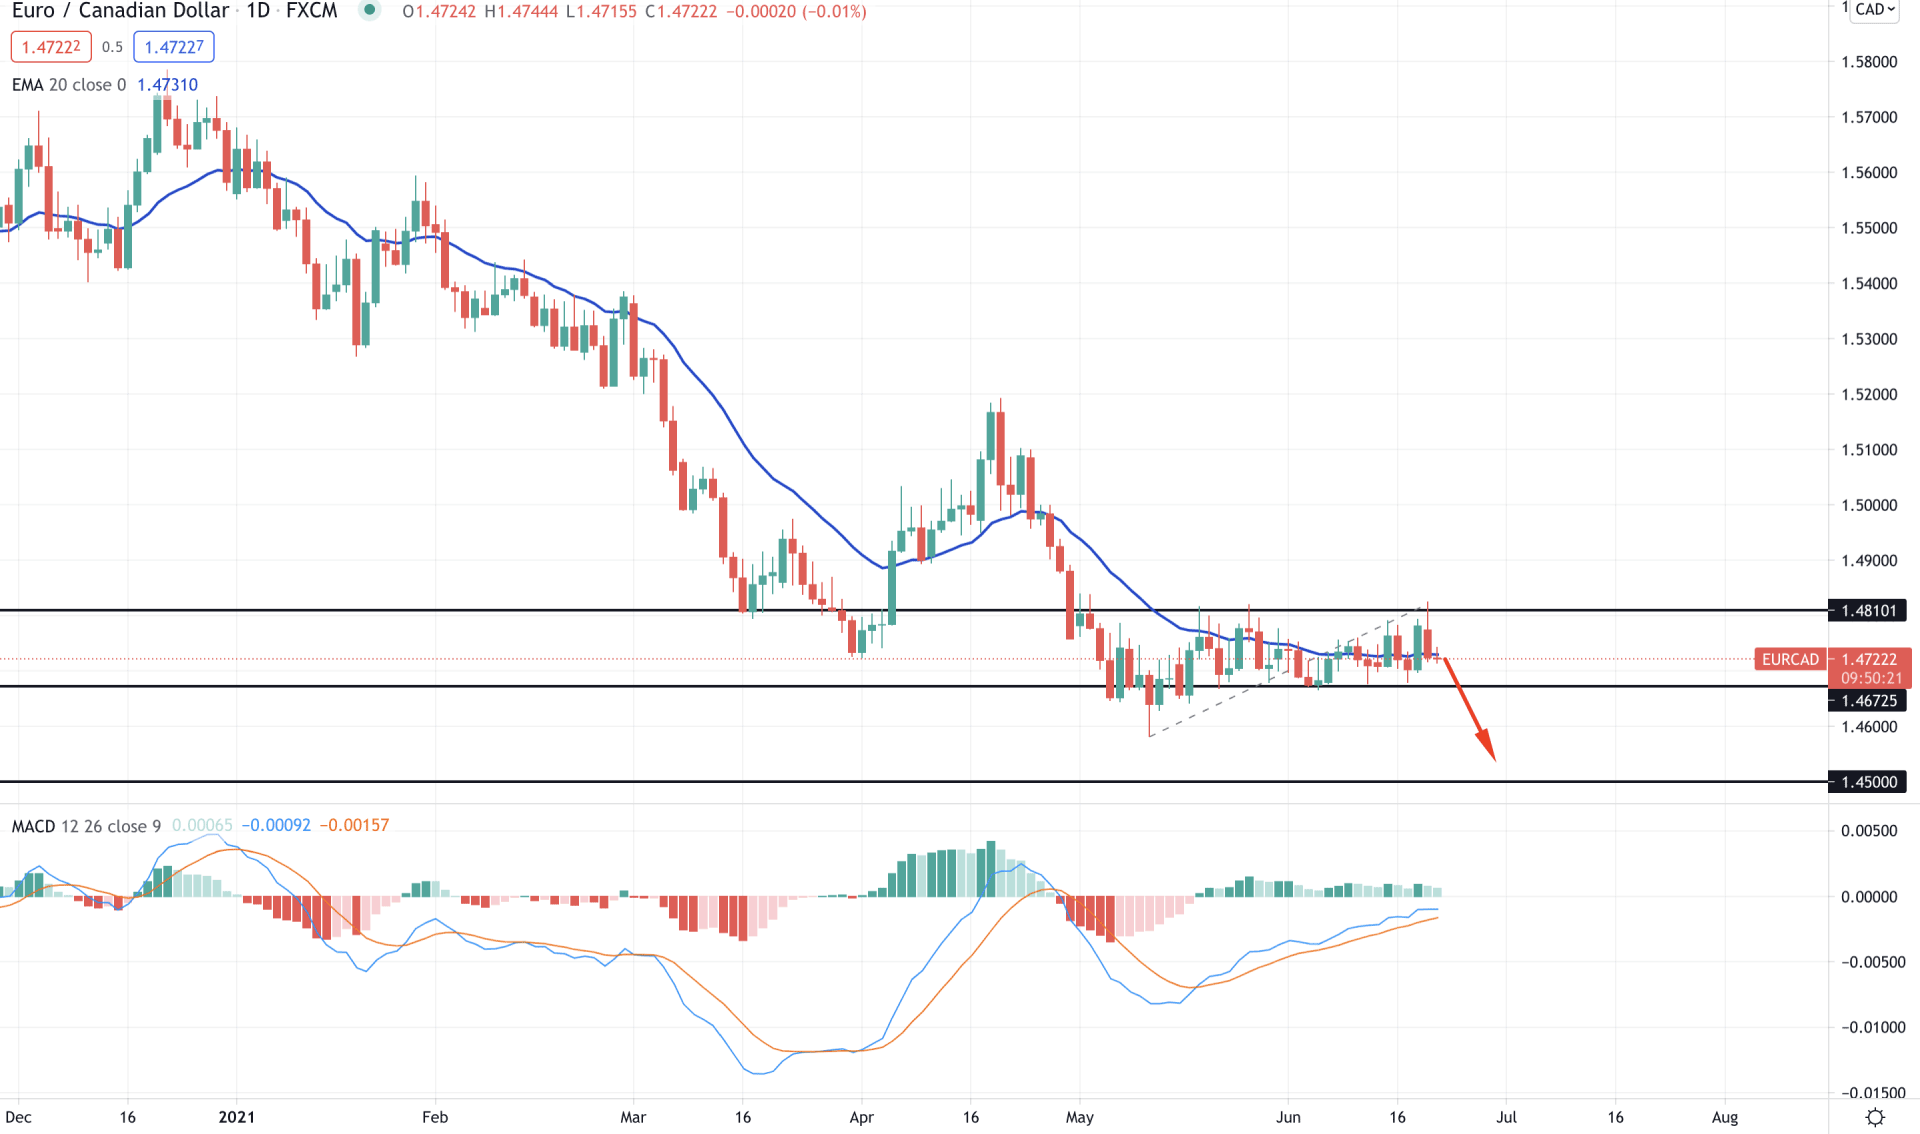
Since February 2021, EURCAD has pushed lower by creating multiple lower lows in the price. However, the most significant movement was from 1.5194 to 1.4582, with more than 600 pips loss in 17 days. Therefore, as the current price ranges after this 600 pips move, sellers may regain the momentum and make a new low.
In the above image, we can see the daily chart of EURCAD, where the price ranges between 1.4810 to 1.4625 level for almost a month. The price tried to break above the 1.4810 level within this time but closed with a bearish daily close yesterday.
Moreover, the dynamic 20 EMA is still within the price in the daily chart, indicating an extreme correction. As the last daily candle of Monday was rejected from the 1.4810 resistance level, any new bearish daily close below the dynamic 20 EMA may create strong downside pressure on the price.
On the other hand, MACD remained bullish where Histograms are making lower highs. Therefore, any new Histogram below the zero levels may initiate the bearish pressure towards the 1.4500 level.
Based on the Ichimoku cloud analysis, the EURCAD is going through extreme volatility where there were multiple false breaks in the price from Kumo Cloud. The price is still below dynamic Tenkan Sen and Kijun Sen, but the future Cloud remains bullish.
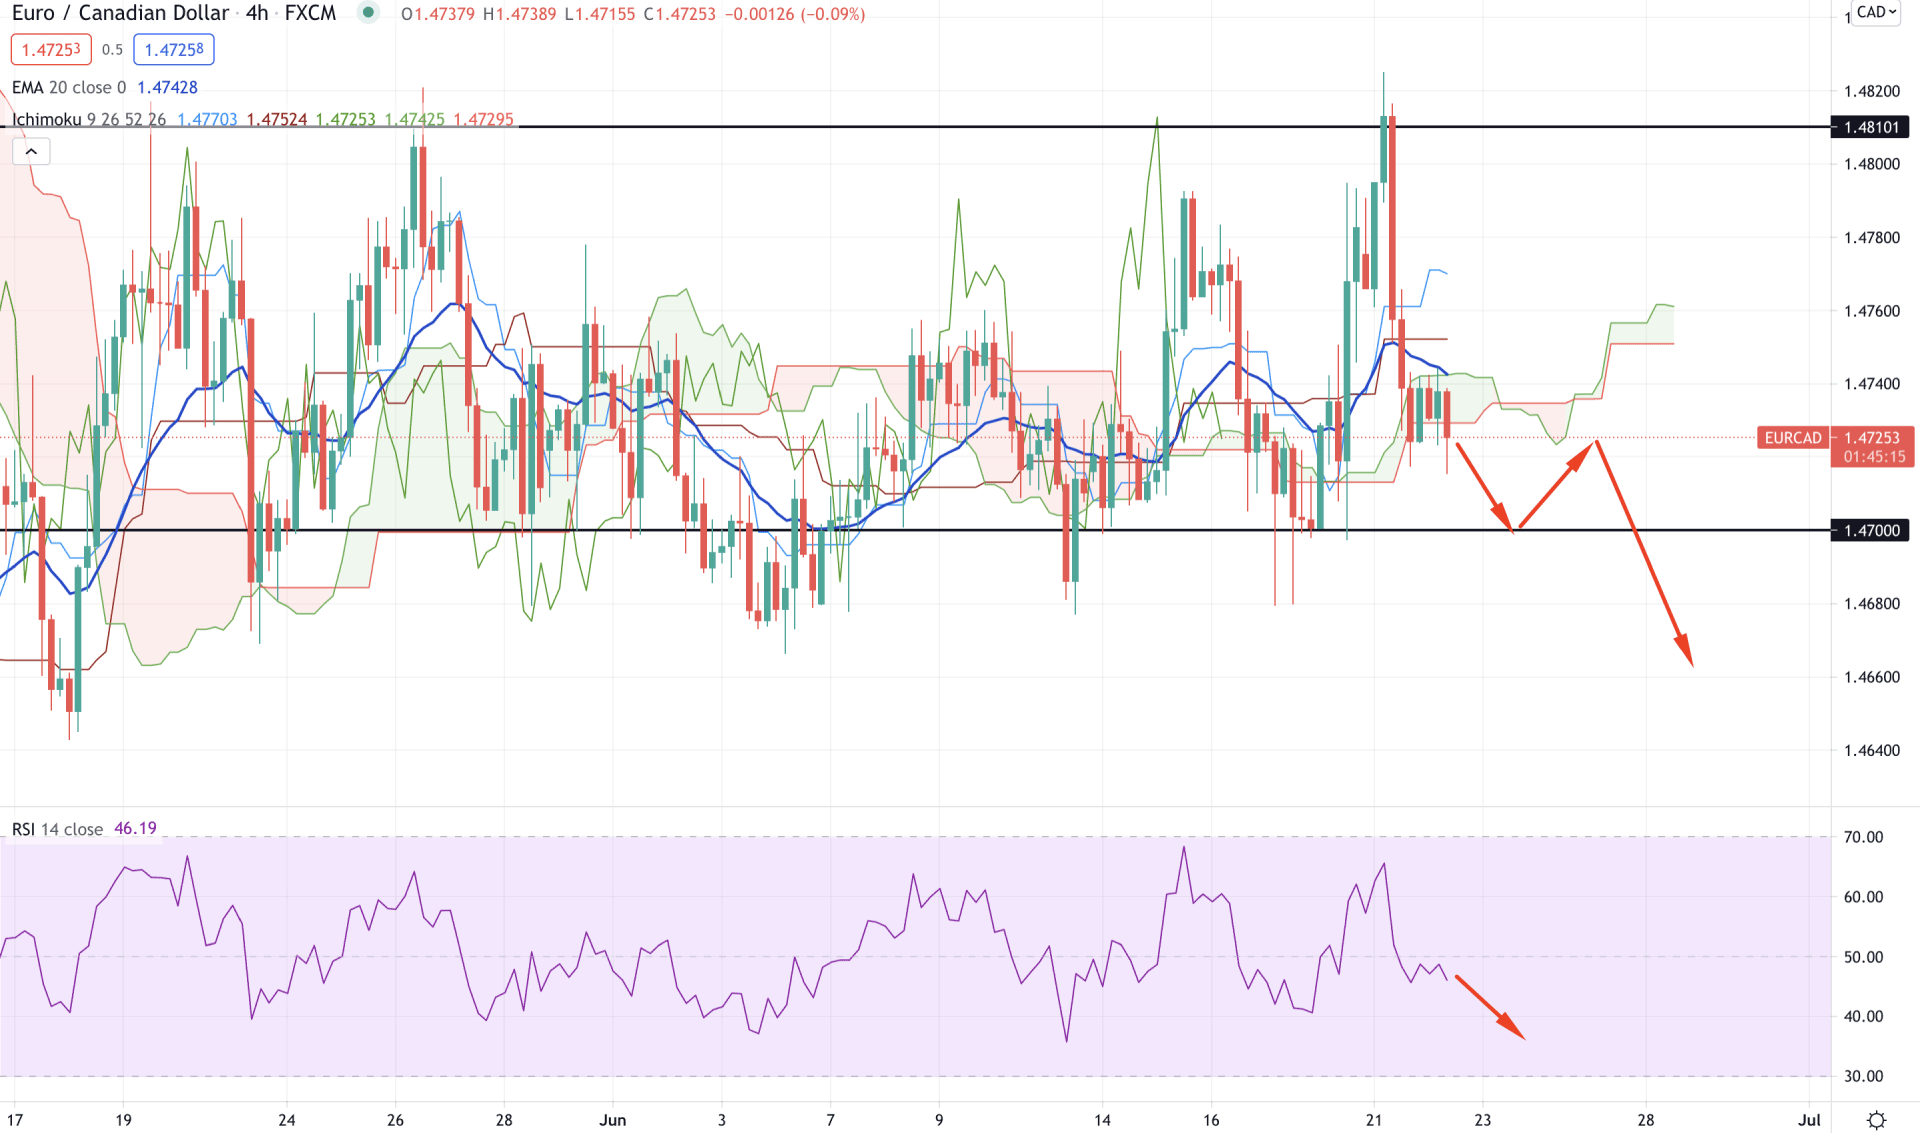
In the above image, we can see the h4 chart of EURCAD, where the price is hovering at the Kumo Support level. Therefore, as dynamic Tenkan Sen and 20 EMA provide resistance to the price, any bearish h4 close below the static 1.4700 support level may initiate a bearish movement in the price.
Besides, RSI is moving lower from the 65 levels that may test the 30 levels in the coming session. On the upside, any strong rebound from the Kumo support level with a solid bullish h4 close above 1.4810 may change the current price direction.
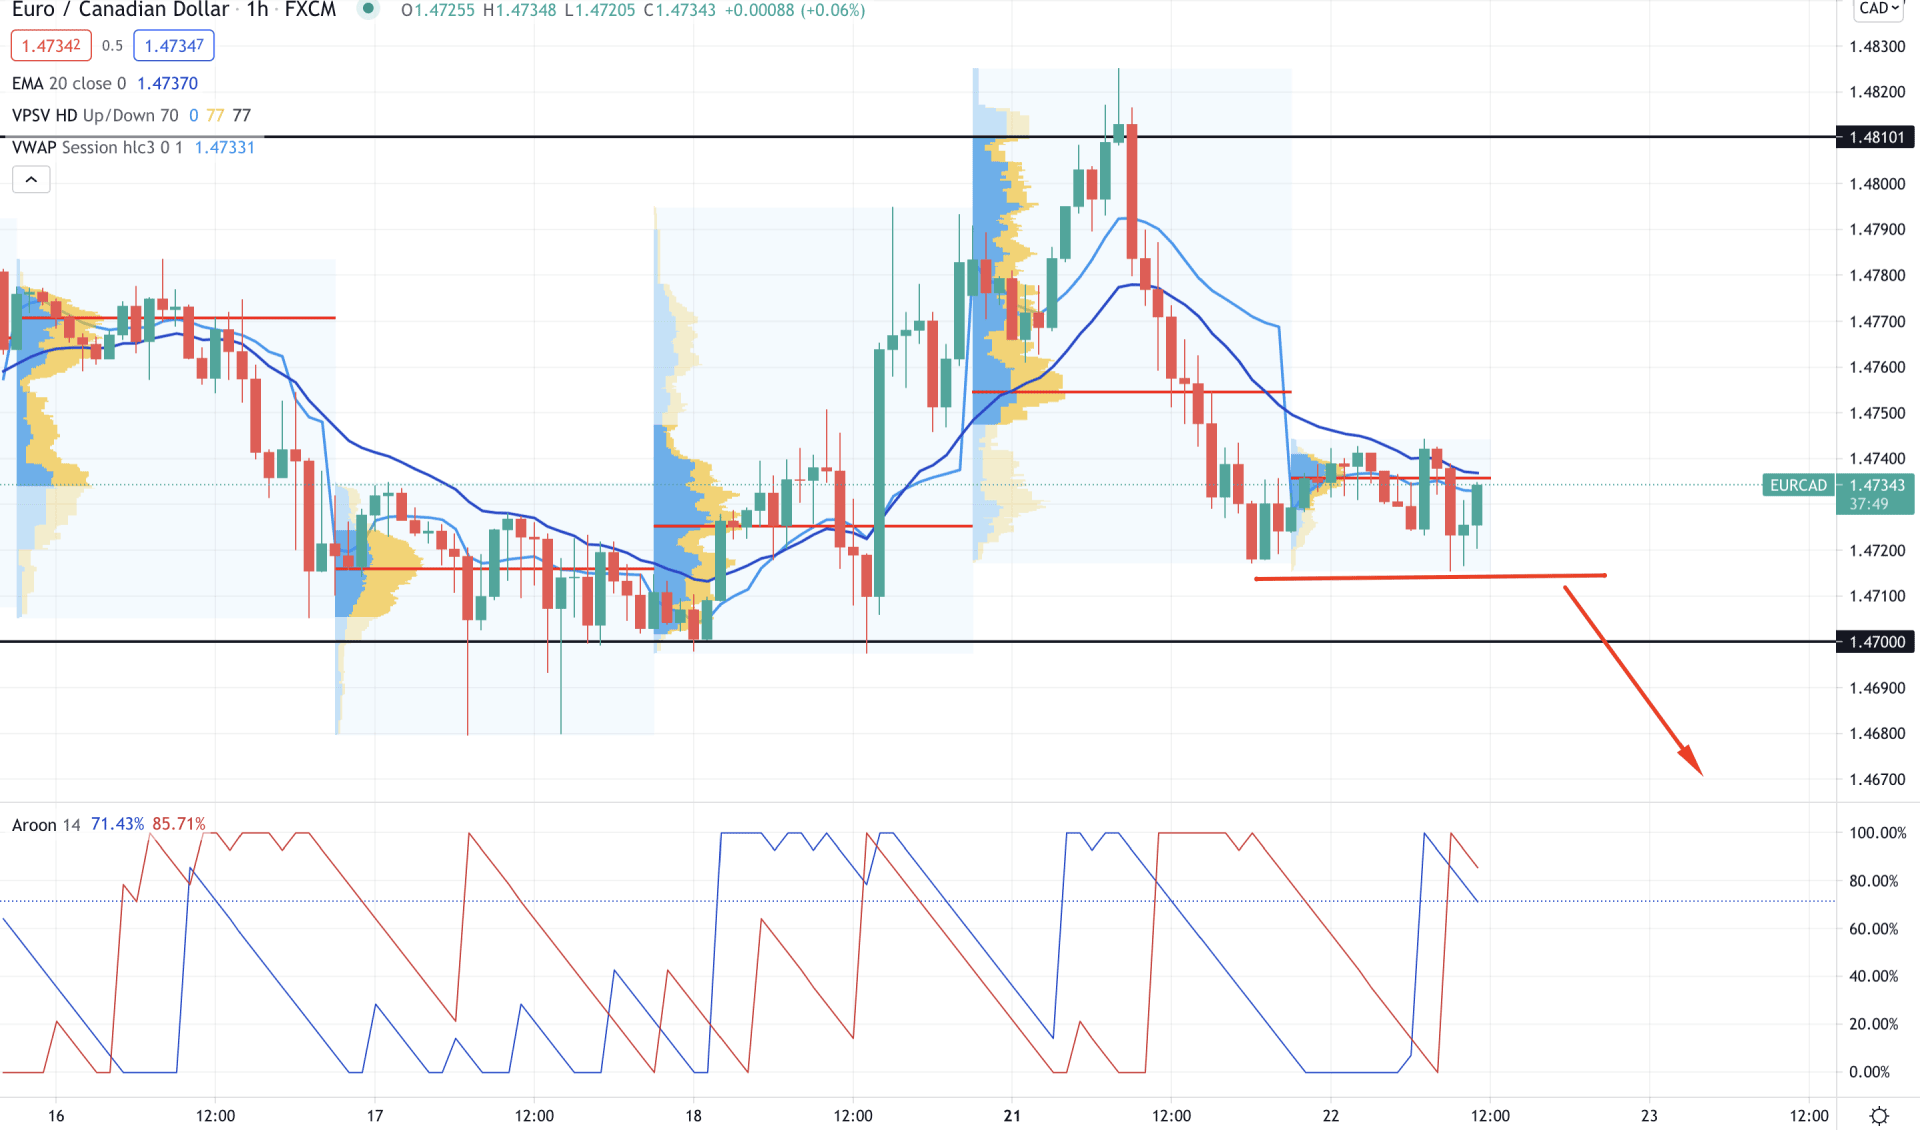
Based on the intraday price chart, EURCAD is trading below the intraday high volume level of 1.4735. The most recent price tried to push down from the 1.4735 level but failed to make a new low. Therefore, as long as the price is trading above the 1.4715 intraday swing low, the overall outlook may remain bullish.
The above image shows the H1 chart of EURCAD, where the price is trading below the dynamic 20 EMA and vwap level. However, the recent bearish push during the London Session failed to make a new low price. Therefore, any bullish H1 close above the dynamic vwap level may create a bullish correction to the price.
Besides, Aroon Down (Red line) moved above the Aroon Up (Blue Line) in the indicator window, pointing out that sellers are still dominating in the price. Therefore, any bearish H1 close below the 1.4715 would create bearish pressure to the price where the primary target would be the 1.4650 level.
As of the above discussion, we can say that EURCAD can move lower towards the 1.4500 support level as long as the price is trading below the 1.4810 resistance level. However, the intraday chart is still bullish, where a break below 1.4510 is required to consider the bearish pressure as vital.
On the other hand, any strong bullish H4 close above the Kumo resistance at 1.4760 may take the price higher towards the 221.45 level.