
Published: July 11th, 2023
Francois Villeroy, an ECB's Board of Directors member, predicts that food inflation will decline in the year's second half. In addition, he suggests that the Consumer Price Index (CPI) will average 2.5% in 2024. Villeroy argues that the tightening cycle is approaching its apex and that the central bank should maintain its present stance for some time.
In Germany, the final inflation rate for June showed a 0.3% month-over-month increase in the Consumer Price Index (CPI) and a 6.4% year-over-year increase, consistent with earlier estimates.
Additional data from the region indicates a decline in Economic Sentiment, as measured by the ZEW Institute, with values of -14.7 and -12.2 for the broader euro bloc in the month of July.
In Australia, the Westpac Consumer Confidence Index increased by 2.7% in July, per analyst expectations, exceeding the 0.2% increase from the previous month. Similarly, the National Australia Bank's (NAB) monthly business sentiment figures for June also indicate positive outcomes. The NAB's Business Conditions index grew from 8 to 9, while Business Confidence rose from -4.0% to 0.0%.
As a result of the recent declines in China's Consumer Price Index (CPI) and Producer Price Index (PPI), there are concerns about deflation in Australia, despite positive sentiment indicators.
Let’s see the future price outlook of EURAUD from the multi-timeframe analysis:
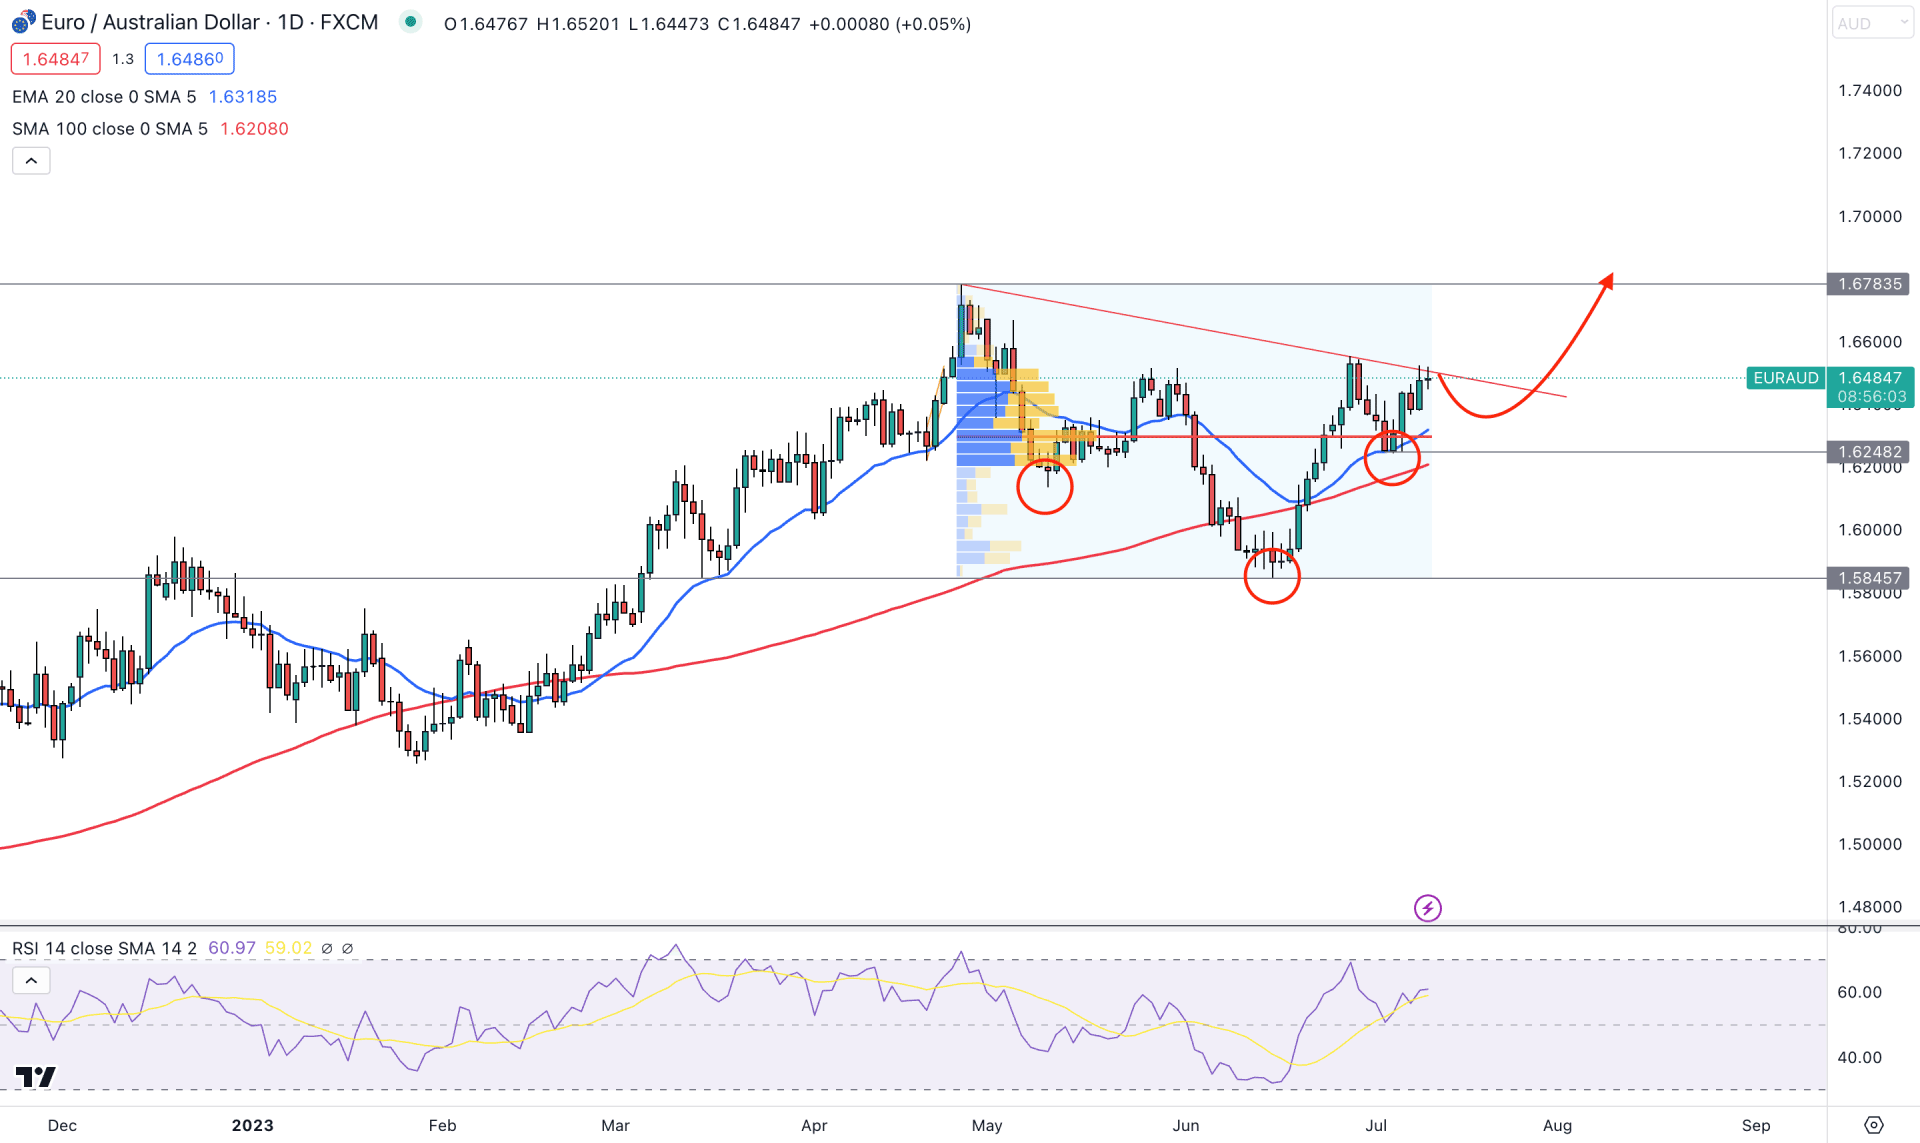
The daily price of EURAUD shows a strong bullish momentum as the price keeps moving higher from left to right. Also, the daily price trend supported him the higher timeframe price action.
In the monthly chart, a long wicked candle closes on the downside with a V-shape recovery in the weekly timeframe. Based on these candlestick formations, the upward pressure is potent, but a closer view is needed to be performed from the daily price action.
A potential Inverse Head and Shoulders formation in the daily price, where the current price faces a neckline resistance. Moreover, the current price is trading above the 100-day Simple Moving Average line, which suggests that the broader market direction is bullish. Also, the 20-day EMA is below the current price, working as immediate support, which suggests the immediate support level of the current setup.
In the volume structure, the highest trading volume level since 26 April 2023 high is at 1.6295 level, which is below the current price. Moreover, the recent bullish recovery from the 1.6248 level managed to hold the price above the high volume level, which increases the possibility of breaking out from the current trendline resistance.
On the other hand, the bullish possibility is potent from the indicator window, where the current RSI shows a rebound from the 50.00 neutral line towards the 70.00 area.
Based on the daily price outlook of EURAUD, a strong upward pressure with a daily candle above the 1.6548 level could validate the inverse Head and Shoulders breakout, increasing the possibility of testing the 1.6783 resistance level.
The alternative trading approach is to look for short opportunities after moving below the 1.6200 level, which may lower the price toward the 1.5800 area.
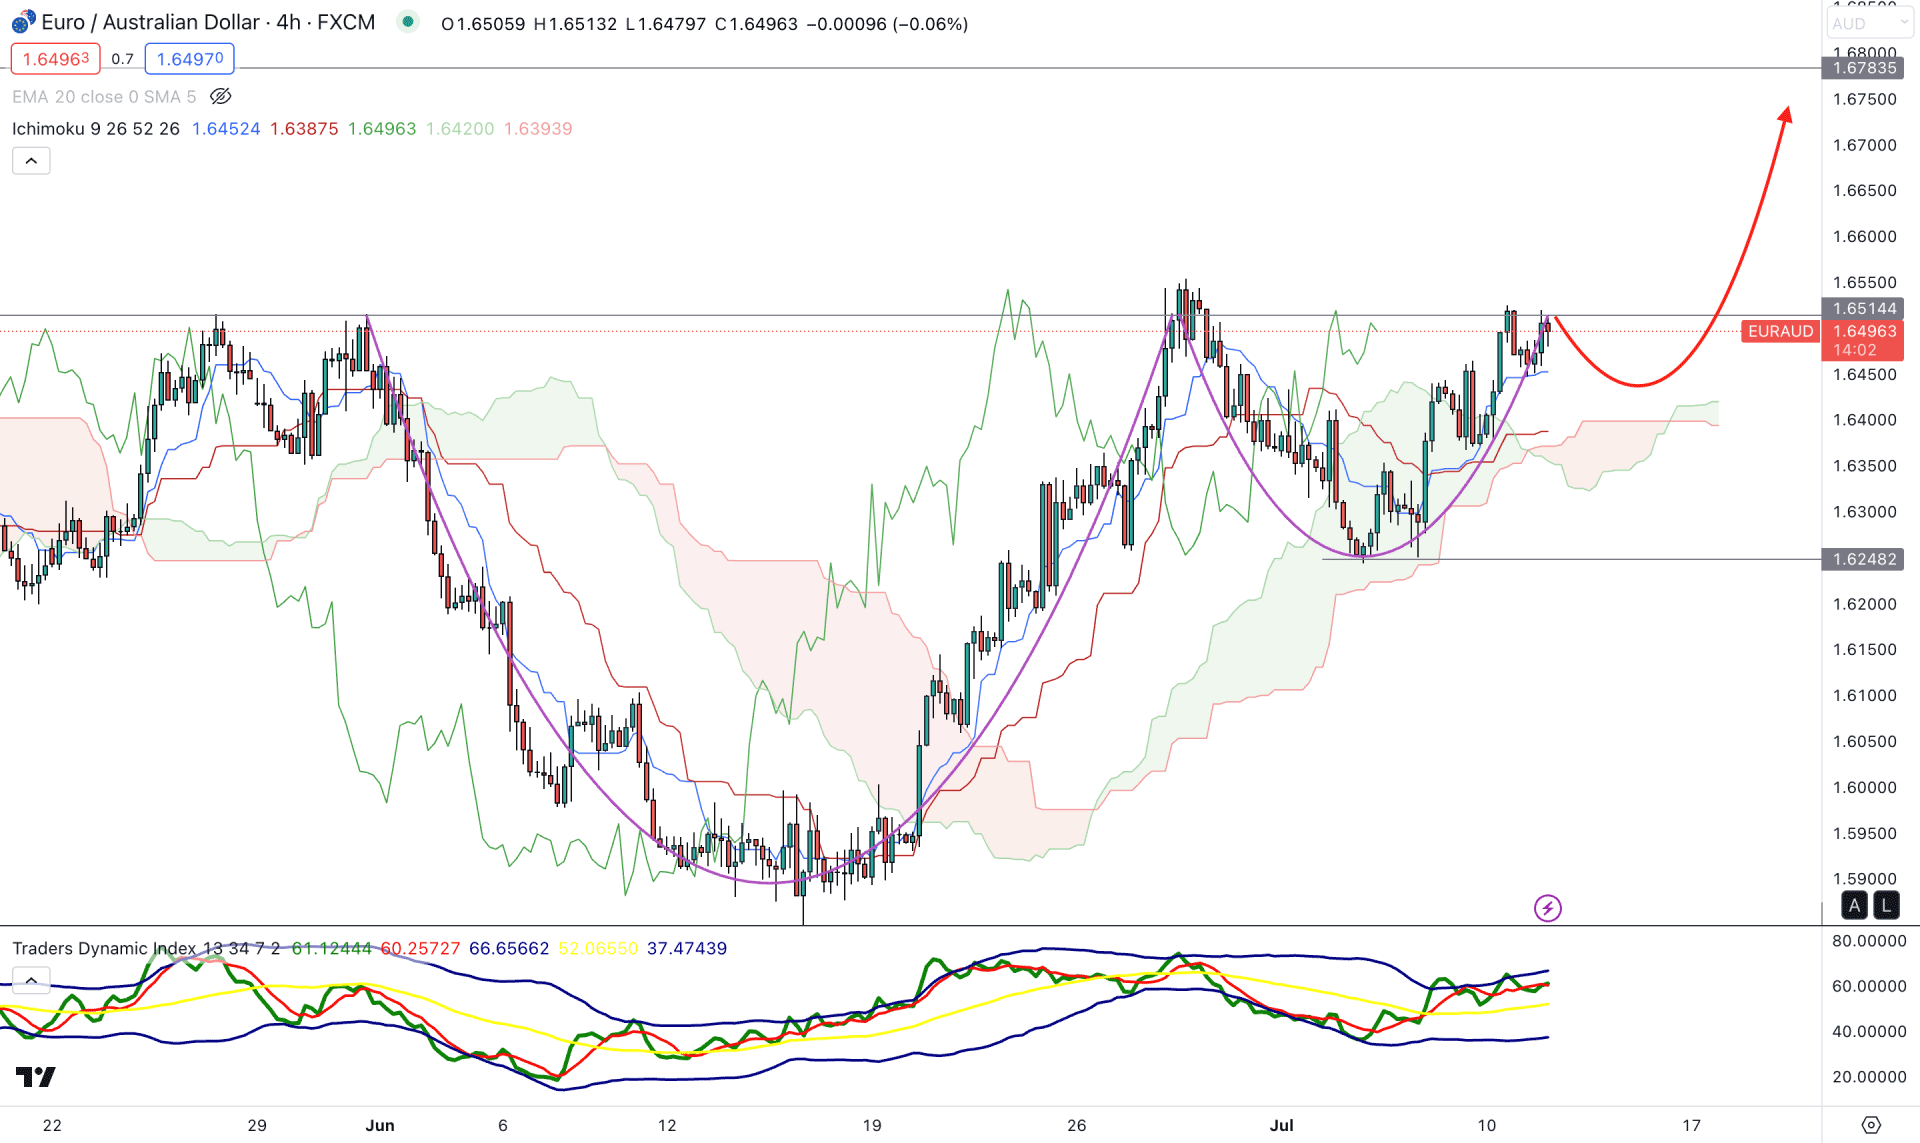
In the H4 timeframe, a potential Cup & Handle pattern shows a strong bullish possibility where a new H4 candle above the 1.6514 resistance would validate the breakout.
Moreover, the recent bearish recovery towards the Ichimoku Cloud zone works as a confluence of support to bulls, while the future cloud is bullish.
A minor recovery is possible as the current TDI indicator shows an overbought price. However, the dynamic support of Kijun Sen is still below the price, working as a minor support.
Based on the current H4 outlook, EURAUD buying pressure is valid as long as the price trades above the 1.6400 key psychological level. However, breaking below the Cloud area with a new H4 candle might invalidate the current structure and lower the price towards the 1.6000 level.
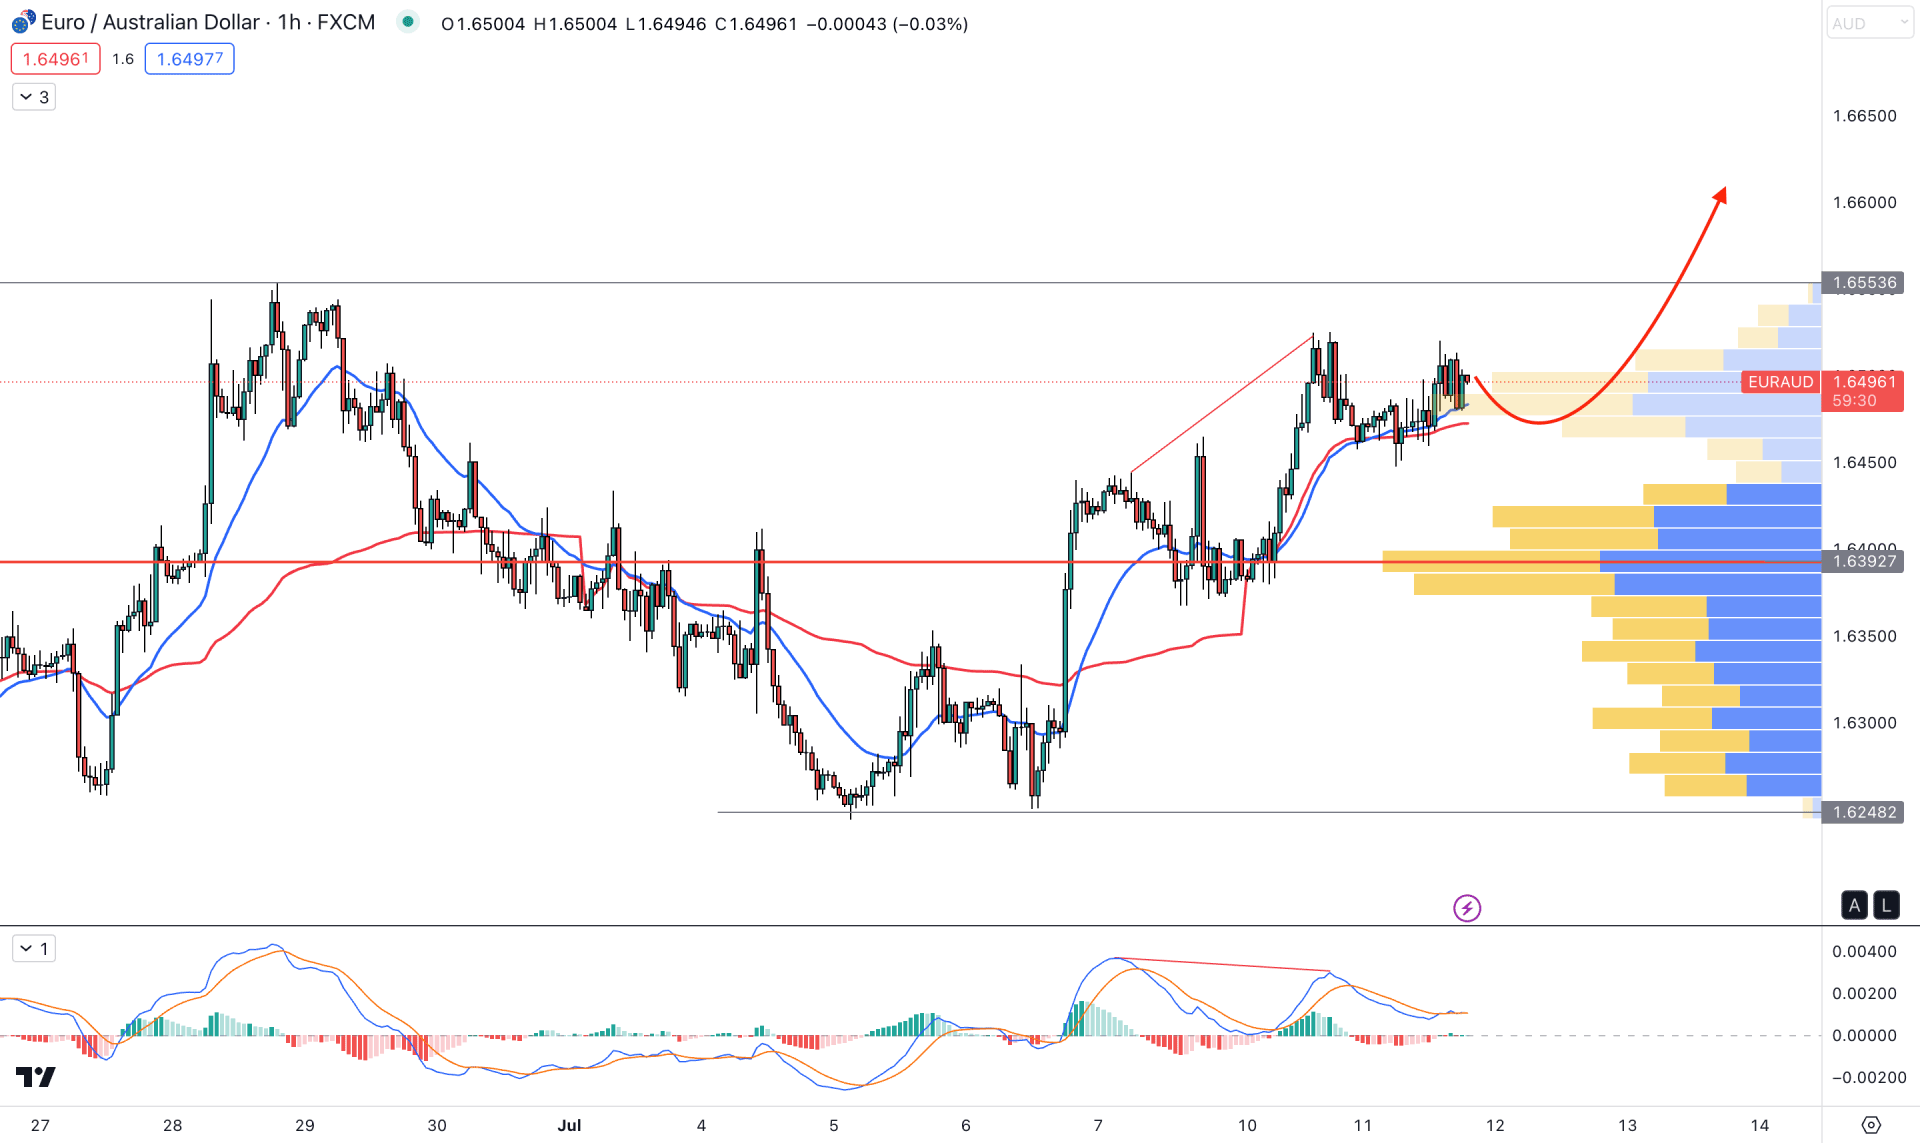
In the H1 timeframe, the broader market direction is bullish as the current price remained steady above the visible range high volume level. Moreover, the existing dynamic 20 EMA is working as an immediate support level from where buying pressure may come.
On the other hand, a divergence is visible between the price and MACD EMA’s, suggesting that bulls might struggle to overcome the near-term resistance level.
Based on the current market outlook, any false break and immediate recovery from the dynamic 20 EMA support could offer a long opportunity in this pair. However, a deeper correction is possible towards the 1.6392 level, but breaking below the 1.6300 level with a bearish D1 candle might alter the current structure.
Based on the current market outlook, EURAUD will likely extend the bullish pressure in the coming days. The ideal trading approach is waiting for a valid inverse Head and Shoulders Breakout to join the long-term bullish trend.


