
Published: December 4th, 2025
EURAUD is trading sideways within a rectangle pattern with no sign of a valid trend formation. Although the Euro has been under some pressure due to the weaker-than-assumed Eurozone consumer sales numbers, the pair's attempts to decline have been restricted due to the Australian Dollar's weakness.
Eurostat data showed that retail sales stagnated in October after rising by 0.1% in September. However, sales increased at a rate of 1.5% year over year, above both September's 1.0% reading and the 1.4% predicted by market analysts.
The positive Eurozone closing HCOB Services Purchasing Managers' Index results that were announced on Wednesday have been boosting the euro.
On the other hand, the nation's trade surplus increased to $4,385 million MoM in October from $3,938 million the month before, according to data released by the Australian Bureau of Statistics.
RBA Governor Michele Bullock acknowledged on Wednesday that inflation has not yet returned to the central bank's goal range of 2% to 3%. Bullock also cautioned that the future course of monetary policy might be affected if the pricing pressure proved to be permanent.
Let's see the upcoming price direction of this currency pair from the EURAUD technical analysis:
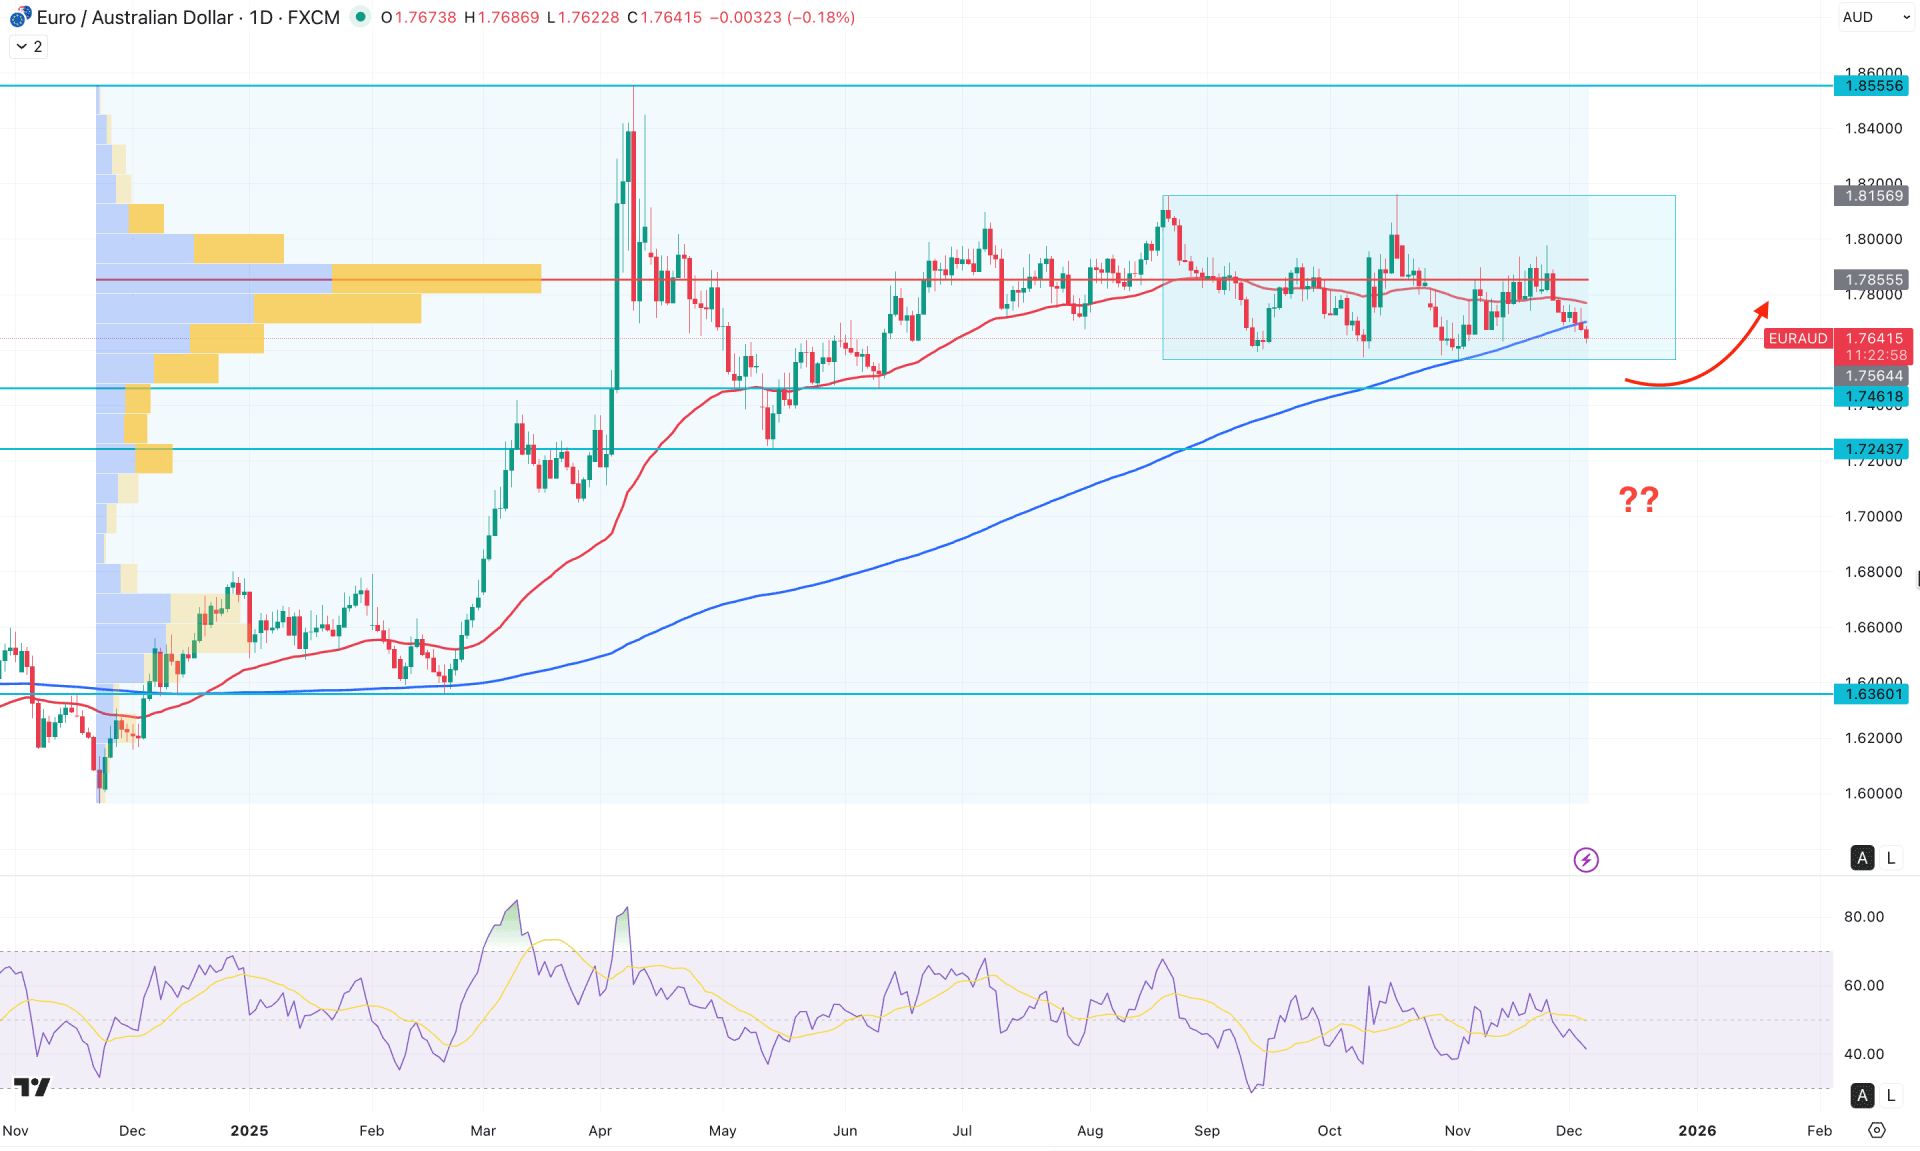
In the daily EURAUD chart, the market has remained sideways within a rectangle pattern since July 2025. As the most recent price action approaches the bottom of this rectangle, investors should carefully monitor how the price reacts to the near-term support level.
On the higher timeframe, extended volatility is present as the monthly chart shows no clear directional bias. Although the latest monthly candle closed higher, it failed to break above the existing monthly opening price. Additionally, the current price is still trading below the crucial monthly resistance at 1.7733. The weekly chart also reflects sideways pressure, with the price nearing weekly support — an area from which fresh buying pressure could emerge.
In the main price chart, a strong bearish momentum is visible as the price failed to hold above the 50-day Exponential Moving Average. After sweeping liquidity from the 1.7655 high-volume level, the price moved lower and formed a daily close below the 200-day Simple Moving Average. Overall, the price is trading below key dynamic levels, clearly indicating seller dominance in the market.
In the secondary indicator window, the Relative Distance Index (RDI) rebounded from below the 50.00 line and has yet to test the 30.00 oversold area.
Based on this outlook, the current bearish pressure might influence the price to test the 1.7564 rectangle support. However, sufficient buy-side liquidity exists below this zone, meaning the price could extend further downward toward the 1.7461 level.
On the bullish side, an early buying attempt could emerge from a sell-side liquidity sweep around 1.7644, but this would require a bullish daily close above the 50-day EMA to validate a long opportunity. Moreover, a dip below 1.7461 with a valid bullish reversal between 1.7460 and 1.7243 could open a long opportunity, targeting the 1.8555 level.
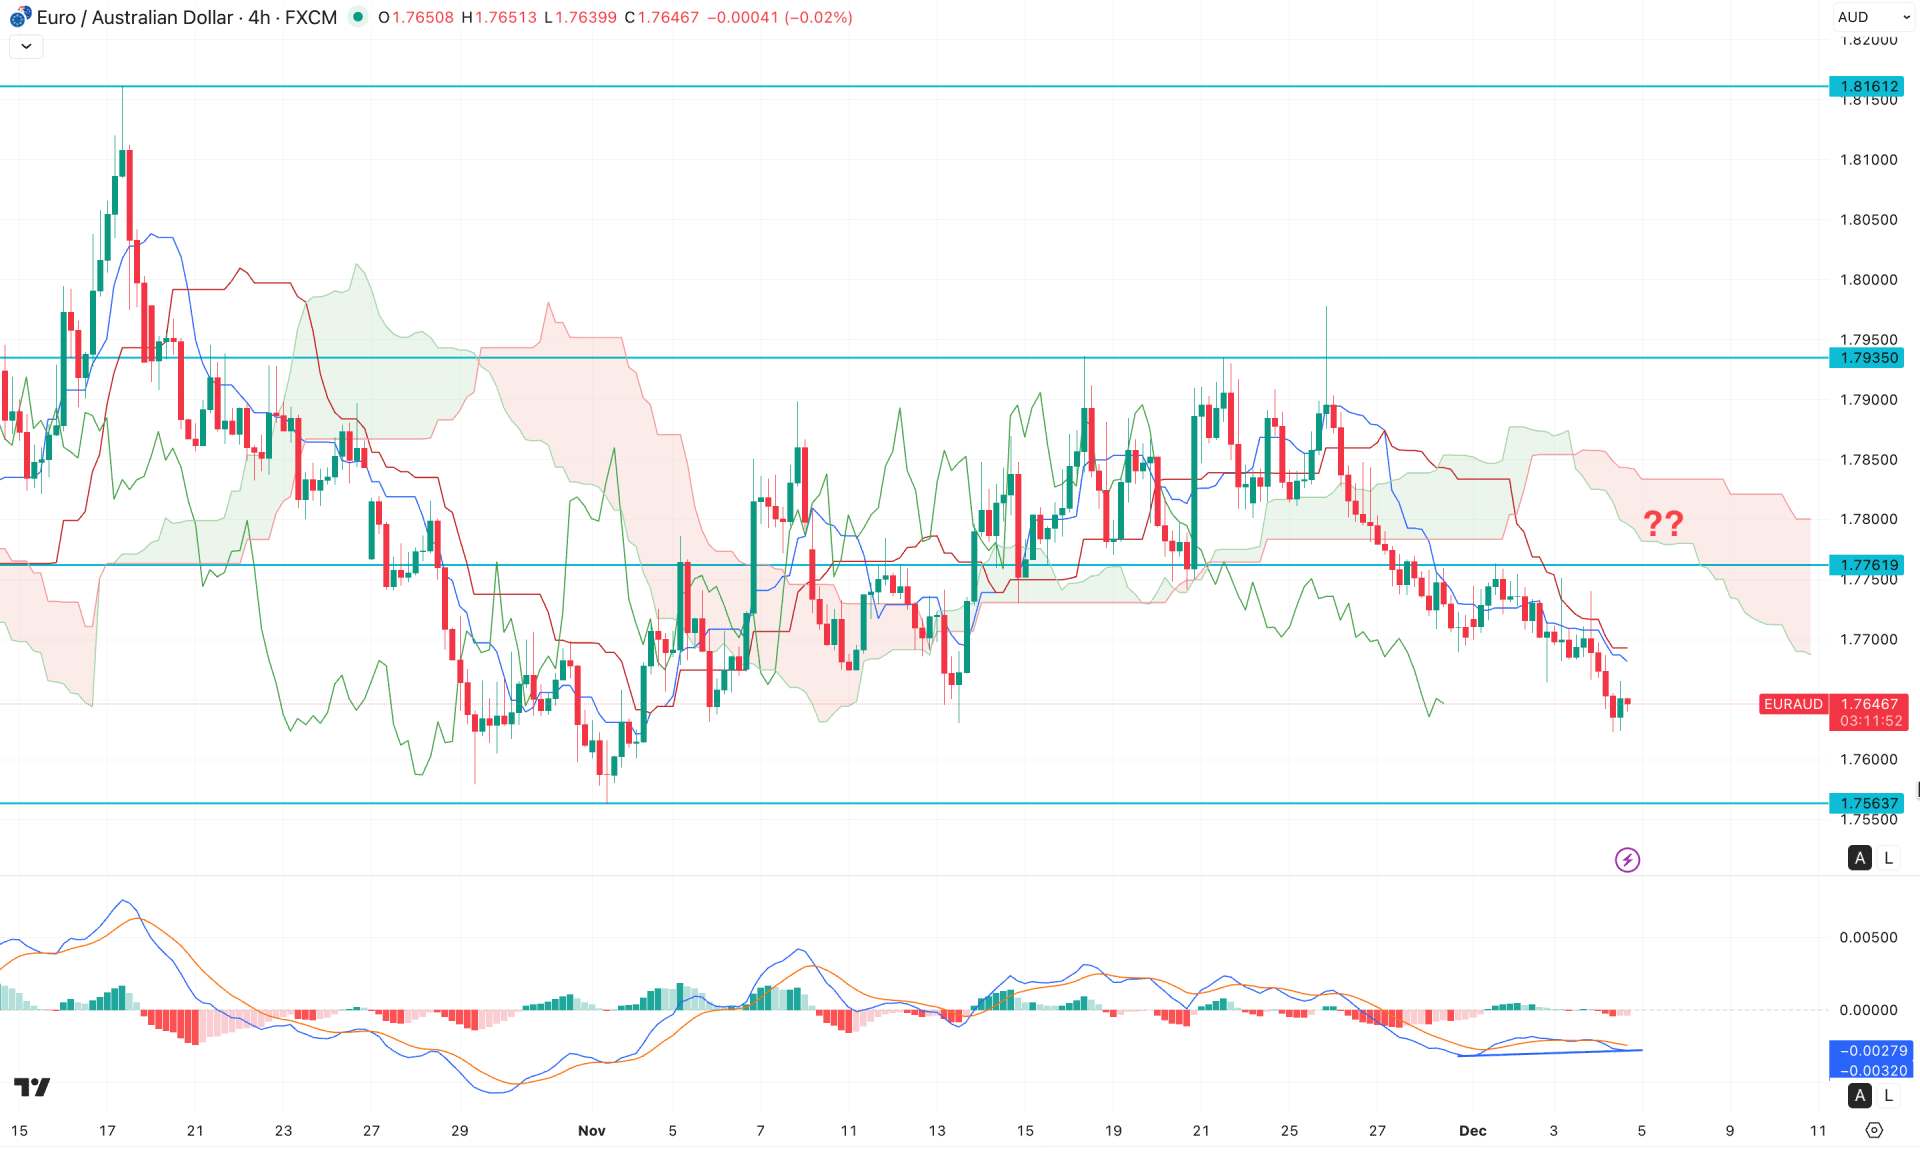
In the four-hour timeframe, the bullish sideways momentum has ended as the price failed to sustain buying pressure above the Ichimoku Cloud area. Moreover, a strong bearish reversal from the 1.7935 level encouraged sellers to dominate the market, shifting the market trend.
Moreover, the Future Cloud has shifted to a bearish position, where the current thickness signals a potential bearish correction possibility.
In the secondary indicator window, recent bearish pressure has found a bottom, accompanied by a MACD divergence. Moreover, the histogram has rebounded and is approaching the neutral area, a bullish flip that could validate a potential long opportunity.
Based on this outlook, a strong bullish breakout above the 1.7761 resistance level is required to confirm a long setup targeting 1.8161. However, any further bearish rejection from dynamic key levels could push the price even lower toward 1.7637.
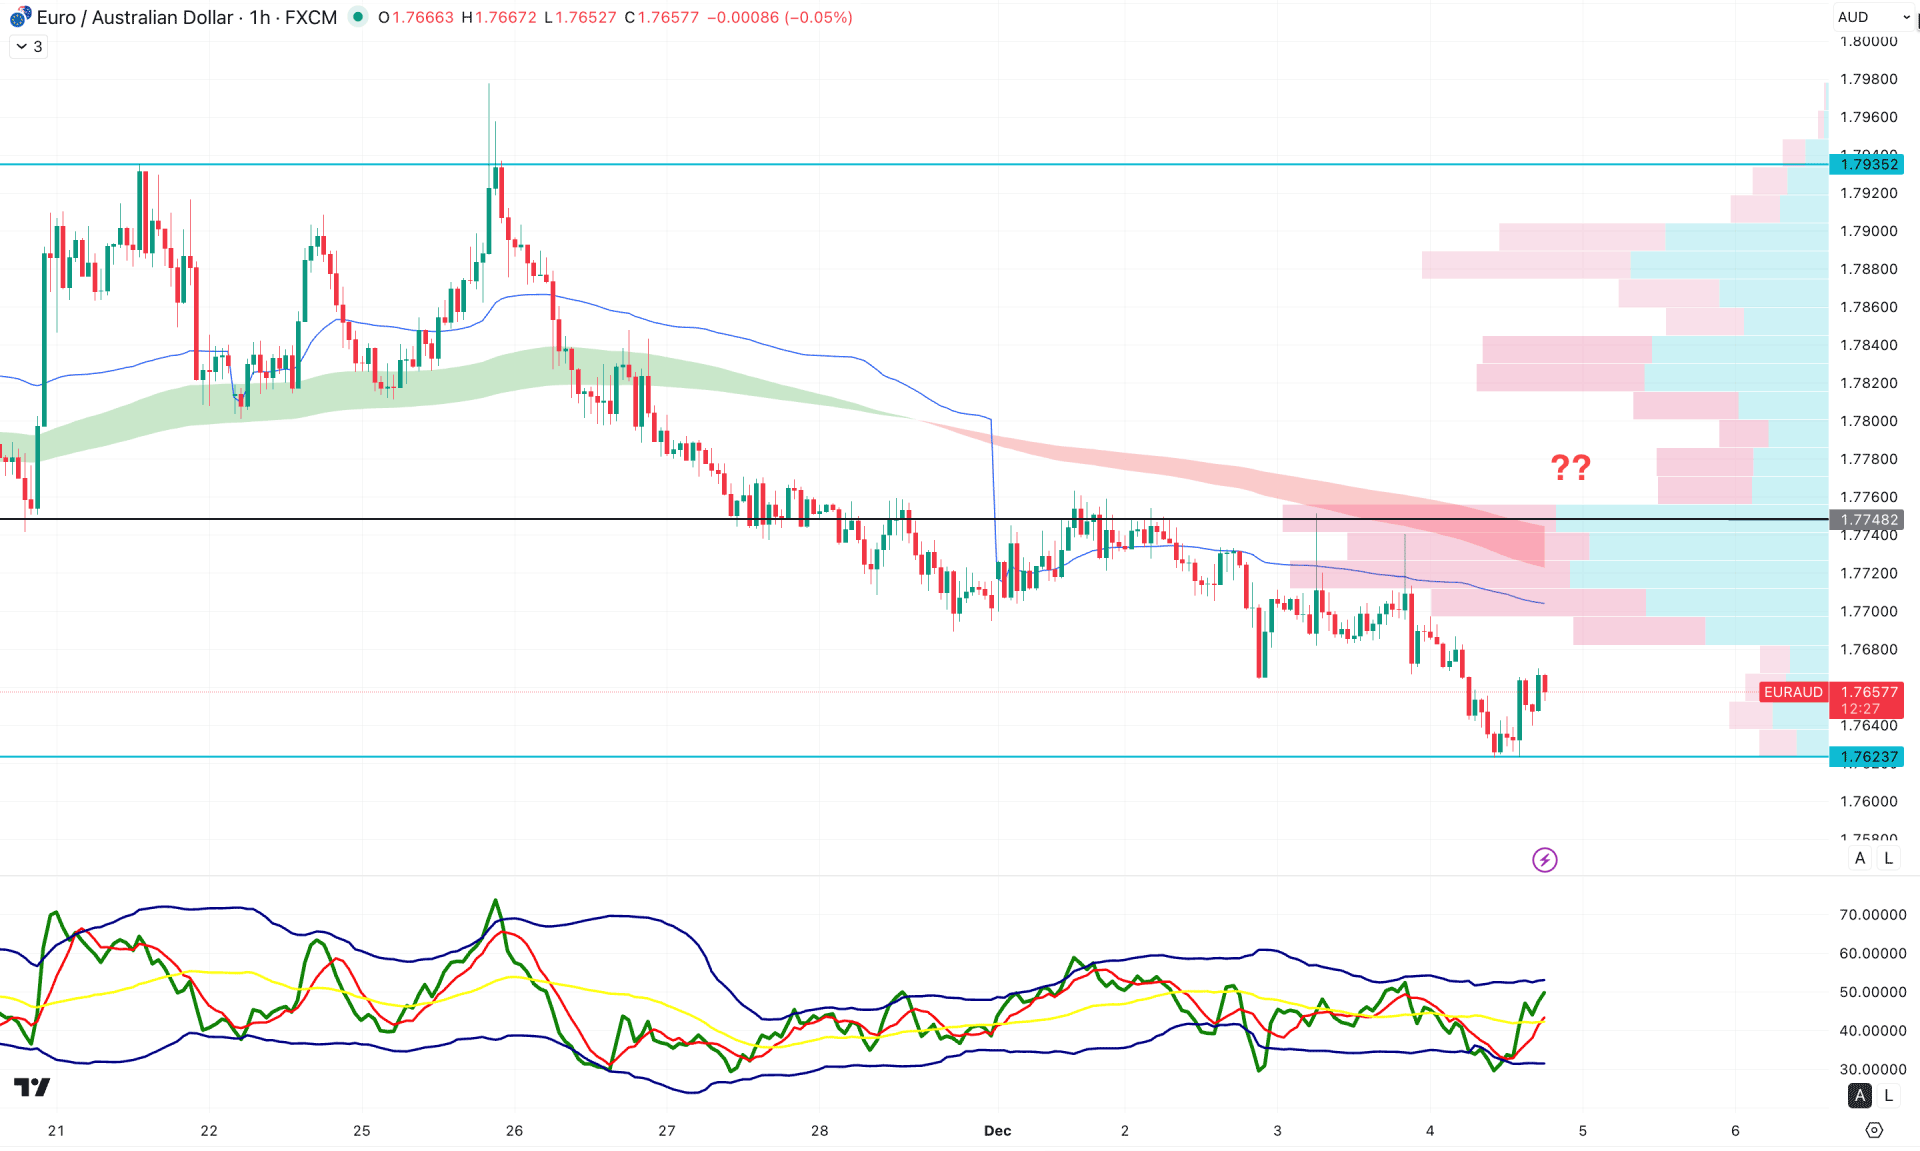
In the hourly chart of EURAUD, the recent price showed an ongoing selling pressure below the intraday high volume line. Moreover, the EMA wave and weekly VWAP are also above the current price and working as a confluence of selling pressure.
In the secondary indicator window, the current TDI level is above the neutral 50.00 line, suggesting an ongoing buying pressure. However, any sign of forming a top with an immediate dip below the 50.00 level might signal sellers' appearance in the market.
Based on this outlook, the intraday price is bearish, where a sign of a valid bottom formation could be an early sign of a major bullish trend continuation.
Based on the overall market structure, EURAUD is trading within a sideways momentum, from where a valid breakout is needed before anticipating a trend trading opportunity. As the existing market momentum is bullish, any bearish failed breakout could be an highly probable long opportunity.


