
Published: April 16th, 2026
The Eurozone Harmonized Index of Consumer Prices (HICP) rose by 1.3% MoM in March, slightly above the initial forecast of 1.2% and increasing from a 0.6% rise in February. Although the core data was revised downward, the rise in headline inflation indicates that energy expenses are, in fact, driving up price trends in the area.
The European Central Bank (ECB) may take a more aggressive stance at its upcoming monetary policy meeting, scheduled for April 29–30, as a result of this trend.
ECB officials prefer a cautious approach for the time being. Christine Lagarde, the president of the European Central Bank, recently stated that the Fed must remain "completely agile" on interest rates. Financial markets, meanwhile, are still expecting two 25-basis-point rate increases this year. The likelihood of a rate hike at the April session is still slim, but markets have now nearly fully factored in a move by June, according to Reuters.
In Australia, the job report showed a 17.9K increase in the country's economy in March, while the unemployment rate was unchanged at 4.3%.
The Reserve Bank of Australia (RBA), which is expected to tighten regulation by at least 54 basis points before the end of the year, implying two 25-bps rate hikes. The likelihood of the RBA hiking rates at the next session is 66%.
Let's look at another aspect of this pair from the EURAUD multi-timeframe analysis:
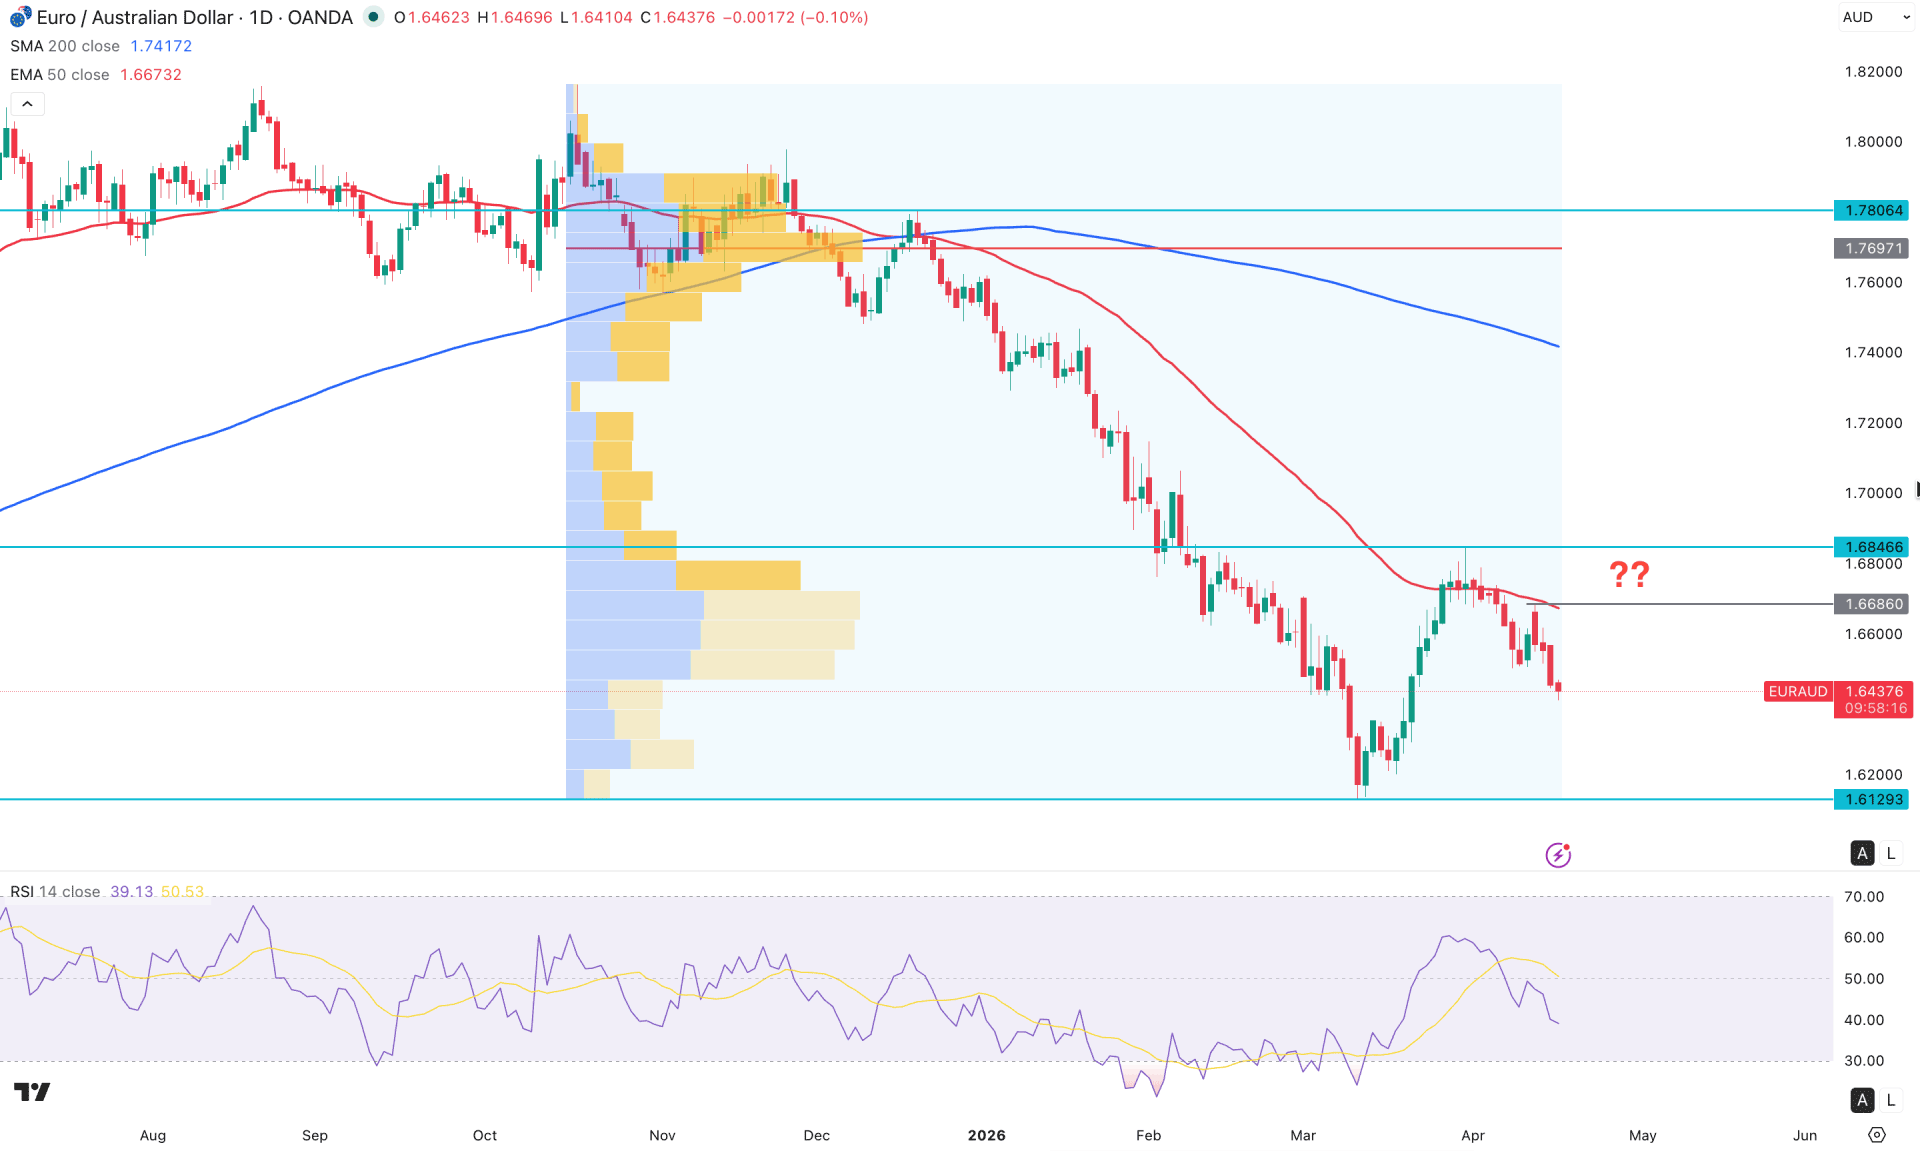
In the daily chart of EURAUD, the recent price action shows impulsive bearish pressure within a valid range, signaling more downside continuation. Although some minor bullish correction is seen at the 1.6846 top, it is not sufficient to consider a trend change.
On the higher timeframe, the price action remains bearish, followed by an inside bar breakout on the monthly timeframe. The weekly price is also supportive of sellers, as a three-week consecutive move is visible following some decent profit-taking.
As per the volume structure, selling volume is still dominating the market, as the most active level since October 2025 is at 1.7697. Moreover, some additional high-volume areas are seen at the 1.6686 level, which could work as a crucial resistance.
As a part of the technical analysis, the 200-day SMA is working as a major barrier, as it holds above the current price with a bearish slope. It is a sign of a major bear trend, even if a considerable correction might appear as a mean reversion. The price has multiple resistances to overcome before reaching the 200-day SMA, which could be a challenging factor in the current market context.
On the other hand, the most recent price shows a strong bearish reversal from the 50-day EMA, which is currently carrying the selling momentum.
Following the market structure, the relative strength index is supportive of sellers, as a sharp rebound is seen from the 60.00 level. Moreover, the current RSI level is around 40.00, signaling more room to move lower.
Based on the daily outlook, the price is likely to continue to pressure downside in the coming days. The most recent resistance is at 1.6686 level, which aligns with the 50-day EMA. As long as the price remains below this level, the bearish momentum could extend below the 1.6200 area.
The alternative approach is to find an immediate bullish reversal with consolidation above the 50-day EMA. In that case, a valid liquidity grab from the bottom with a stable price above the 1.6800 area could increase the possibility of testing the 1.7697 high within the resistance zone.
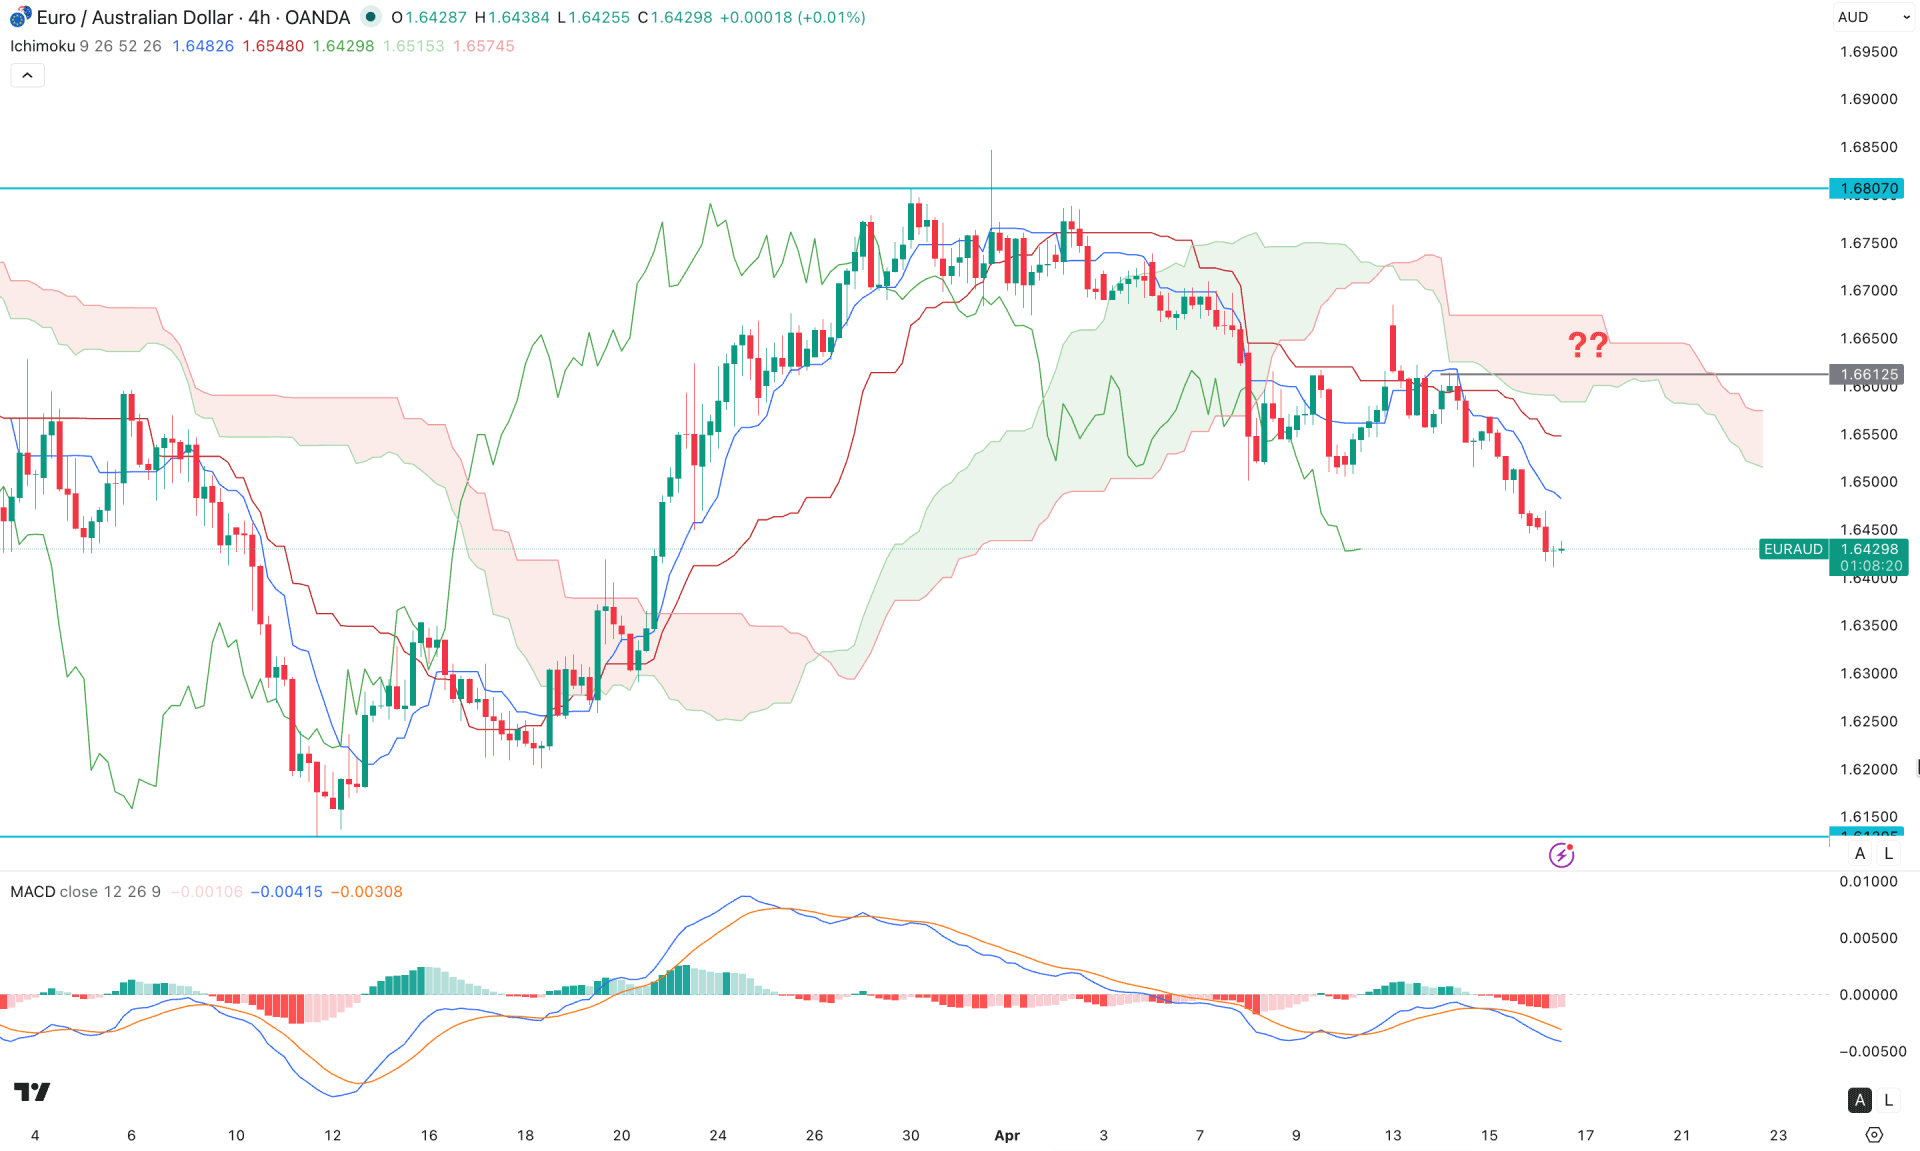
Over the four-hour timeframe, the price is trading below the Ichimoku cloud after a valid retest of the Kijun-sen level. Moreover, the selling pressure is supported by a downward slope of the future cloud ahead. Both lines are heading lower.
The indicator window shows the same story, where the MACD histogram remains below the neutral line. However, a flat histogram with the signal line at its lowest point in a month signals a potential bullish correction.
Based on the four-hour market outlook, the immediate dynamic resistance is located at 1.6549. As long as the price remains below this line, a new swing low could be found below the 1.6300 area.
On the other hand, a failure to maintain selling pressure below the 1.6812 resistance level might invalidate the bear structure. In that case, a valid breakout above the cloud area with consolidation is needed before heading toward the 1.6807 level.
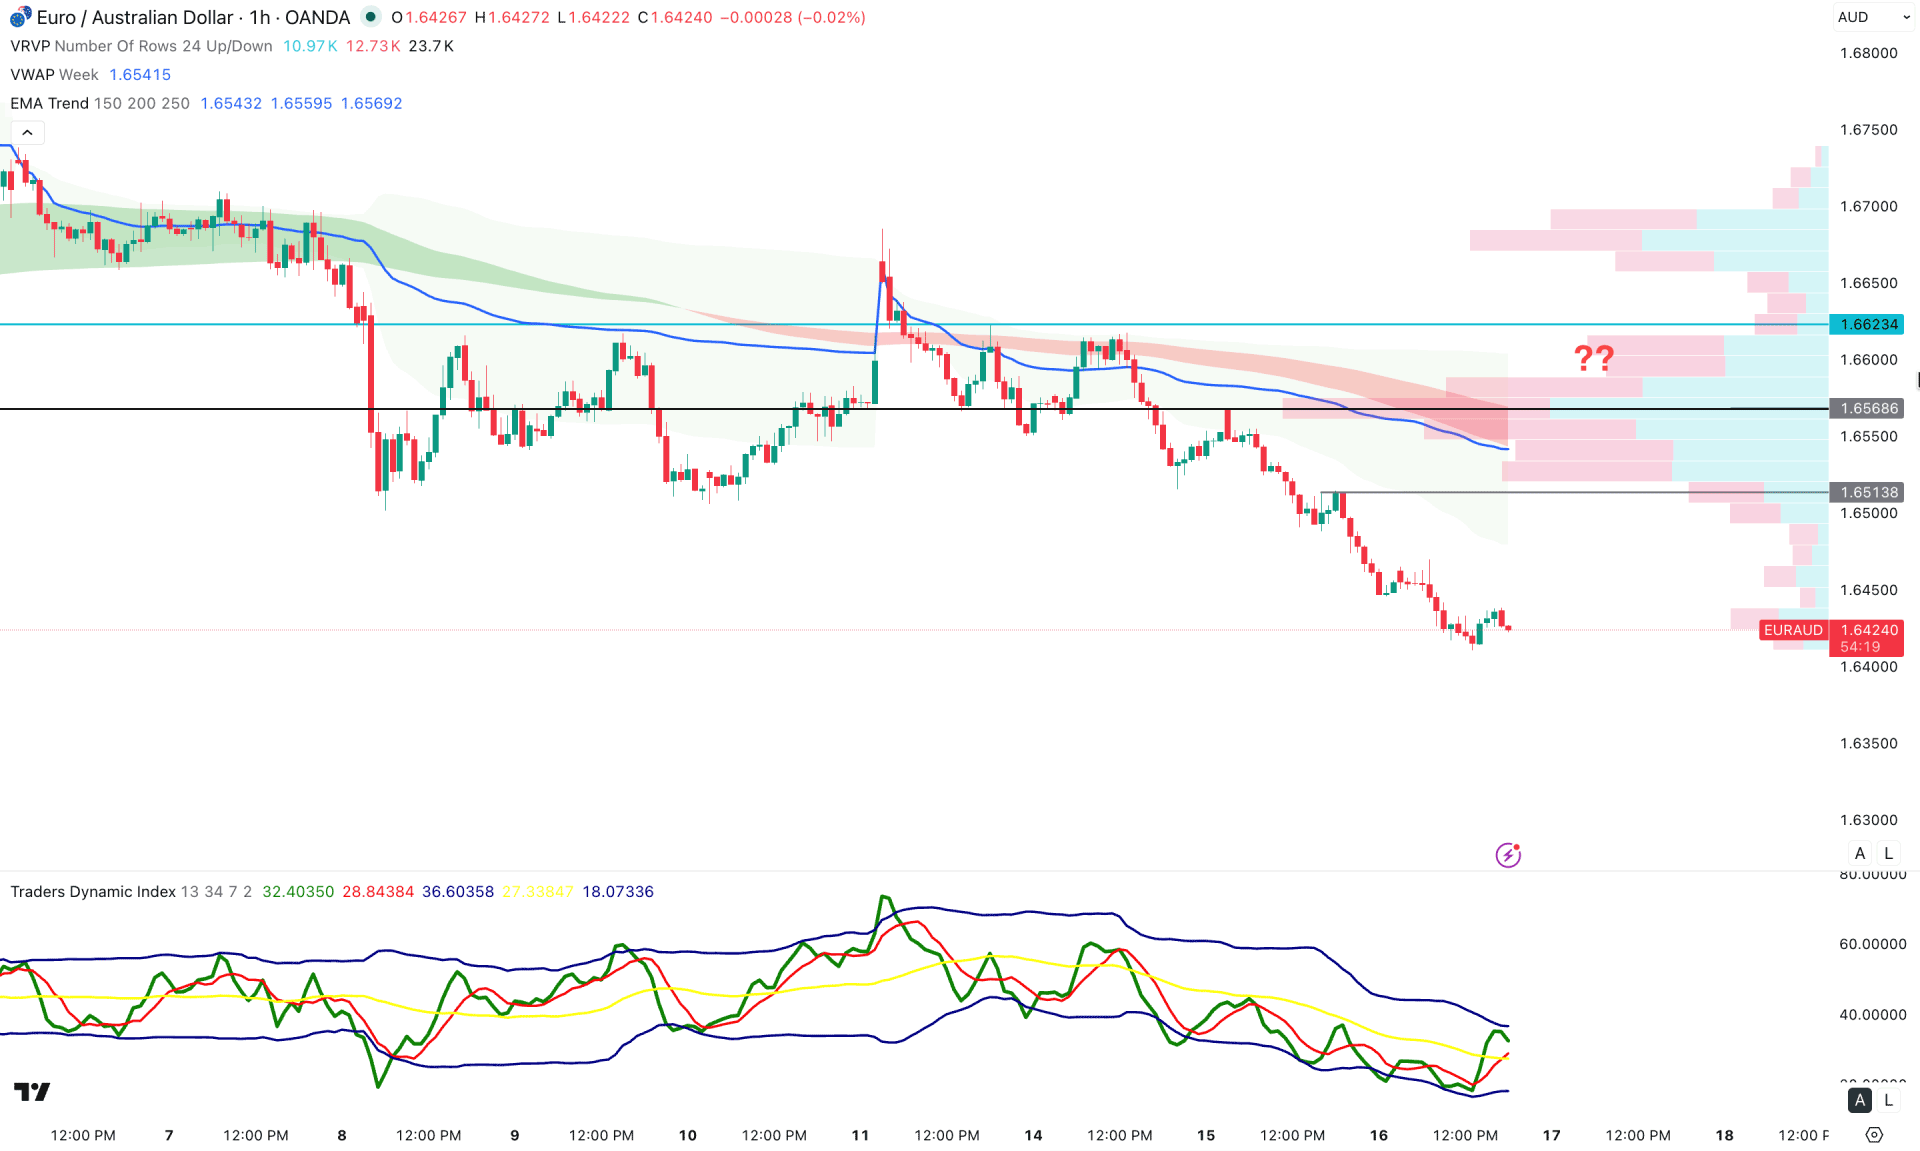
In the hourly timeframe, EURAUD is trading within extreme intraday bearish pressure. As a result, the price keeps moving lower, creating a gap with the dynamic weekly VWAP.
In the indicator window, the Traders Dynamic Index shows a different story, as the most recent line has spiked higher to the upper peak area. However, the TDI level still remains below the 50.00 neutral line, signaling a bearish possibility.
Based on the hourly market outlook, the price is likely to form a bullish correction during the session change, with immediate resistance at the 1.6513 level. Any reversal from the 1.6503 to 1.6568 area could be a potential short opportunity.
On the other hand, an extended buying pressure with a failure to hold momentum below the VWAP level might take the price beyond the 1.6623 level.
Based on the overall market structure, EURAUD is trading with a strong bearish trend. As the price extends, a minor bullish correction could occur before the selling pressure resumes to the downside.


