
Published: November 16th, 2020
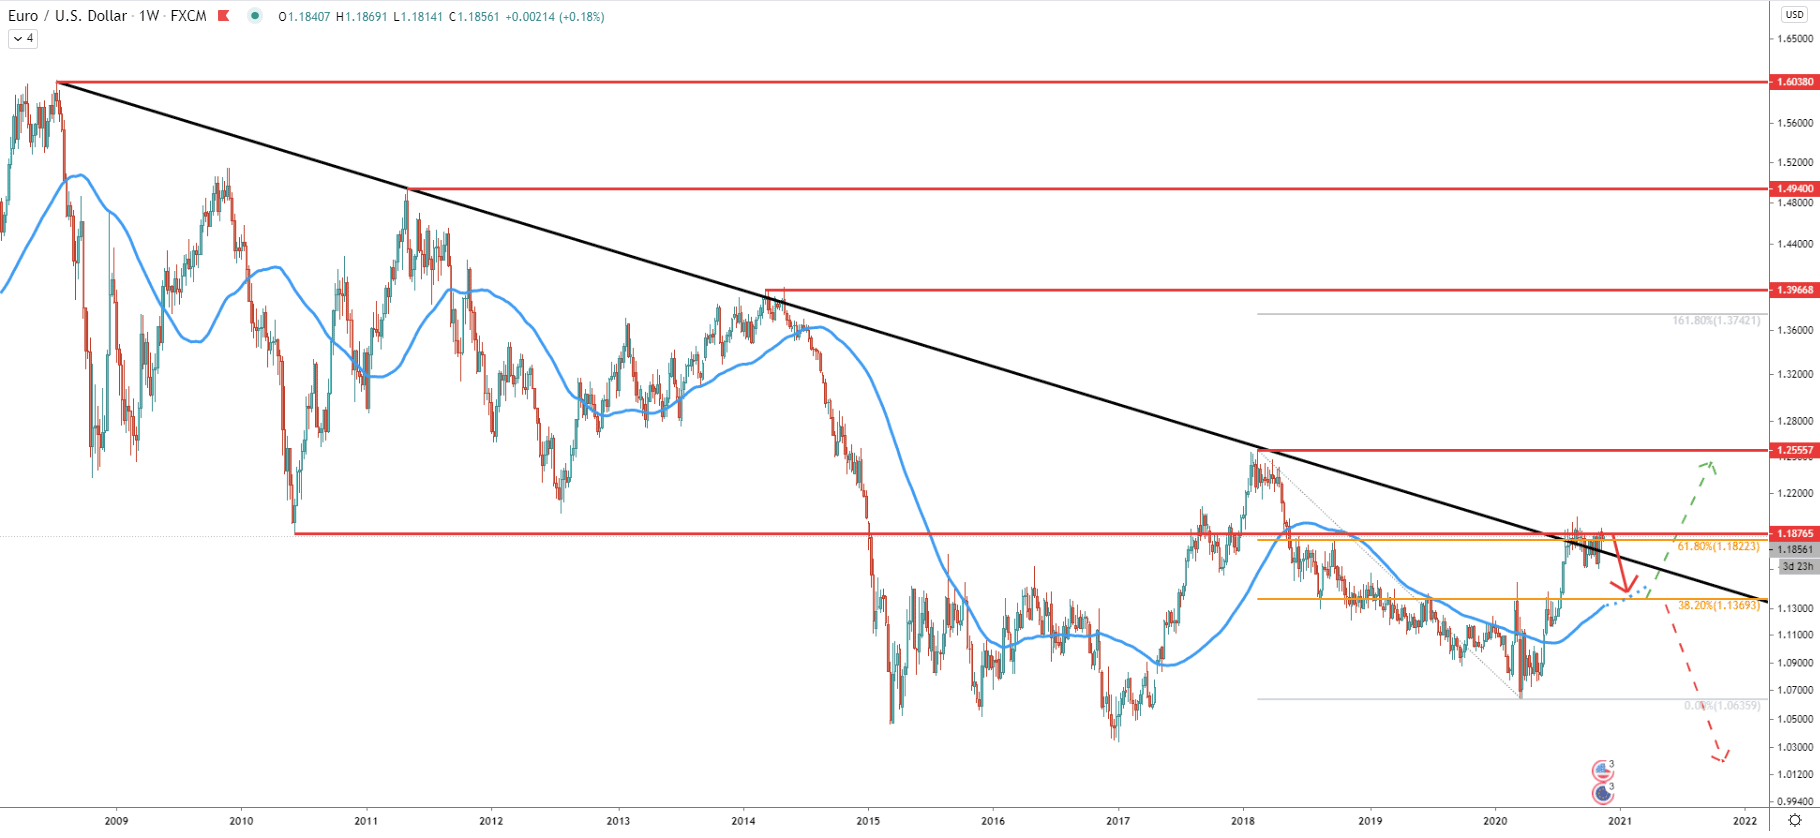
The weekly chart shows that EUR/USD is still in a downtrend and lower lows and lower highs are still being produced. Throughout the past couple of months EUR/USD has been rejecting the simple downtrend trendline, but what is more important is the rejection of the previously established support. This support is located at 1.1876, which was formed back in 2010. It is obvious that currently, it is acting as the resistance which is being rejected. At the same time, EUR/USD is bouncing off the 61.8% Fibonacci retracement level at 1.1822. There were multiple spikes produced above both of these resistance levels, although without any clear break and close above.
It goes to show that sellers remain in control, which is likely to result in either a long term downtrend continuation or at least a corrective wave down. The nearest support could be at 1.1370, which is confirmed by 38.2% Fibs as well as the 50 Simple Moving Average. Therefore, it could be reasonable to expect a 400+ pip decline for the EUR/USD in the coming weeks as long as the resistance is being respected.
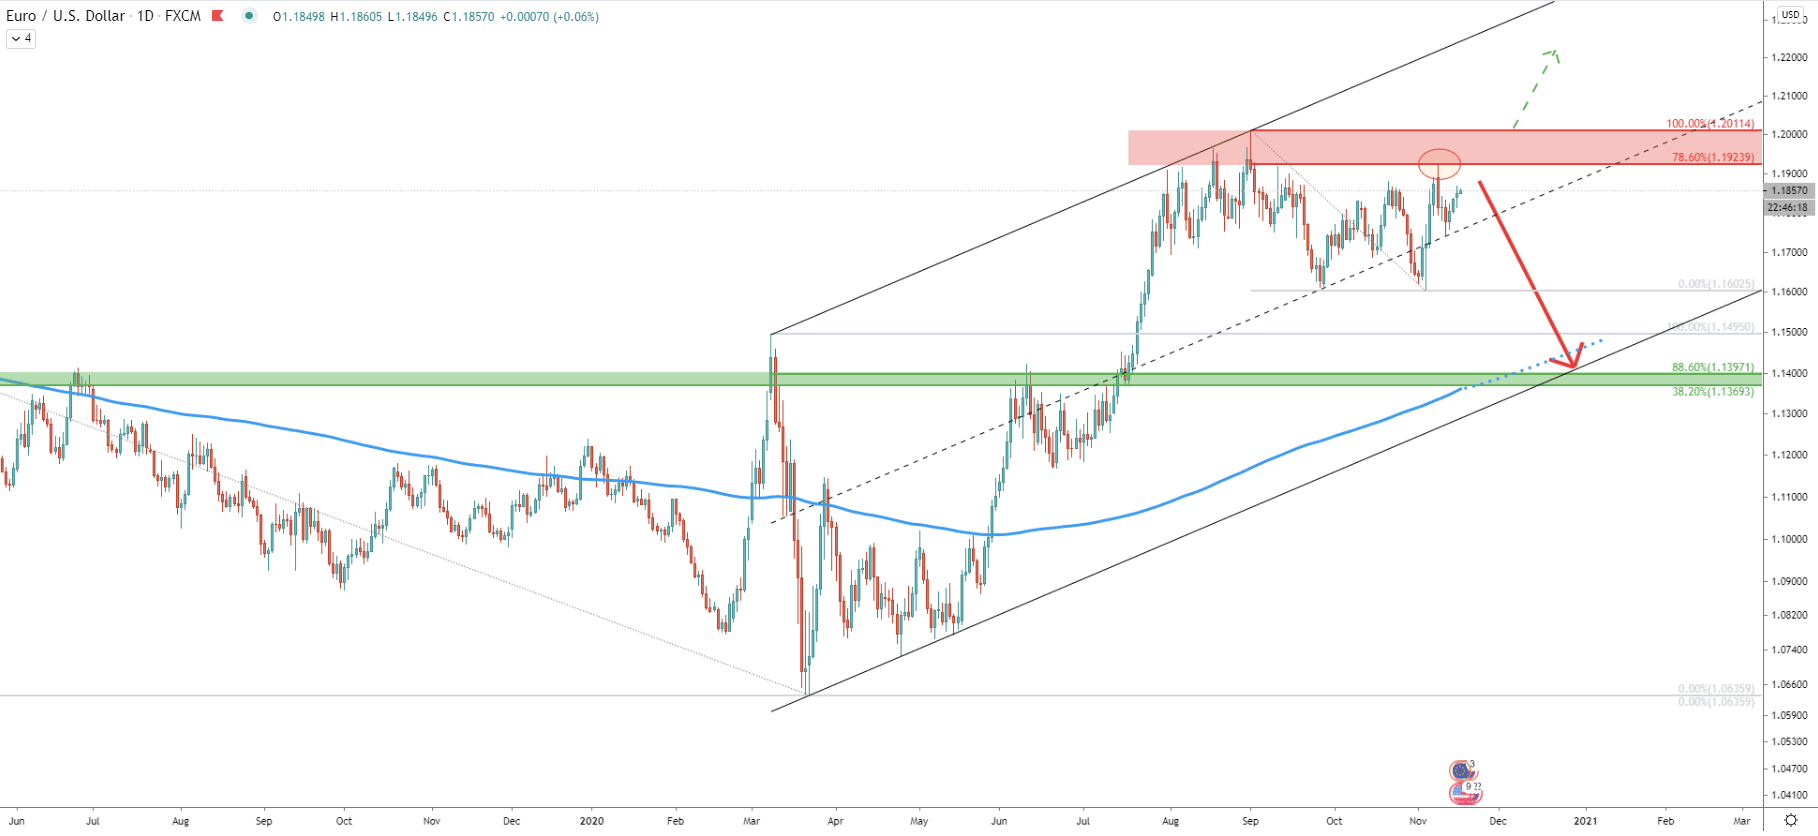
In the daily timeframe, EUR/USD is moving within the ascending channel, but after finding the top at 1.2014, the price went down and formed a double bottom at 1.1600. On the other side, on a pullback up, EUR/USD has clearly rejected the 78.6% Fibonacci retracement level. Perhaps right now, price is likely to consolidate between the 1.2000 resistance and 1.1600 support, while 1.1923 should continue to play a key role in further price development. As long as it holds, EUR/USD could drop towards the 1.1400 support area, which on this chart is confirmed by 38.2%, 88.6% Fibs as well as the 200 Simple Moving Average and the bottom of the ascending channel.
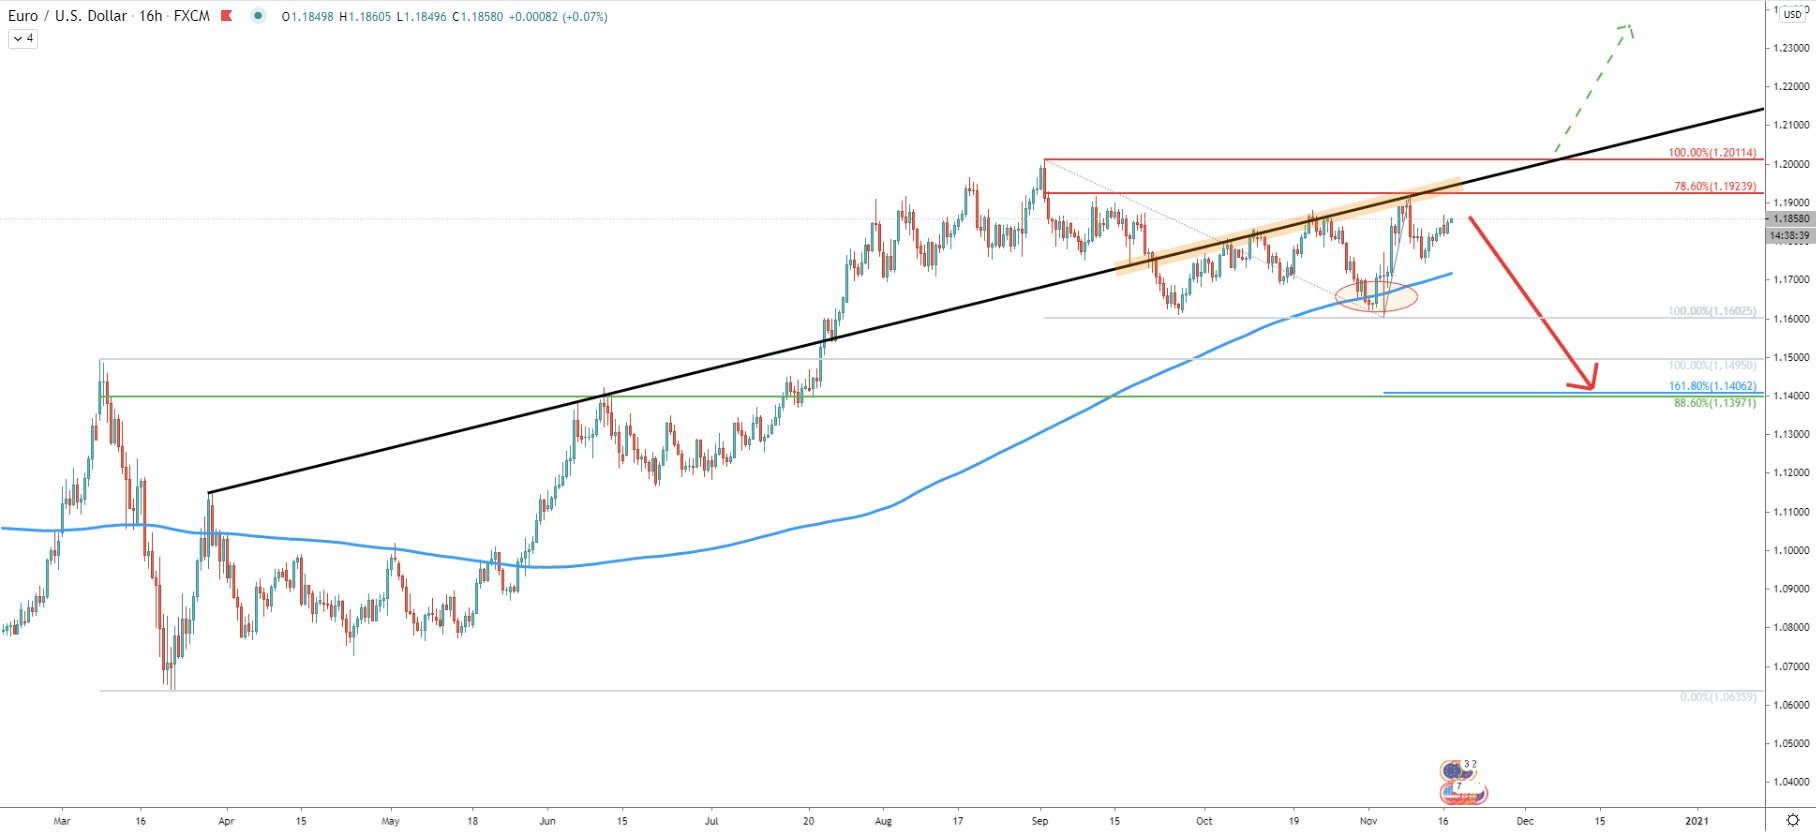
The average-price uptrend trendline is being consistently rejected and on November 9 there was a 4th consecutive bounce off the trendline. This was exactly the point where EUR/USD rejected 78.6% Fibs after breaking below the 200 SMA. Seems like the price is getting ready for a downside move, which might be relatively fast, considering the very slugging price action since August o this year.
Fibonacci applied the corrective wave up, where 78.6% Fibs along with the trendline were rejected, shows that 161.8% Fibs nearly exactly corresponds to the 88.6% Fibs, making a 1.1400 psychological level a cryptical supply point.
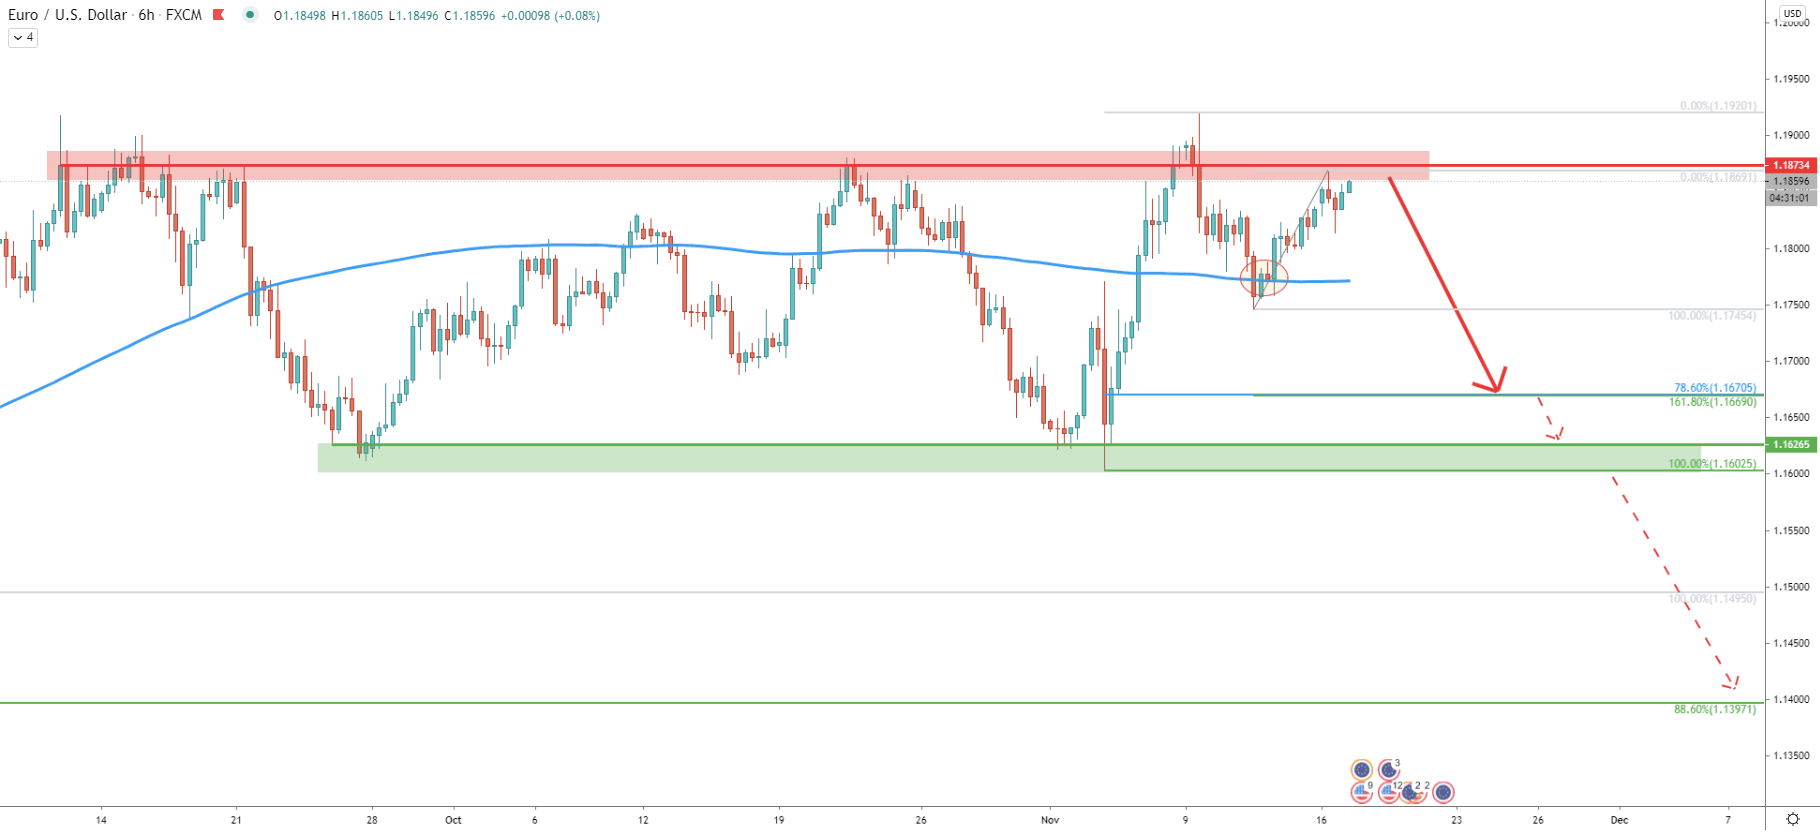
On the 6-hour chart, it becomes obvious that EUR/USD is currently undergoing the range-trading phase. The resistance area has been formed near 1.1900 and the support near 1.1600, making it a 300 pip while corridor. Considering that the weekly chat shows the validity of the downtrend and that currently EUR/USD is on the top of the range, it would be reasonable to assume that the probability is in favor of the downtrend continuation.
Currently, the price could be presenting an attractive selling opportunity for the bears. The first downside target could be within the range-trading corridor, located at 1.1670. This support is confirmed by two Fibsn 78.6% and 161.8% as can be seen on the chart. However, if EUR/USD manages to break below the 1.1600 price area, a further decline should be expected to take place, dropping the price as low as 1.1400 support.
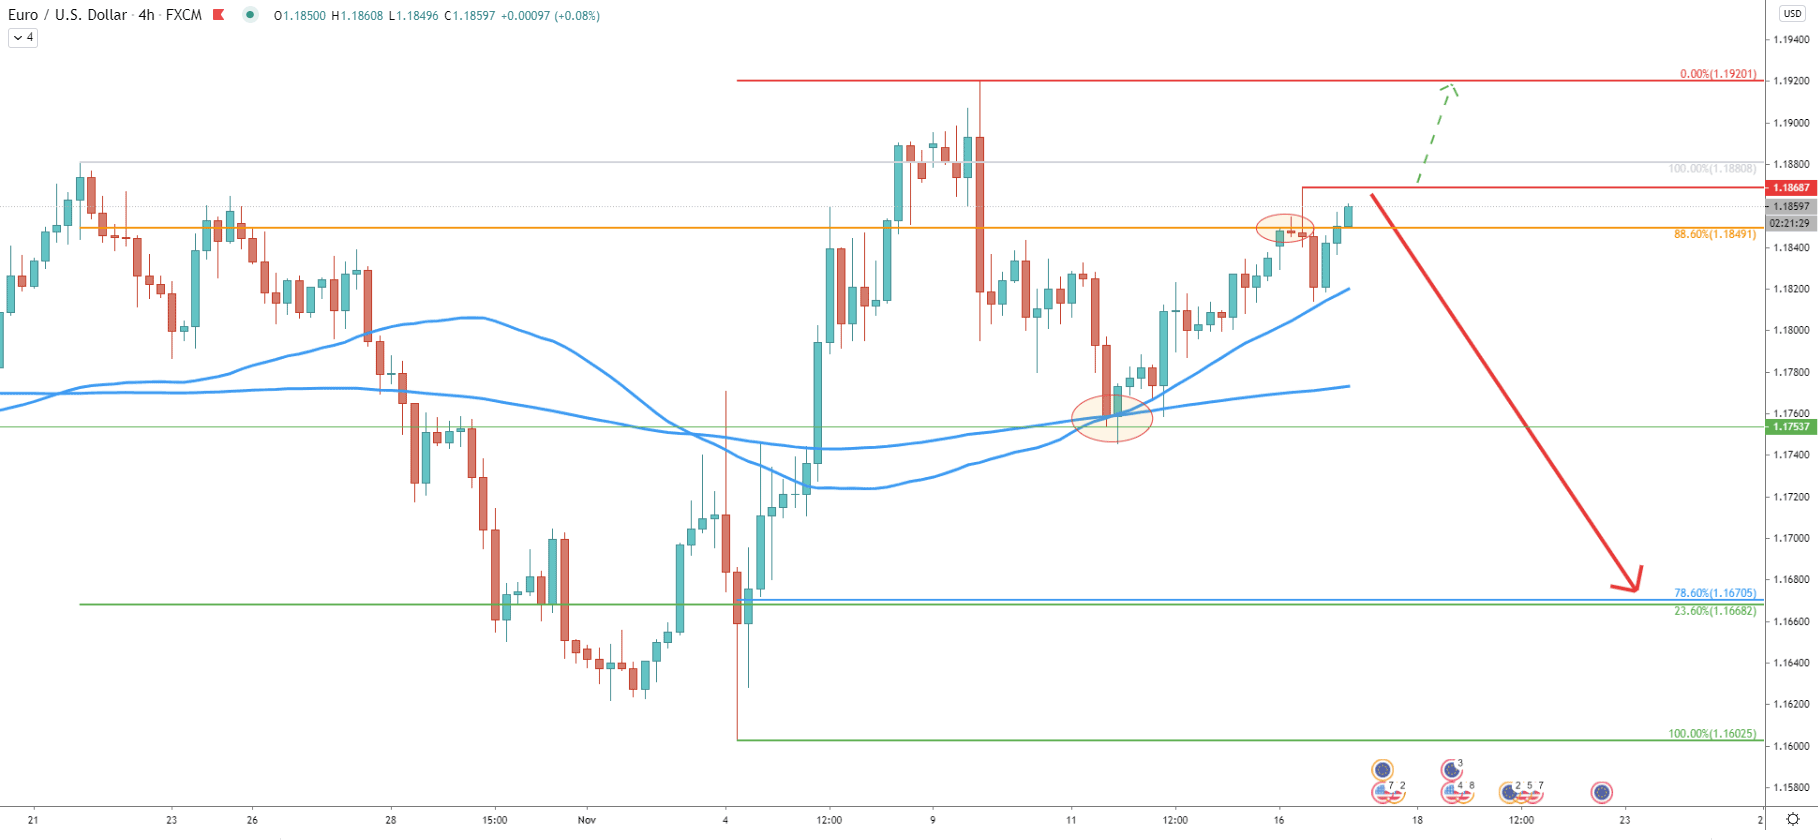
On the 4-hour chart, there is still a mixed sentiment. This is because EUR/USD has rejected 50 Simple and Exponential Moving average, which were acting as the support near 1.1753. But on the other hand, EUR/USD has rejected the 88.6% Fibonacci resistance level at 1.1849. The spike has produced above the Fibs, although failed to close higher.
Perhaps the appropriate conclusion to make is if EUR/USD 4-hour closing price will remain below 1.1868, sellers will continue to dominate. This scenario suggests a 400+ pips downside move, which might take place in the weeks to come. Upon the 4h beak and close above 1.1868, the battle between sellers and buyers will be much stronger and there won’t be a definitive priority in terms of the medium-term trend.
The long-term trend for EUR/USD is still bearish. Even on lower timeframes, price action is in favor of the downside move, whether small or large. As long as the price is within the range as per the 6-hour chart, selling opportunities are likely to be presented.
In total, there are 3 key support areas to watch, each of which could be the final downside target if it will get rejected when reached. The nearest support, as per the 6-hour chart is located at 1.1670. Then comes the psychological support level at 1.1600. And finally, as per the daily chart, yet another strong support is right at 1.1400. If/when it’ll get hit, EUR/USD decline from the current price will be 460 pips.
As per the 4-hour chart, 4h break and close above the 1.1868 resistance can substantially reduce the downside pressure for the EUR/USD. Although only daily break and close below 1.1920 resistance will completely invalidate bearish forecast and EUR/USD is likely to re-test 1.2000 key psychological level, before/if long term uptrend will start.
Support: 1.1753, 1.1670, 1.1600, 1.1400
Resistance: 1.1868, 1.1920, 1.2000


