
Published: October 9th, 2020
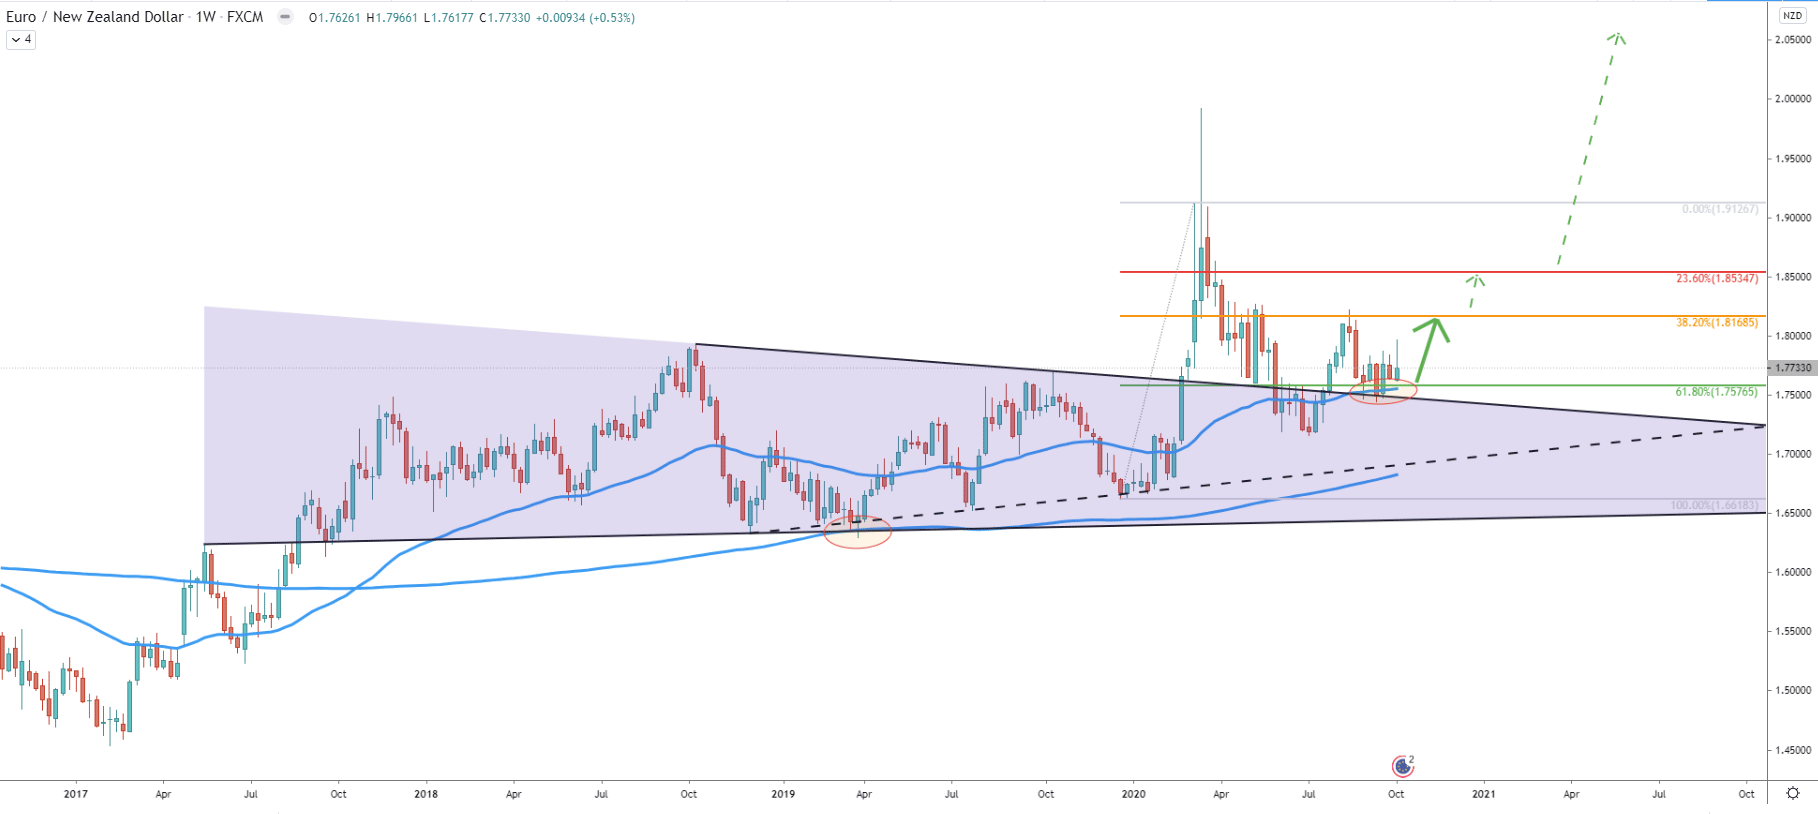
The weekly chart clearly shows the price tendency, which is obviously bullish. EUR/NZD has been stuck within the triangle pattern for nearly 3 years, but then, with the beginning of a global pandemic, the price went up and broke above the downtrend trendline. Prior to that, there were multiple bounces off the uptrend trendline while price also rejected the 200 Exponential Moving Average.
After the breakout to the upside, the pair found the resistance at 1.9126. Price attempted to break above but only produced a huge weekly spike, testing the 1.9927 high. Fibonacci retracement indicator was applied to the last wave to the upside and it shows two nearest resistance levels. The 1.8168, which is 38.2% Fibs and 1.8534, which is 23.6% Fibs. Of course, the nearest resistance level at 1.8168 must be watched first, for either the rejection or a breakout if/when the price will get there. But considering the recent rejection of the 67.8% Fibs at 1.7575 as well as the 50 Exponential Moving Average, the probability is strongly in favor of the uptrend continuation.
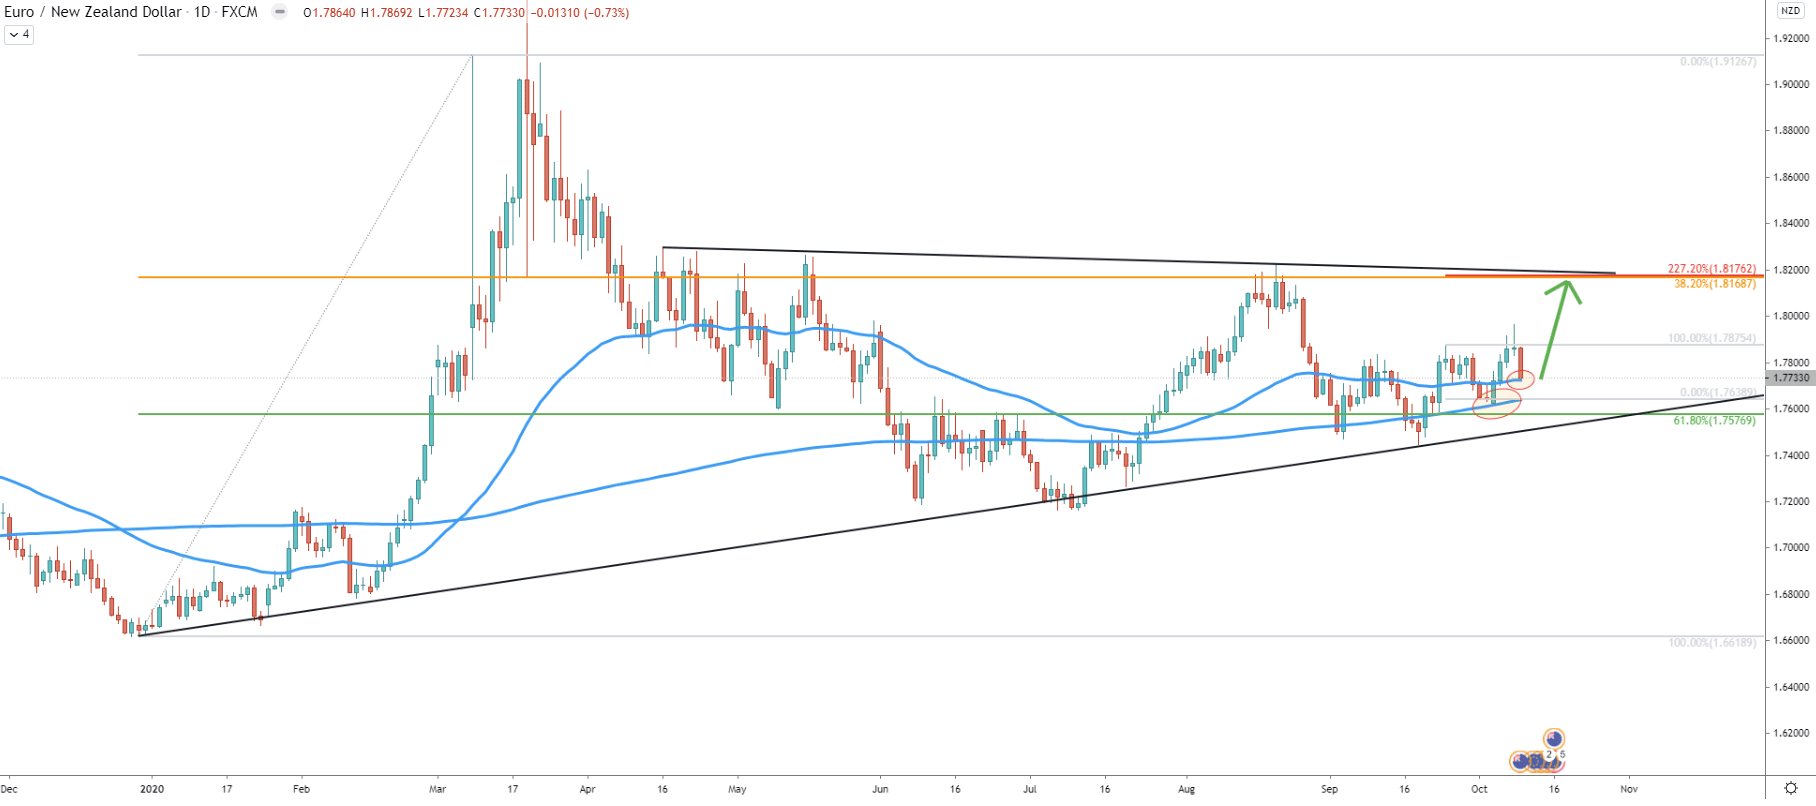
On the Daily chart, EUR/NZD has rejected the simple uptrend trendline and remains above both the 50 and 200 Exponential Moving Average. Recently price rejected the 200 EMA, and this downside correction was used to applied another Fibonacci retracement indicator. It can be seen that 227.2% Fibs almost exactly corresponds to the previously mentioned resistance at 1.8668, which also corresponds to the downtrend trendline.
Keeping in mind that 200 EMA was already rejected, right now EUR/NZD is rejecting the 50 EMA. This could be the trigger point for buyers and if that will be the case, price should continue trending up in the long term.
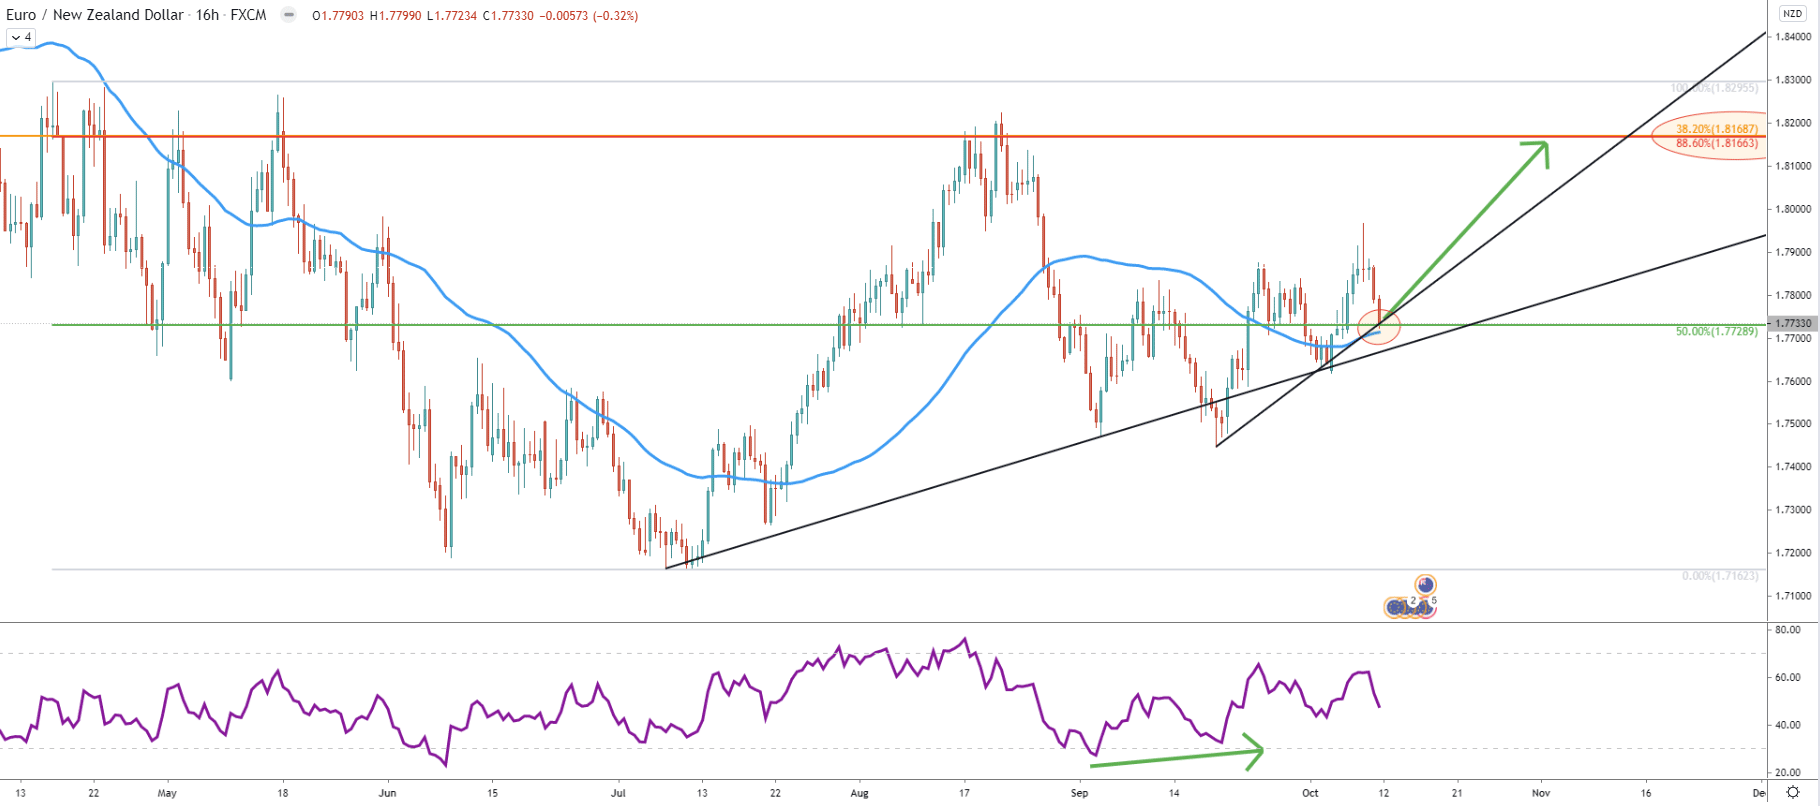
Yet again, the uptrend trendline has been rejected, this time on the 16-hour timeframe. In September, the RSI oscillator formed a bullish divergence and price went up, breaking above the 50 EMA and establishing a new higher high. This week’s closing price failed to close below the 50 EMA support and what is also important, is the rejection of the 50% Fibonacci retracement level at 1.7728. And finally, the second downtrend trendline was also rejected, while all these facts are strongly in favor of the uptrend continuation.
In regards to the nearest resistance level and the potential medium-term upside target, on this chart is it also confirmed by an 88.6% Fibonacci retracement level.
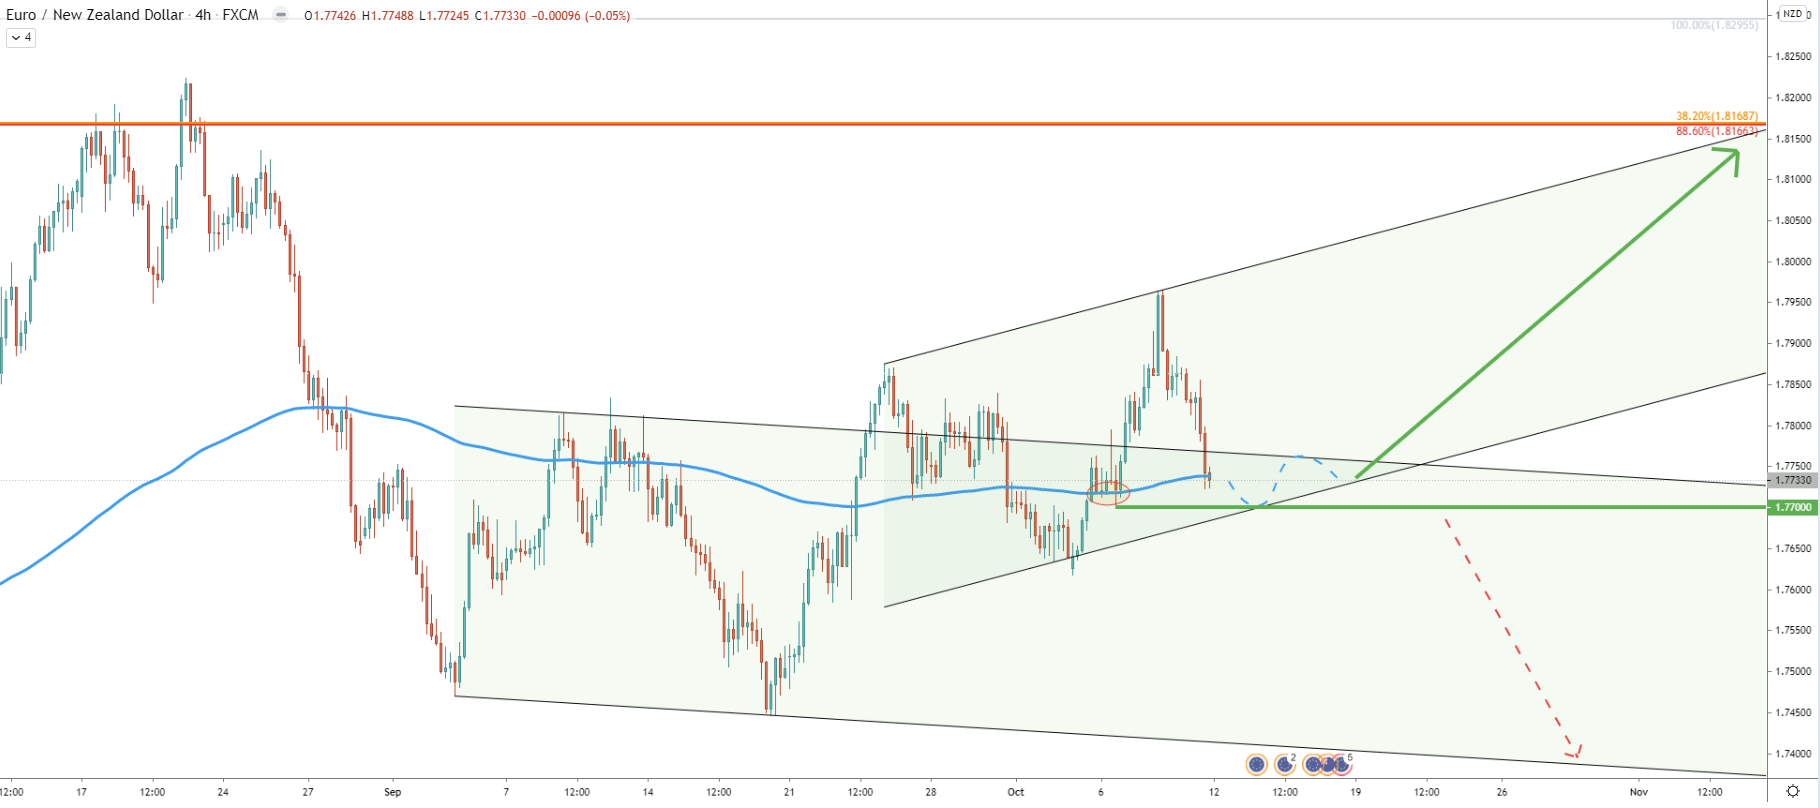
There are two channels on this chart, the descending and ascending. The descending channel has been penetrated, and the price broke to the upside suggesting further growth. On the other hand, the ascending channel remains valid and the price has’t’ tested the bottom of it. But the 200 EMA was rejected already, this is where price has produced a low at 1.7700, an extremely strong psychological support. Right now there is another rejection of the EMA, although not confirmed yet. This means that there could be either a rejection, after which EUR/NZD will start moving to the upside. Or there will be a break to the downside, which is likely to result in price re-testing 1.7700, before/if the uptrend continues.
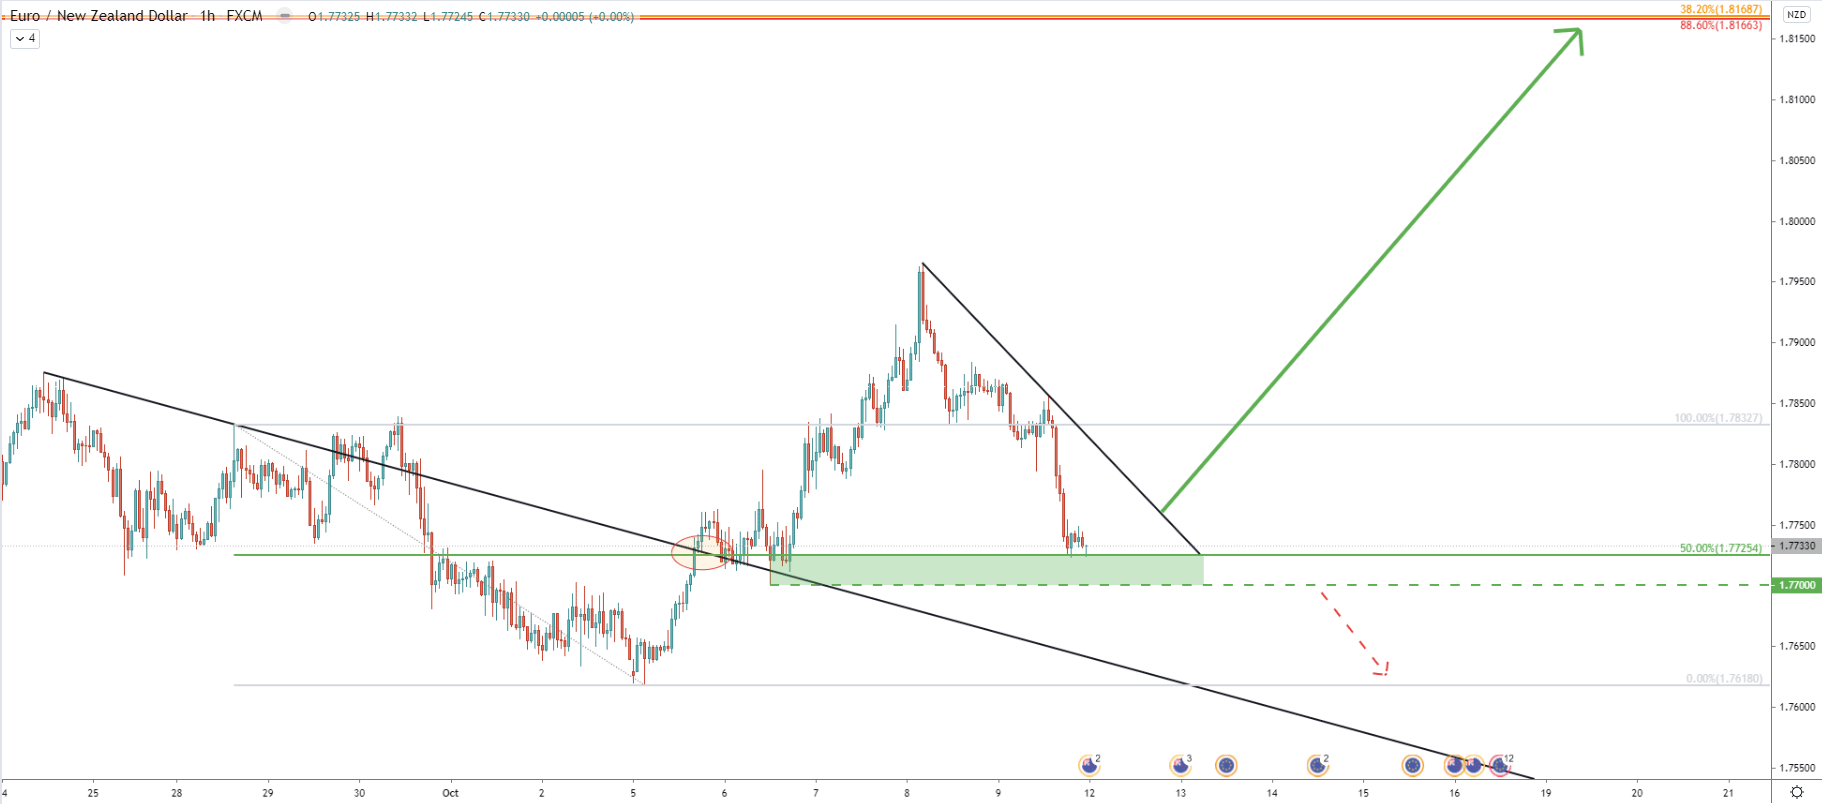
The hourly chart clearly shows the potential demand zone, which is located between 1.7700 and 1.7725. The 1.7725 support level is confirmed by 50% and corresponds to the downtrend trendline breakout point. While the price action remains very bullish, and the current correction should start inviting long-term buyers, the final confirmation of an uptrend could be a break and close above the simple downtrend trendline, which might occur early next week.
The current EUR/NZD downside correction could be considered as a very attractive buying opportunity for short, medium, and long term treaders. This is because the overall trend remains bullish and right now pair is very close to the key psychological support which recently was already rejected.
If the current support area between 1.7700 - 1.7725 will continue to be respected, the EUR/NZD uptrend continuation is imminent. This might result in price rising towards the 1.8165 resistance area confirmed by 3 different Fibonacci retracement levels and corresponding to the long-term downtrend trendline. All-in-all, there is over 400 pips growth potential.
Only daily and/or weekly break and close below the 1.7700 psychological level will completely invalidate the bullish forecast. In this scenario, the price will either consolidate or will slowly be changing the direction of the trend.
Support: 1.7725, 1.7700
Resistance: 1.7825, 1.8165