
Published: May 6th, 2020
There are multiple factors indicating the weakness of the EUR. In one of our recent analysis, we shared a similar view on the EUR/GBP currency pair. In today’s analysis, we’ll analyze the EUR/NZD which could be at the very beginning of a strong fall.
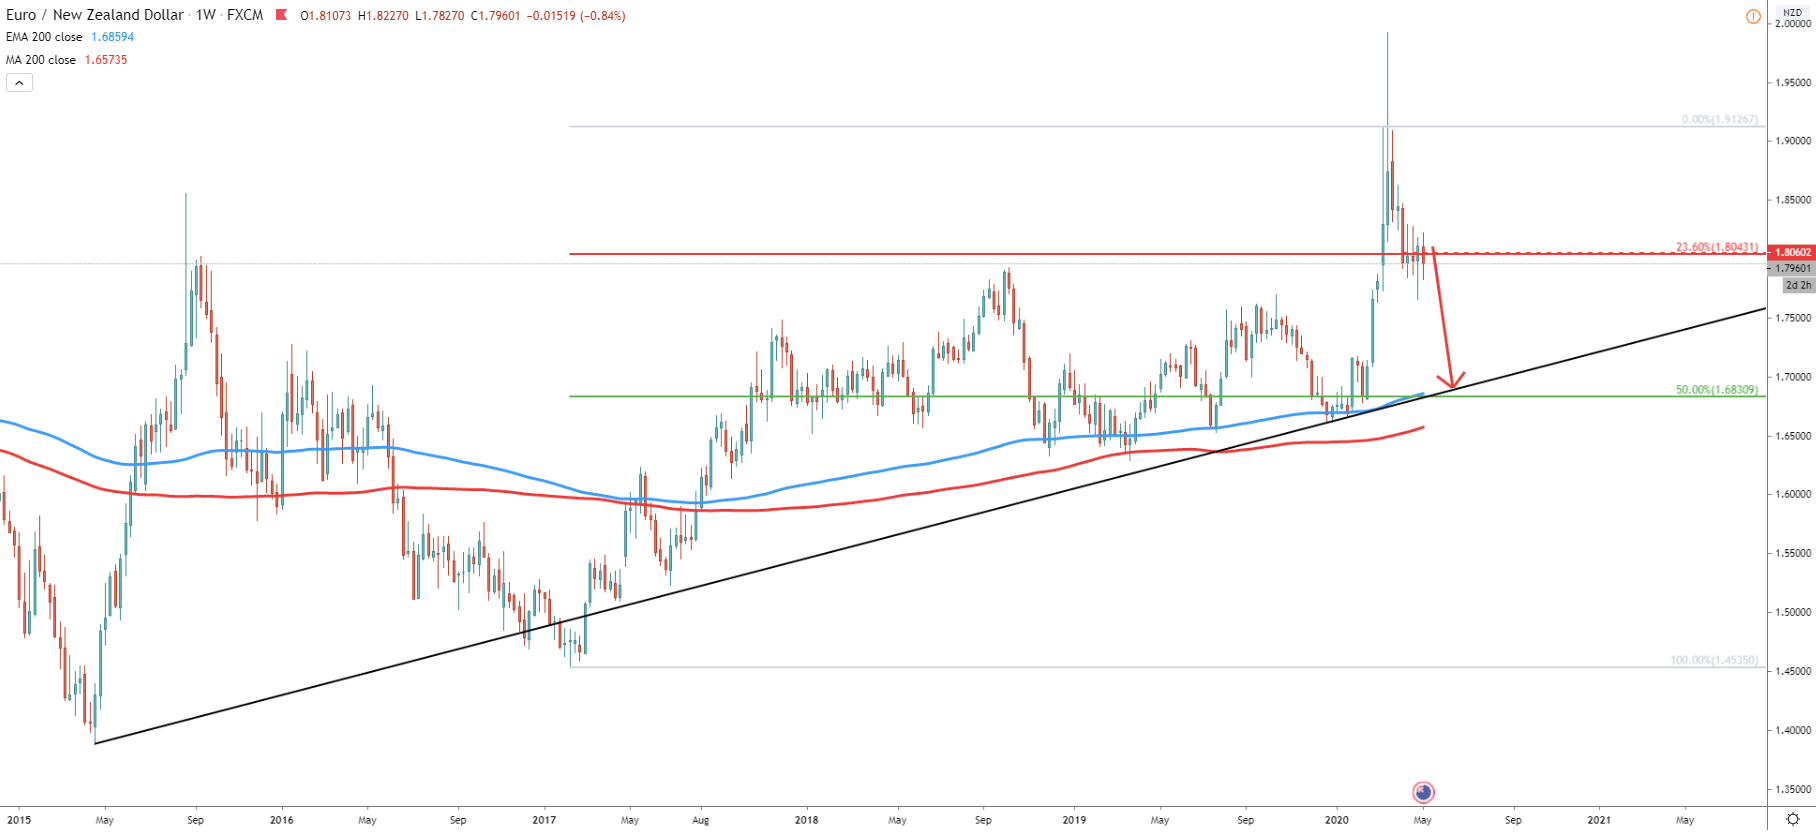
To see the big picture lets observe the Weekly chart first. Higher highs and higher lows being printed, although if we look at August 2015 high and compare it with the most recent price action, there was no clean break above the previous high. Fibonacci applied to the February 2017 - March 2020 uptrend, shows that EUR/NZD broke below the 23.6% Fibonacci support at 1.8041. In fact, after the breakout, price attempted to go up, but after 4 weeks and multiple spikes above the 1.8041, EUR/NZD still remains below this resistance. This shows a strong bearish pressure, which could start pushing price down quite a lot and very soon. The downside target is seen at the most common retracement level - 50% Fibs, which is 1.6830. This makes a potential downside move of more than 1200 pips from the current level. This support corresponds to the 200 Exponential Moving Average and the uptrend trendline.
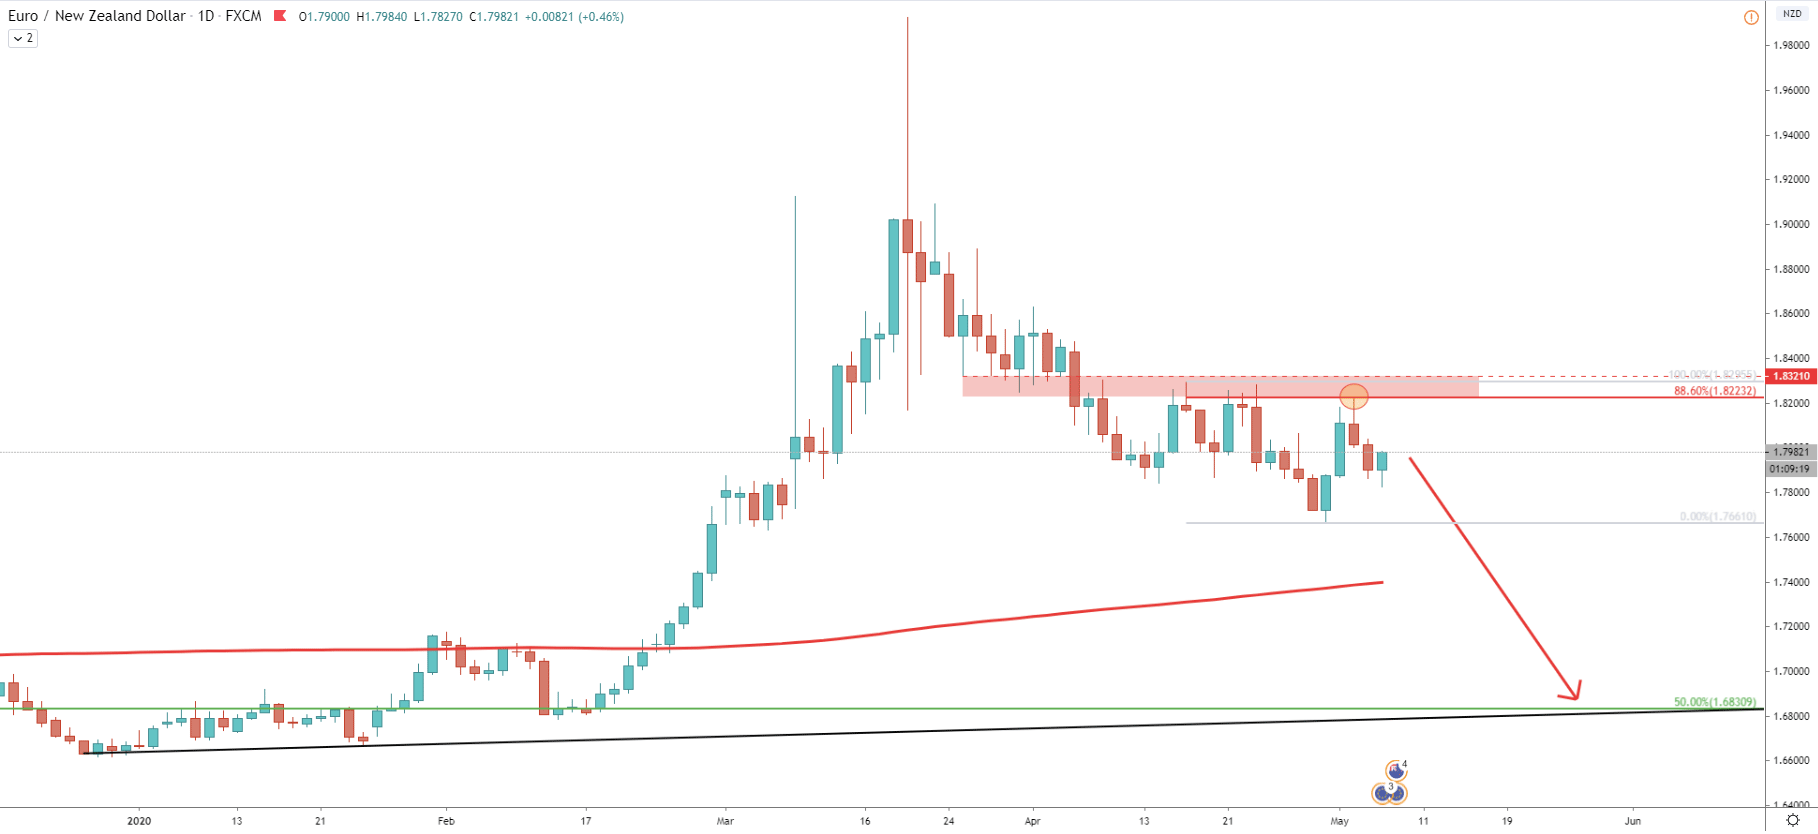
On the Daily chart, price formed a resistance area between 1.8223 and 1.8321. Just a few days back, EUR/NZD has cleanly rejected 1.8223, which is 88.6% Fibonacci retracement level. Perhaps such price action will start inviting more sellers and this week’s price might start moving down. Interestingly, on the Daily chart, the downside target also corresponds to the uptrend trendline, which is a completely different trendline comparing to the Weekly chart.
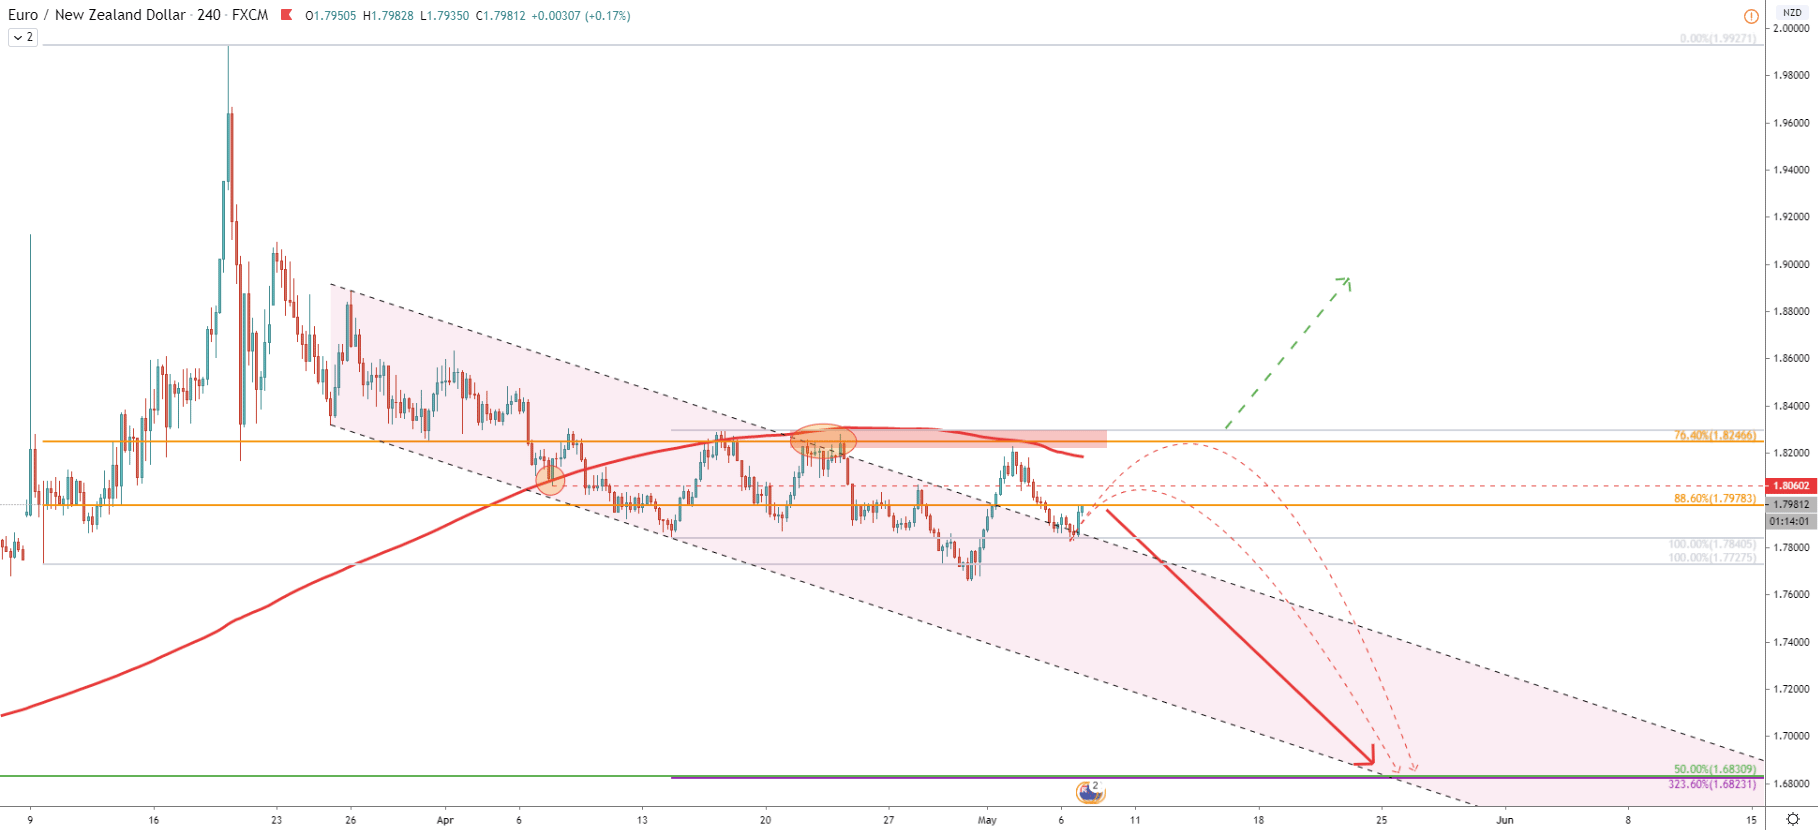
On the 4Hchart, EUR/NZD has been moving within the descending channel for quite some time. We can also see the rejection of the upper trendline on April 21. Fibonacci, applied to the last wave up, occurred between 09 - 19 March, shows that both 76.4% and 88.6% support levels were broken. Not only broken, but they were and still are acting as the resistance levels. Today EUR/NZD has reached 88.6% retracement at 1.7978 and rejected it cleanly. This could be a strong supply area, but only if EUR/NZD will remain below the resistance. If price breaks higher, the downtrend validity will not be compromised, although the pair is likely to correct further up, before moving down.
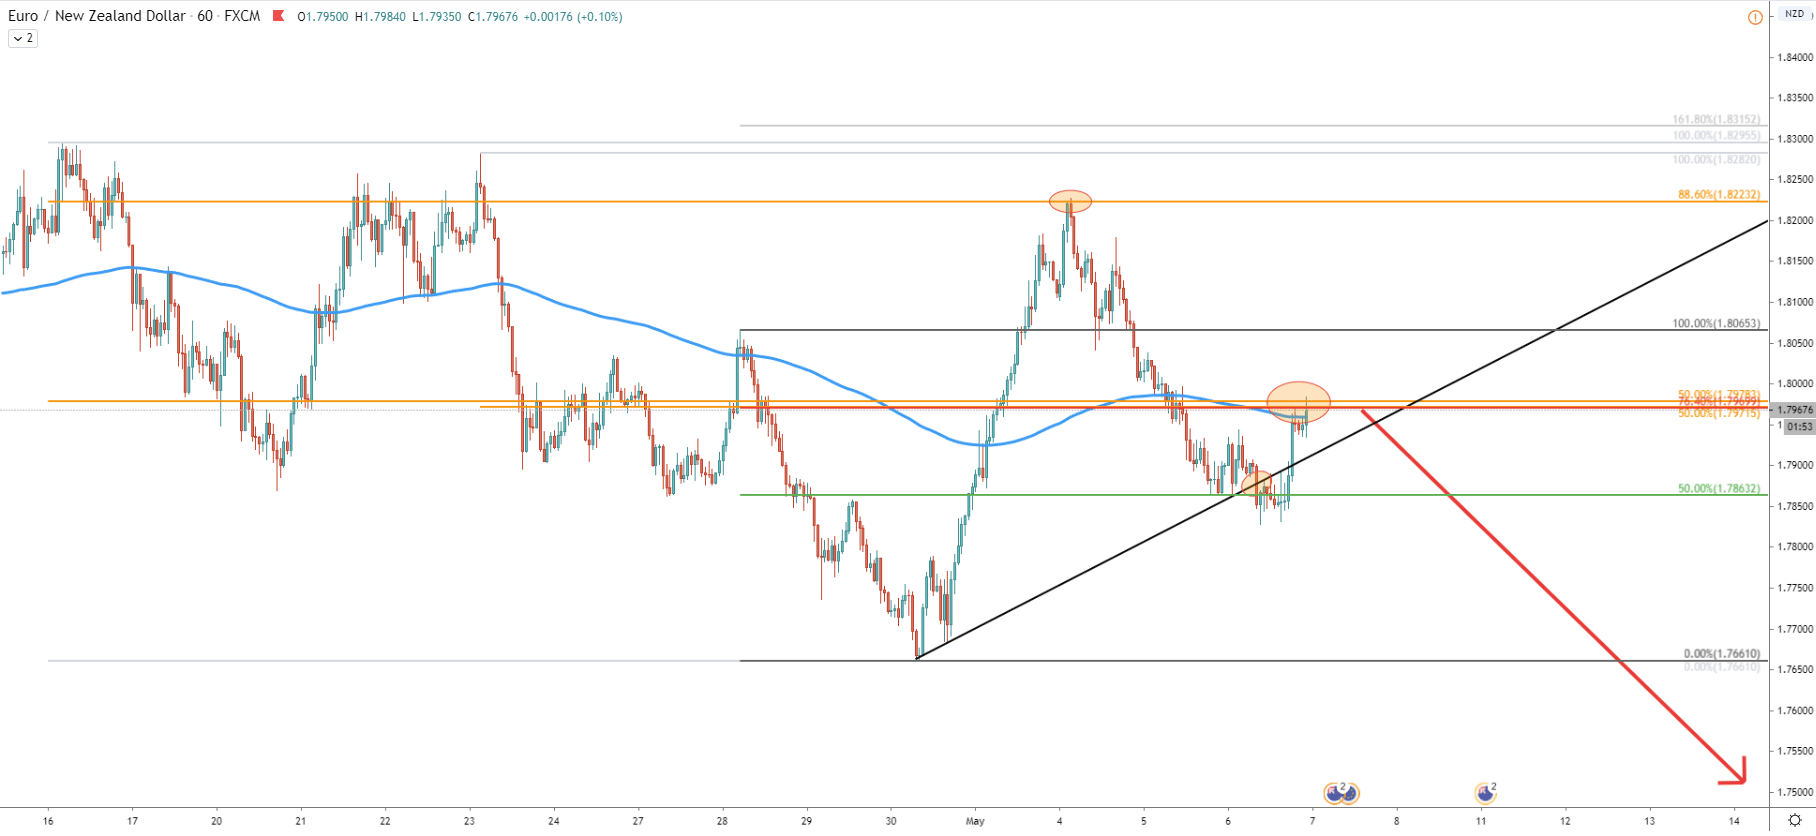
The 1H chart shows the importance of the 1.7980 resistance area. This is because it corresponds to 3 different Fibonacci retracement levels at the same time. But also, it corresponds to the 200 Exponential Moving Average, which is being rejected as well. And Finally, 50% Fib support has been broken, along with the uptrend trendline. All this price action is greatly in favor of the incoming massive downtrend.
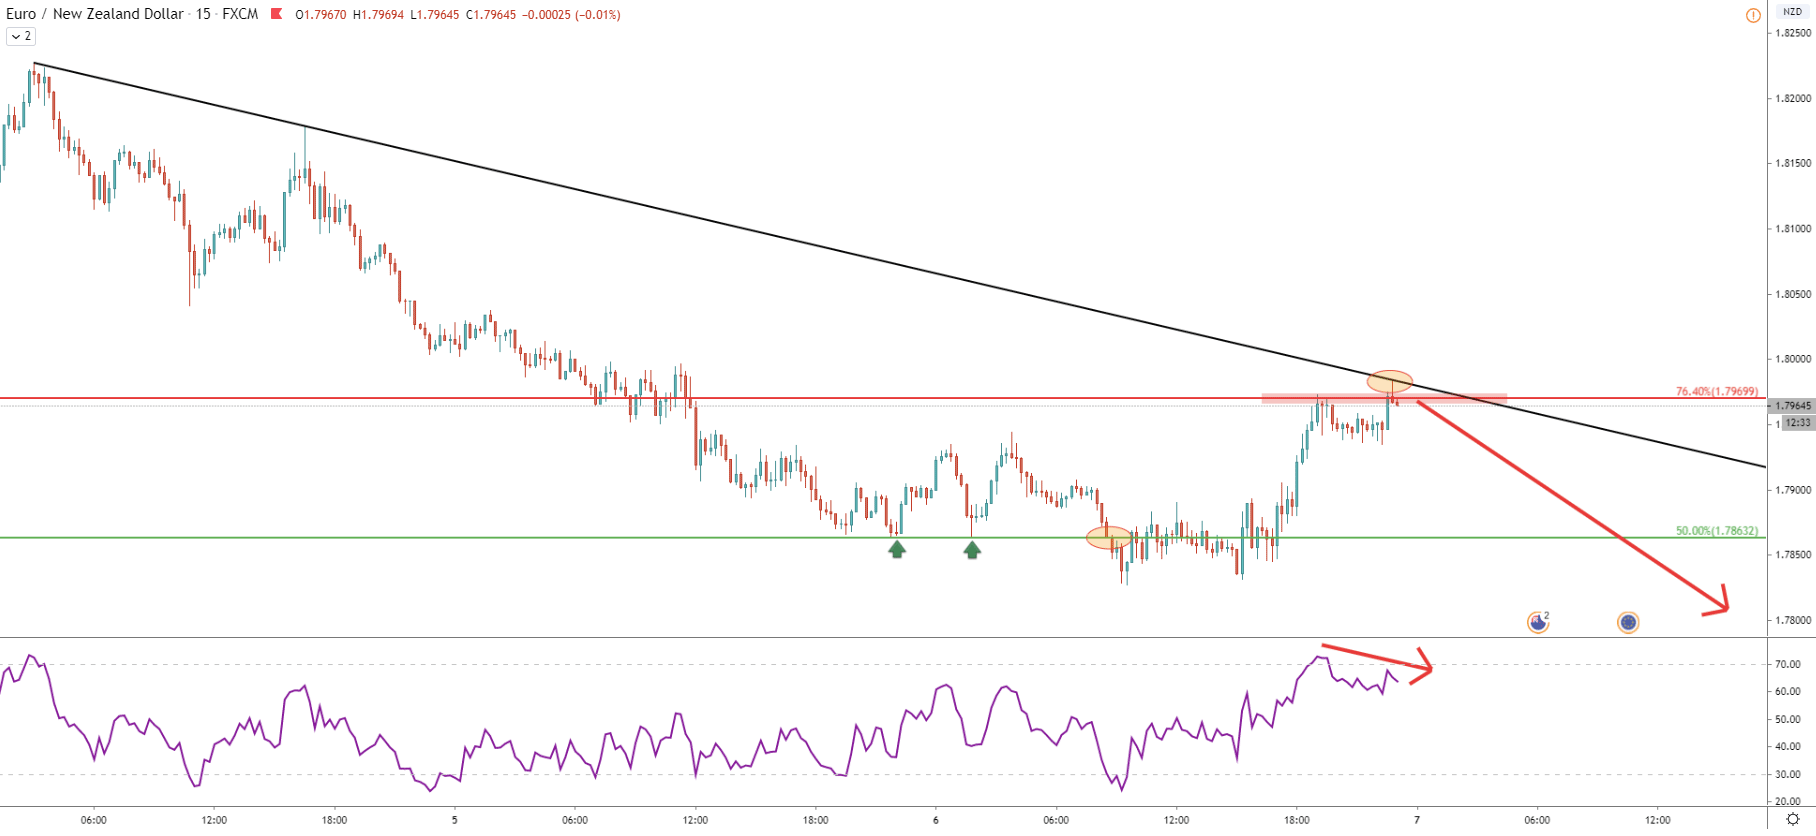
In the current resistance area, the RSI oscillator formed a bearish divergence while rejecting the downtrend trendline. Yet again this just confirms bearish domination in the short and long timeframes.
The EUR is straggling across the board and starting losing position to other major currencies. EUR/NZD is not an exception, and while currently trading at the resistance area, the price could be reversing to the downside at any time. This seems like a potential long term decline, where over 1200 pip price drop is expected.
There is one key support level that can be seen clearly on the 4H chart. This is 1.6830 level, corresponding to two Fibonacci retracement levels.
The key resistance level is at 1.8300, where the price bounced off the 200 EMA on the 4H chart. Break and close above this level, on the Daily and 4H charts, will invalidate bearish scenario and EUR/NZD should continue moving up in order to re-test 2.0000 psychological resistance.
Support: 1.6830
Resistance: 1.7978, 1.8060, 1.8246, 1.8300


