
Published: February 25th, 2021
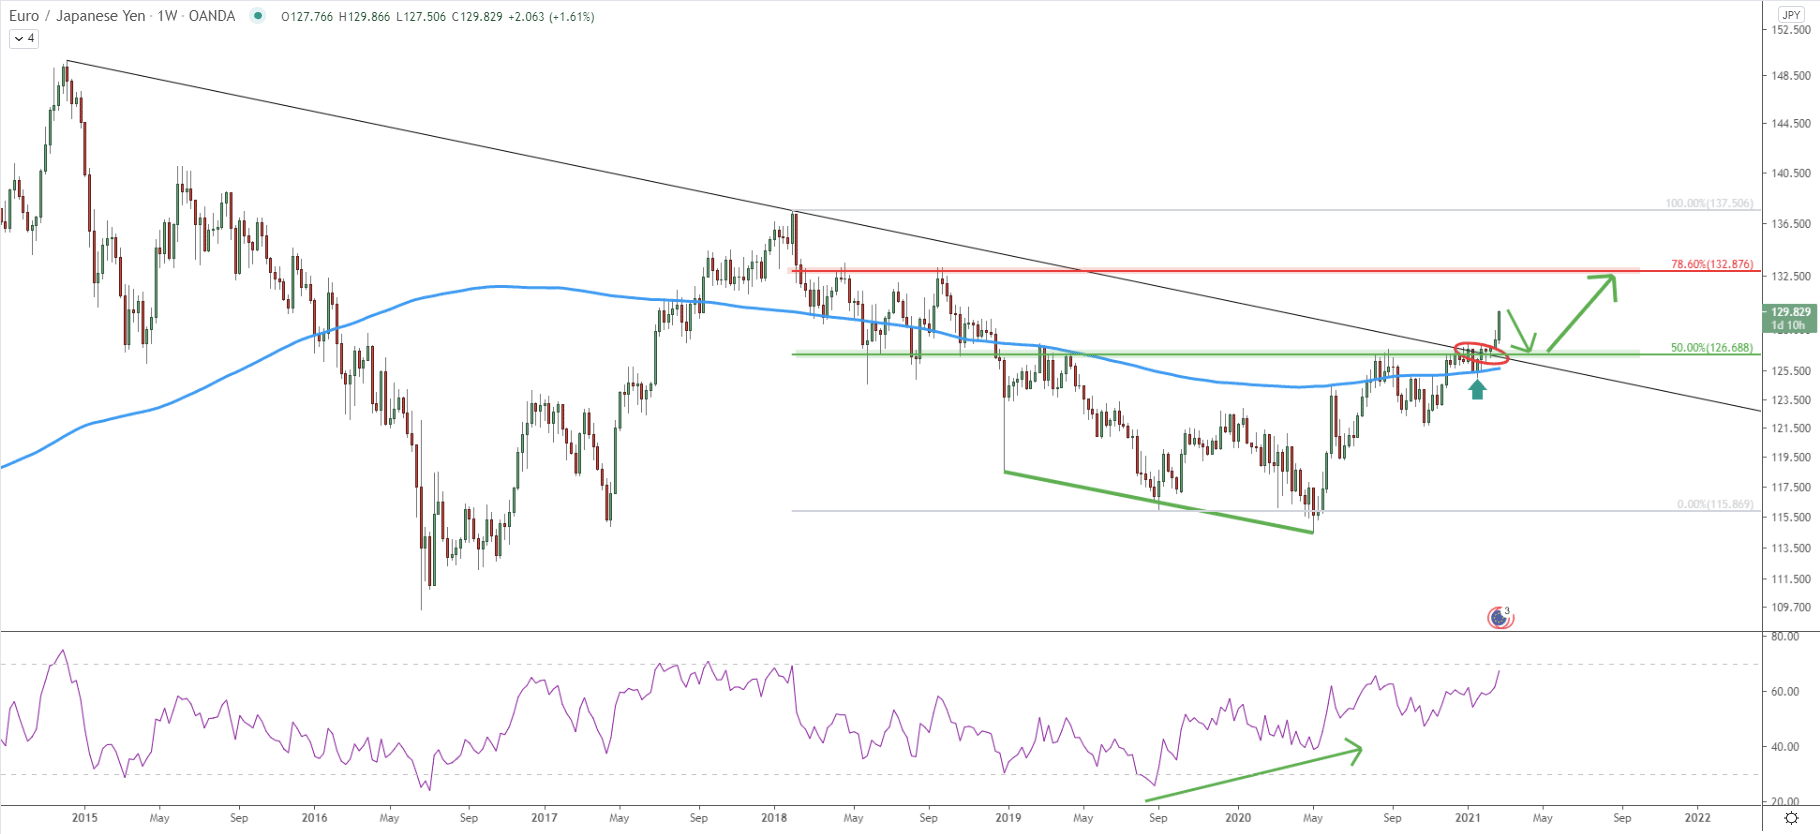
Just a month ago, EUR/JPY broke above the critical resistance area which is located near 126.68, and is confirmed by the 50% Fibonacci retracement level applied to the previous corrective move down. At the same time, this is a strong supply/demand zone, which already acted as the support and resistance multiple times.
If we look a little be back, From September 2019 up until September 2020, the RSI oscillator has been forming a bullish divergence, which eventually resulting in a strong move up, where the price broke above the 200 Simple Moving Average. After the breakout price pulled back and rejected the 200 SMA, which this time acted as the support. Following the bounce, the price went up, and last week it finally broke above the 126.68 resistance. It can also be seen that the downtrend trendline was penetrated, suggesting the change in trend for the long run.
Nonetheless, considering a very strong growth during the past few weeks, a corrective move down should be expected prior to the uptrend continuation. The most obvious support and the potential demand area is yet again located near 126.68. When/if this area will be reached, buyers are likely to step in, which can result in the price increase towards the 132.87 resistance area. This is also a supply/demand zone, which is confirmed by 78.6% Fibs, which makes it a very attractive profit-taking price area.
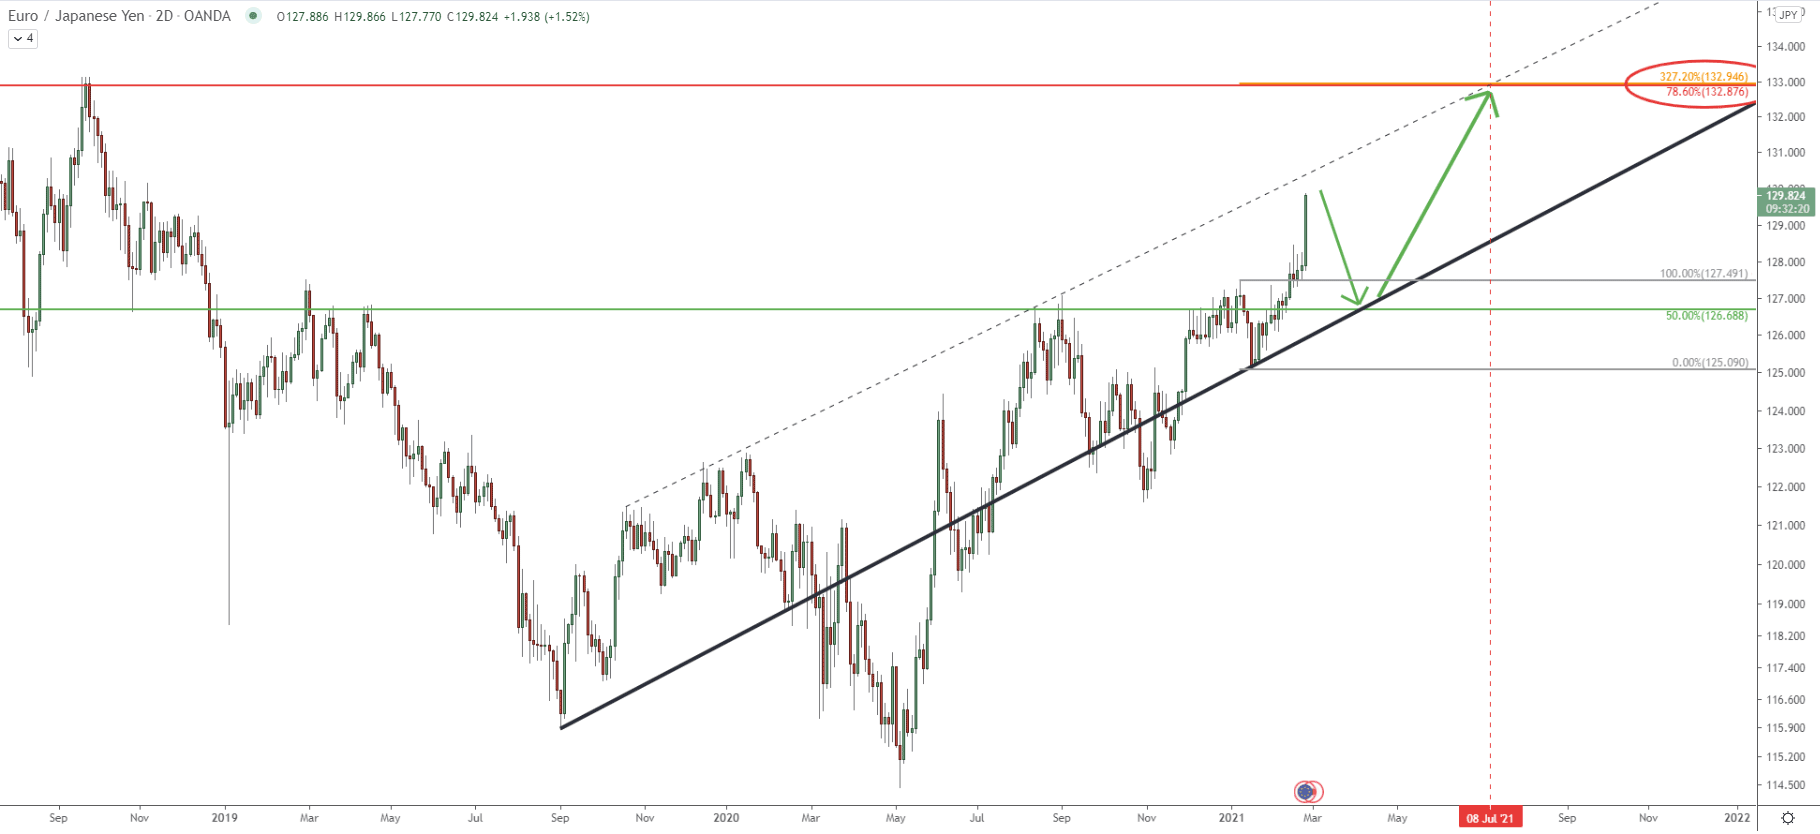
On this chart, we can witness how the price is moving around the average price uptrend trendline. The most recent bounce off the trendline occurred at the beginning of 2021 and considering that the price pullback can be expected, it would be reasonable to assume that the trendline will be tested once again. Besides, it is corresponding to the 126.68 support level, suggesting that EUR/JPY might be near the demand area within just one week.
Another trendline, which is the resistance trendline, shows that the upside target could be tested by June 8, because this is the time when it crosses with the 132.90 resistance area. And speaking of resistance, on this chart, it is confirmed with yet another Fibonacci retracement level, this time it is 327.2% Fibs applied to the corrective move down where the trendline got rejected last time.
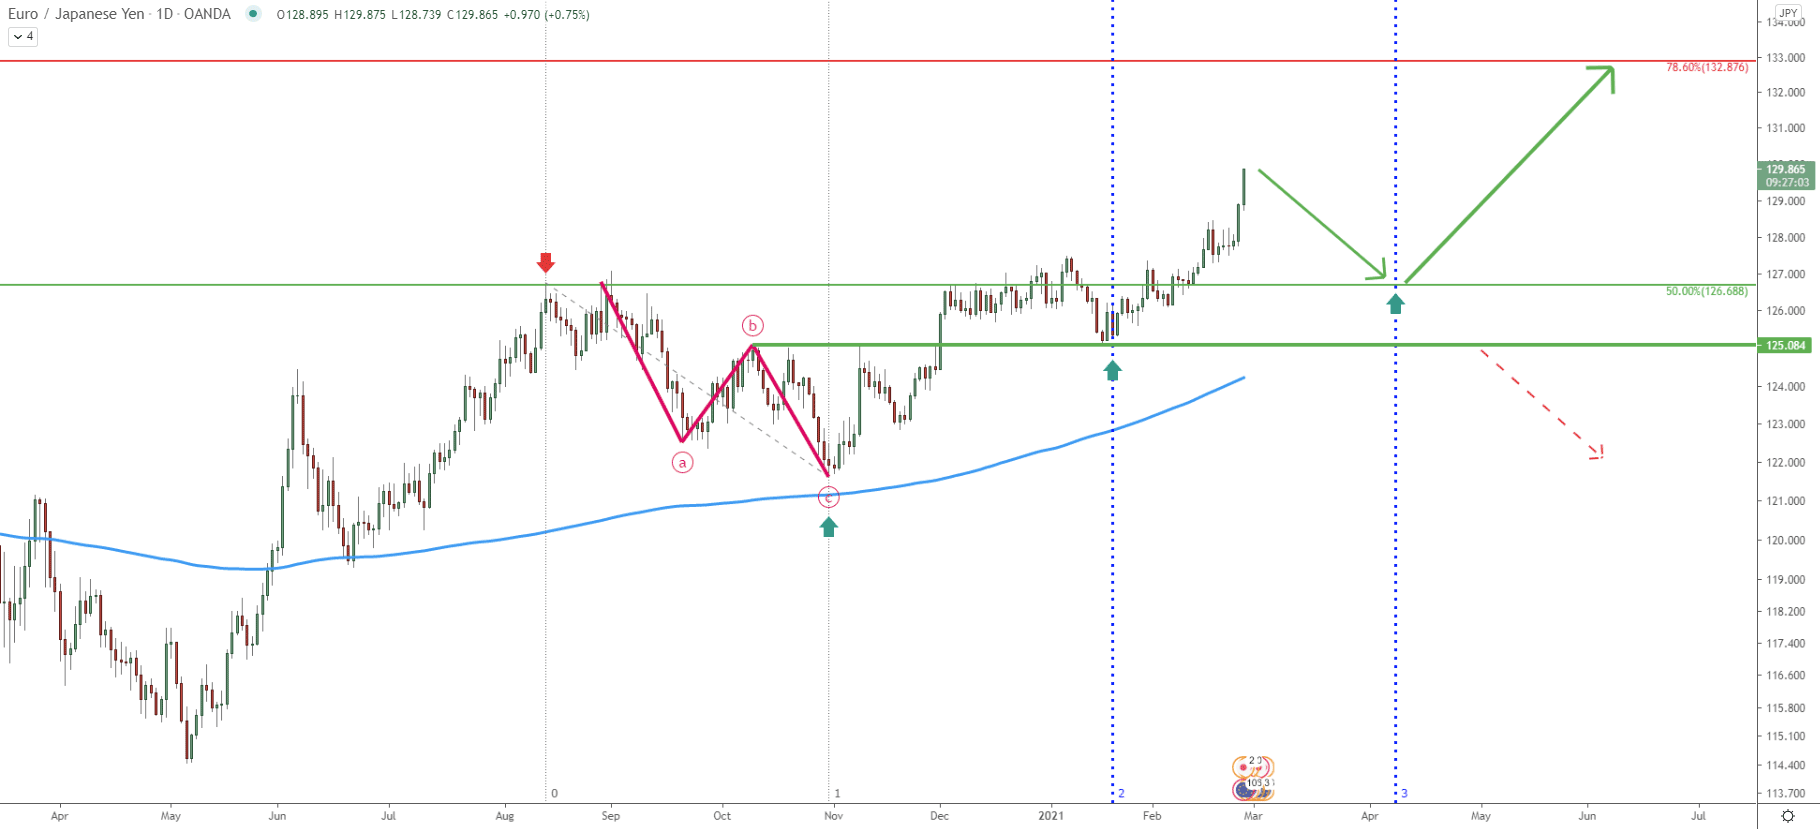
On the daily chart, the trend is clearly bullish, because the price is producing higher highs and higher lows and remains above the 200 EMA. Back in November 2020, EUR/JPY price has completed an ABC corrective pattern based on the Elliott Wave theory. After breaking above wave B, the price went up and upon the correction found the support at 125.08, which previously was the resistance.
Another important factor is that the Fibonacci cycle indicator shows that when 125.08 support was rejected, a new bullish cycle has started. It can be seen that the next cycle is starting at the beginning of April and it could be either the beginning of another bullish cycle if the correction will take place, or it will be the end of the current bullish cycle.
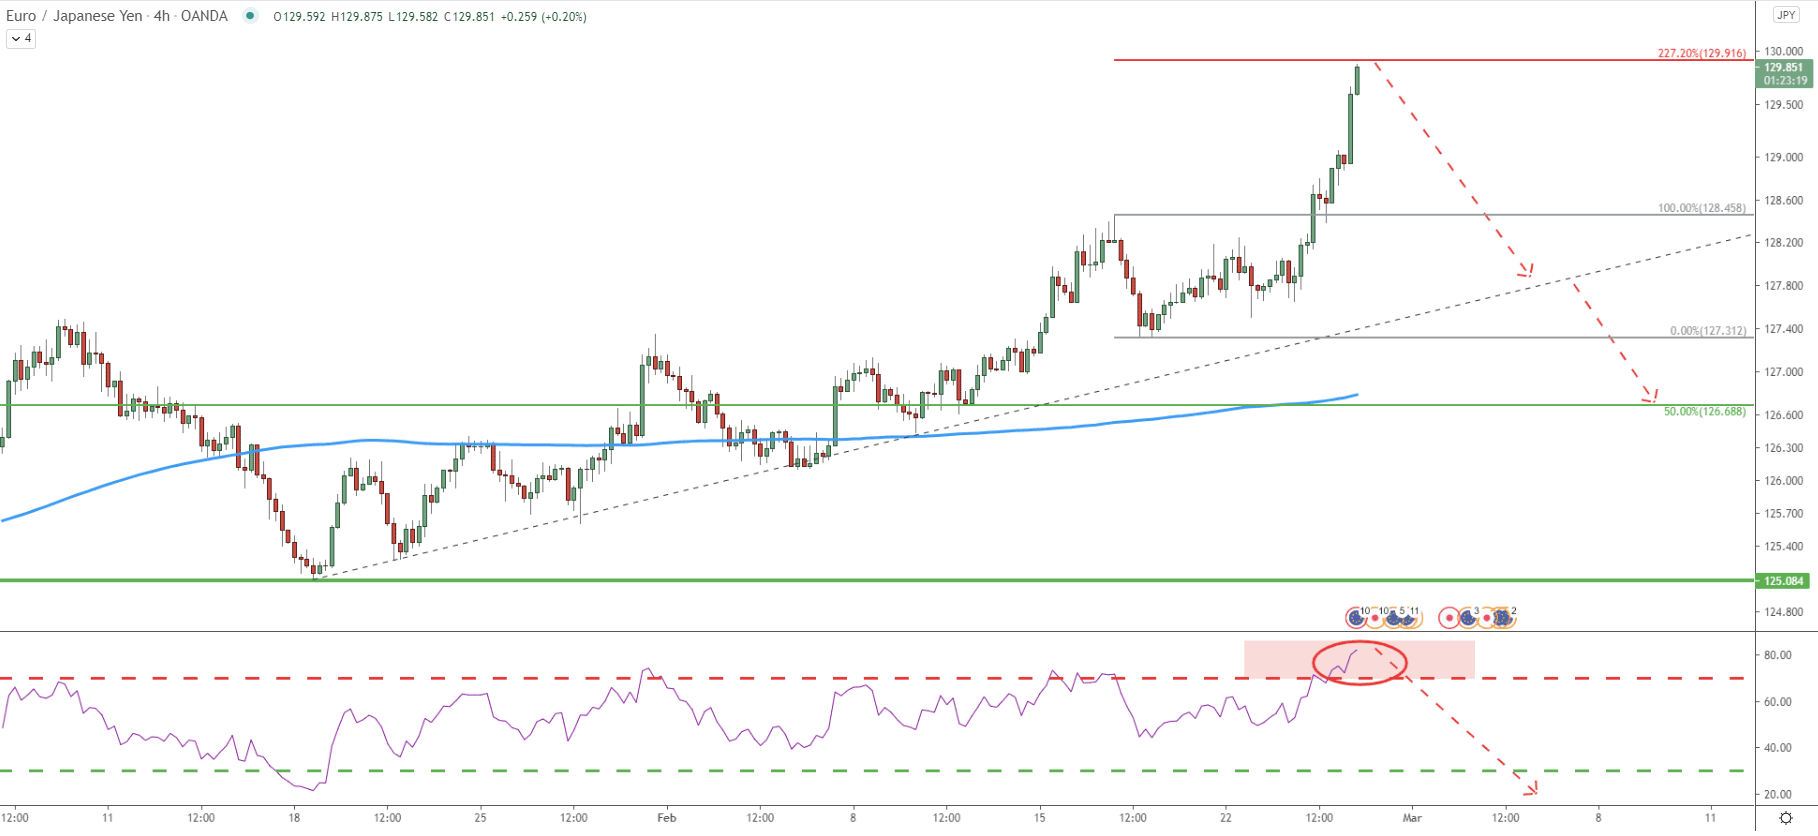
The 4-hour chart clearly shows how overbought the EUR/JPY is currently is. This is based on the RSI oscillator which is above the 70 levels, showing that price could be starting to correct down soon. Another thing is that EUR/JPY is approaching the 227.2% Fibonacci resistance level at 129.91, and if it will get rejected, a strong pullback will be imminent. In this scenario, the correction is likely to take one or two weeks. The first support is likely to be found at the simple uptrend trendline, then if EUR/JPY will break lower, then the 200 EMA is likely to be tested near 126.68 support.
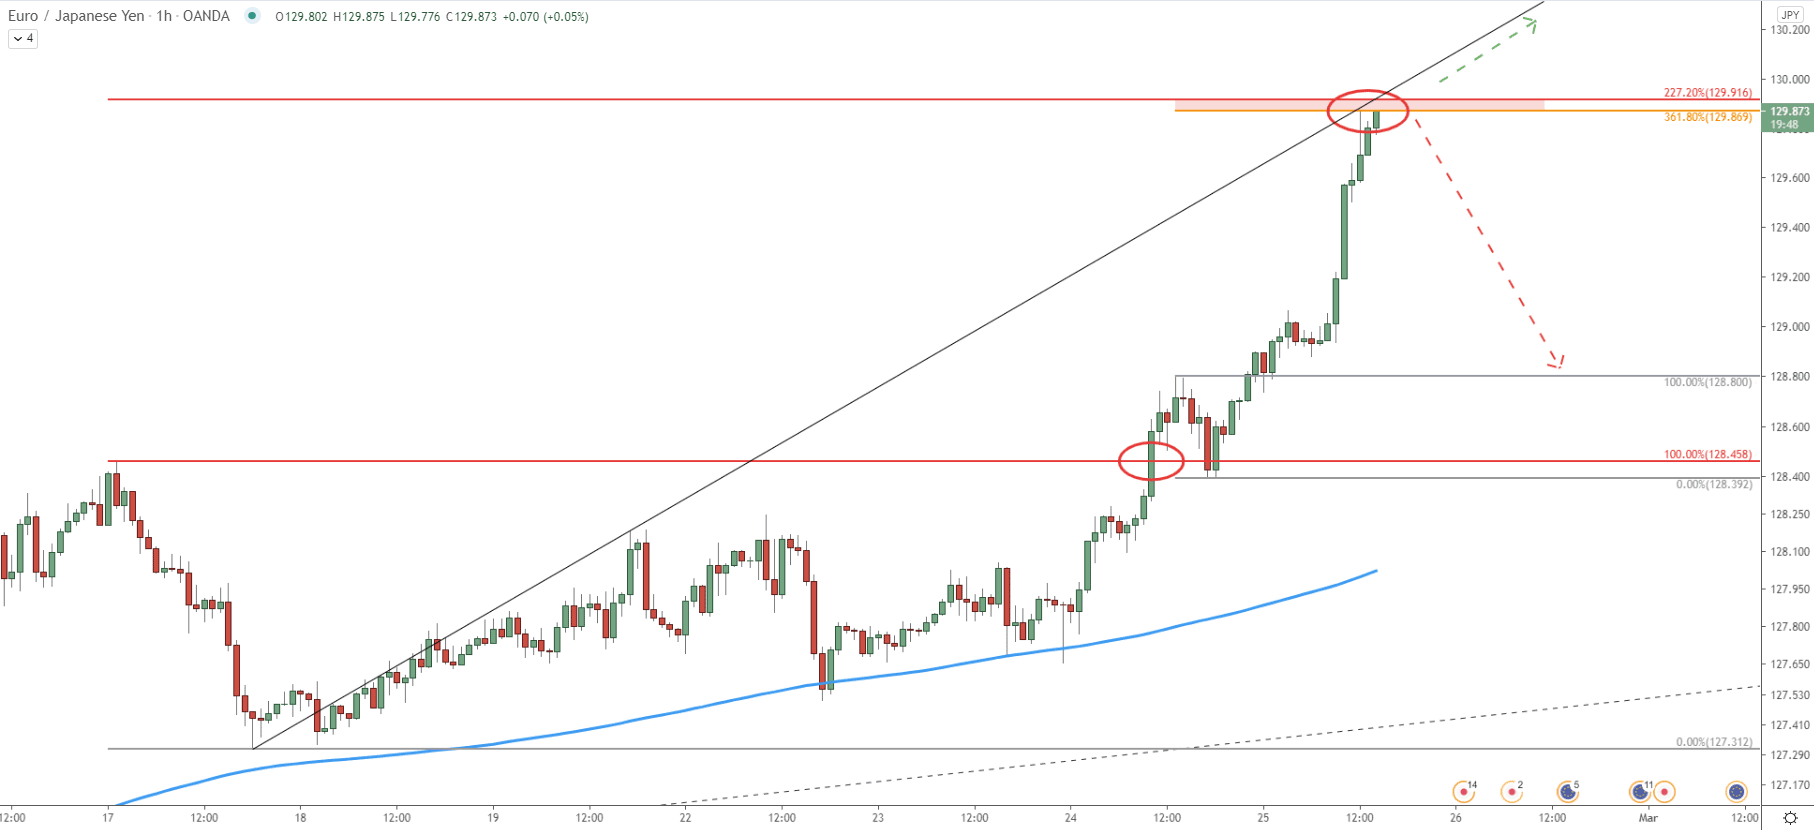
An hourly chart is clearly showing that EUR/JPY is at a much stronger resistance area than we could see on the 4-hour chart. This is because 130.00 psychological resistance corresponds to 2 Fibonacci retracement levels, the 227.2%, and 361.8% Fibs as can be seen on the chart. At the same time, the average-price uptrend trendline has been rejected, which implies that the selling pressure could be building up. Therefore, as long as the price remains below 130.00, a strong downside correction should be expected.
EUR/JPY has confirmed that the long-term trend is now bullish. But on lower timeframes, the price is facing a strong resistance, which is likely to result in a strong pullback prior to the uptrend continuation. Perhaps during the next couple of weeks, an ideal buying opportunity will be presented, for swing traders and long-term investors.
As per the weekly and 2-day chart, the key resistance is located near 132.90, which is confirmed by two Fibonacci retracement levels and goes in line with the resistance uptrend trneldine.
As per the daily chart, the key support is a 125.00 psychological level, which previously acted as the support as well as resistance. Break below this level will immediately invalidate the long-term bullish forecast, and the trend is highly likely to change from bullish to bearish.
Support: 129.70, 125.00
Resistance: 130.00, 132.87


