
Published: September 23rd, 2020
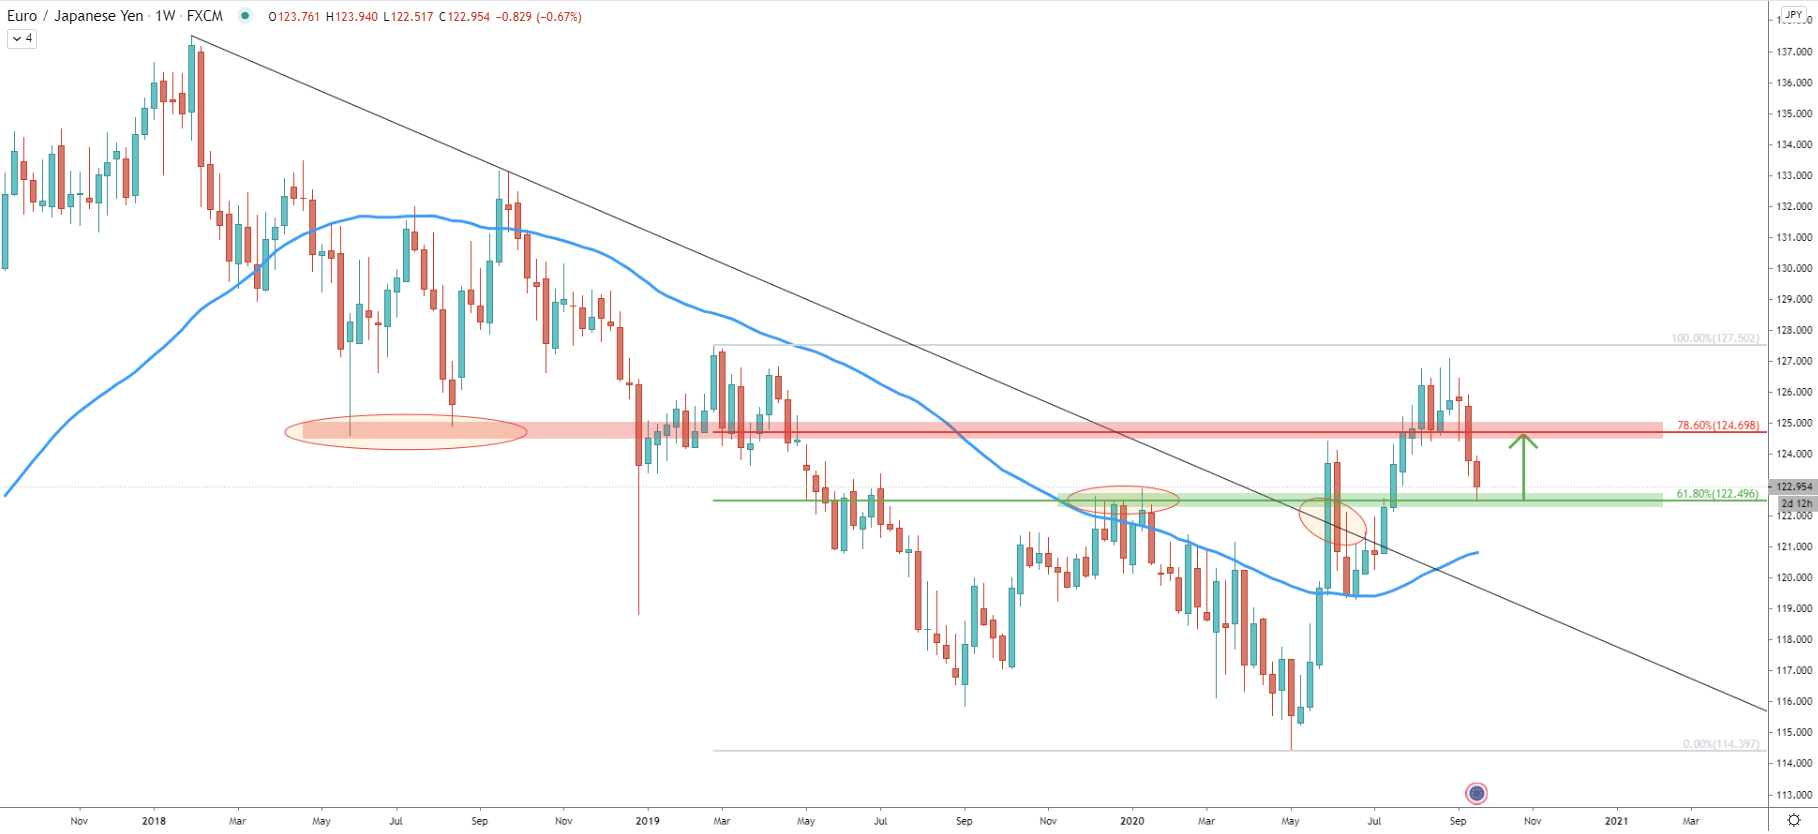
On the weekly chart, the price has bottomed out back in May, when the pair tested the 114.39 low. Since then EUR/JPY has established an uptrend, confirmation of which was break above the key resistance at 122.50 along with the breakout of the downtrend trendline and clear higher highs and higher lows pattern.
As can be seen, the resistance became the support, which is confirmed by the 61.8% Fibonacci retracement level applied to the last wave down when EUR/JPY bottomed out. This week pair has cleanly reached and rejected this Fibonacci support, which implies the validity of the long term uptrend. The nearest resistance is the 78.6% Fibonacci retracement level at 124.69, where the price could be heading as long as the current support holds. This is because previously this price area has been a strong demand zone and therefore can be expected to act as the nearest supply area if/when reached.
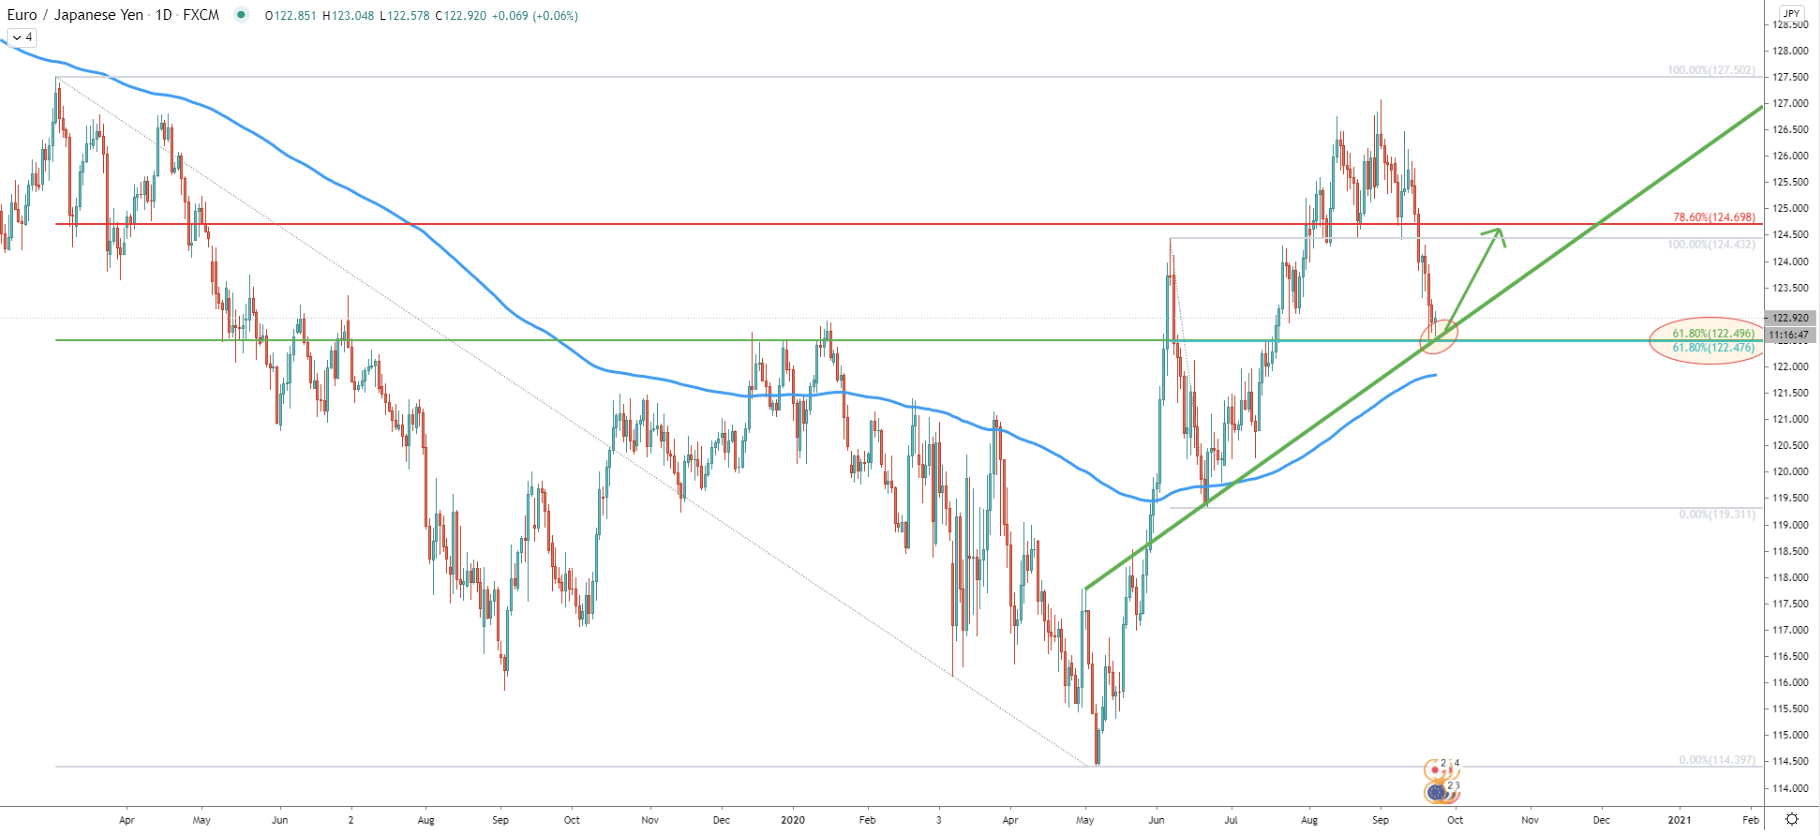
Here a clean bounce off the average-price uptrend trendline can be witness, which occurred just a few days ago. Along with the trendline, price rejected yet another Fibonacci retracement level, which is 61.8% Fibs applied to the last corrective move to the downside. This emphasized the importance of the 122.50 support area, and clearly shows how strongly it has been defended throughout this week. Besides, price is still producing higher highs and higher lows while remains above the 200 EMA. This goes to show the validity of the uptrend and right now, the price could be at the bottom of the downside correction.
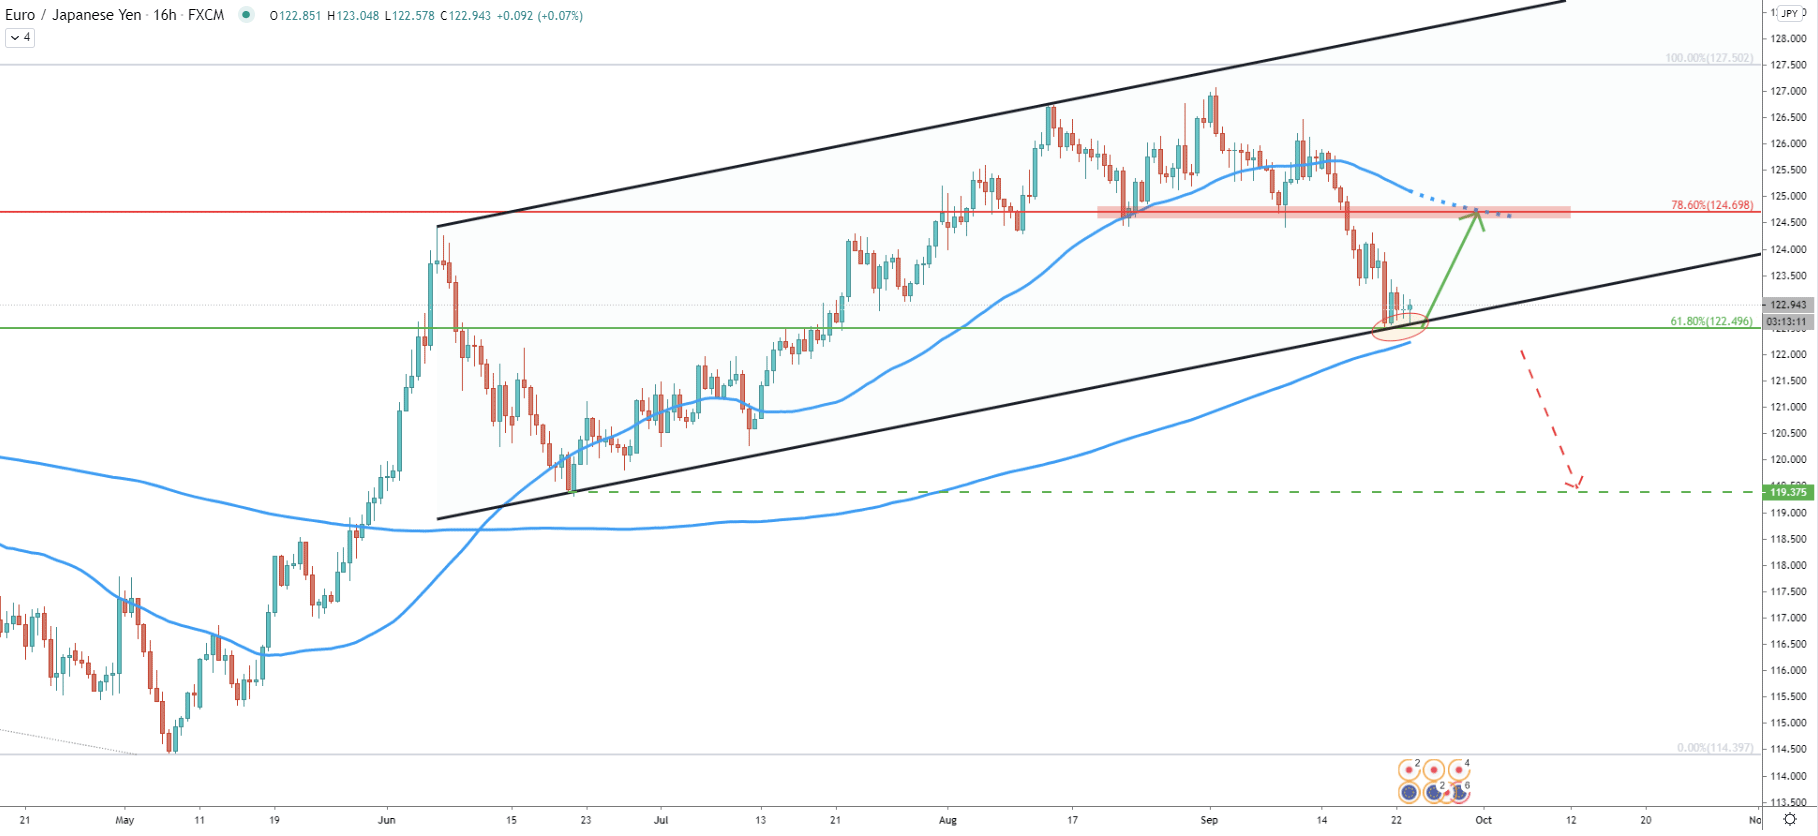
EUR/JPY has reached and rejected the bottom of the ascending channel, while nearly tested the 200 EMA. All-in-all, the price seems to be stuck between the 200 EMA support and the 50 EMA resistance, which corresponds to the previously discussed upside resistance area near 124.69. The resistance also corresponds to the previous demand zone as well as the extended 50 EMA.
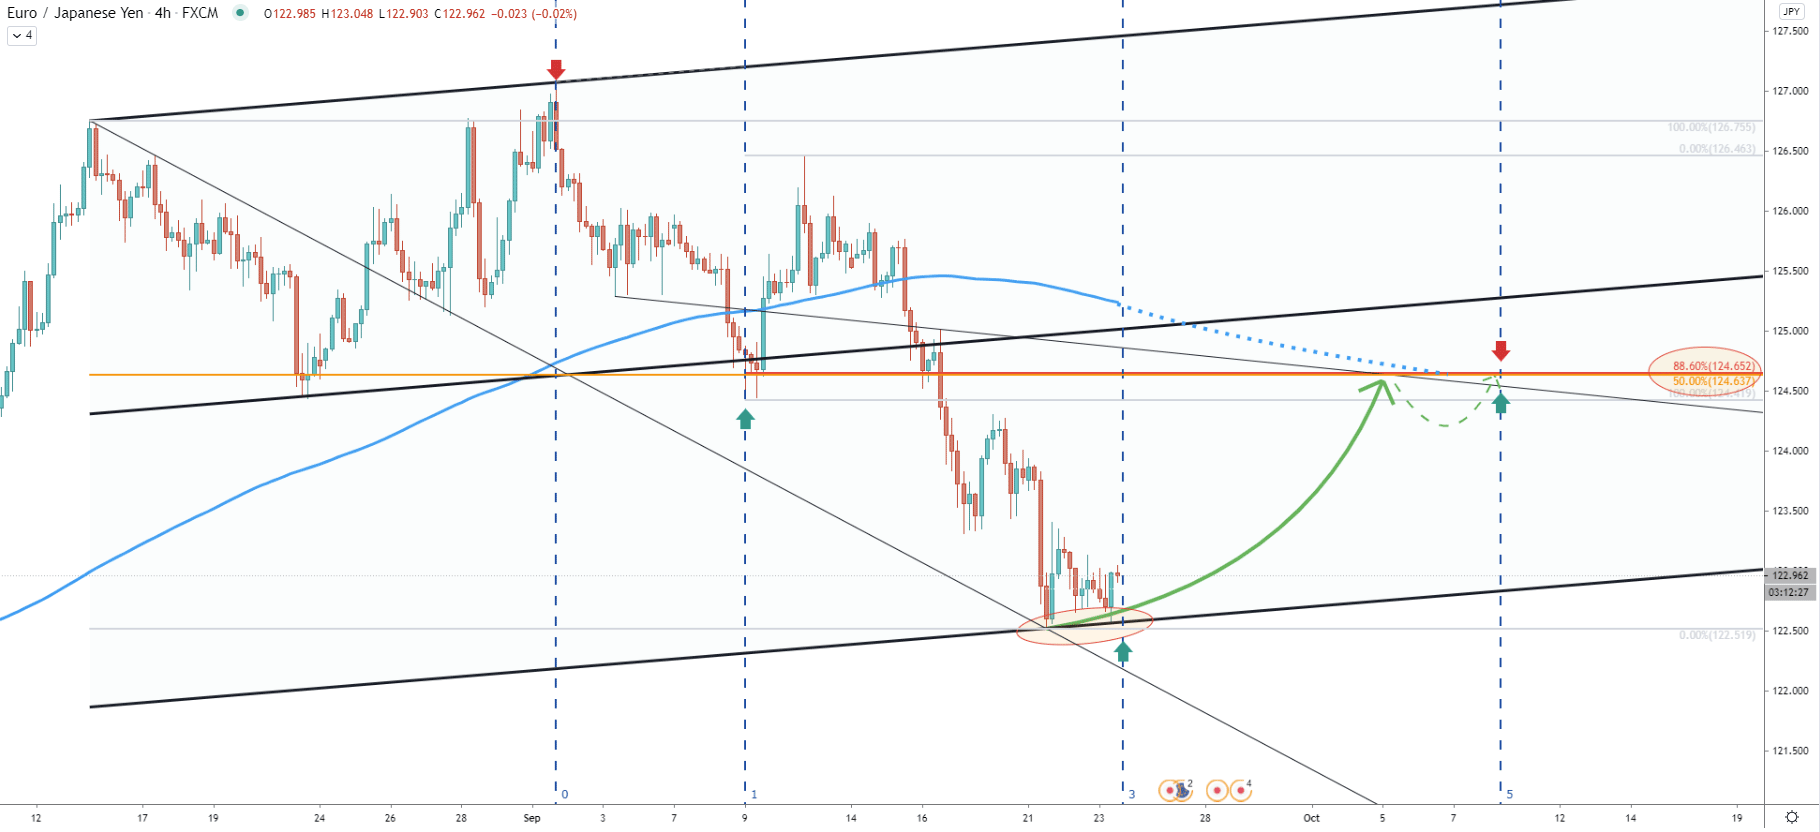
EUR/JPY has reached and rejected twice the bottom of the extended ascending channel. At the same time, the average-price downtrend trendline was also rejected. In addition, a new Fibonacci cycle is about to start, which might result in the beginning of the correctional phase. The next Fibonacci cycle is on October 10, suggesting that upside correction will take approximately two weeks.
On this cart, two more Fibonacci retracement indicators were applied, to the previous corrective wave up and to the overall move down. It can be seen that 88.6% and 50% are located at 124.65, which almost exactly corresponds to the previously discussed resistance at 124.69. Besides, resistance corresponds to the extended 200 EMA and second average-price downtrend trendline.
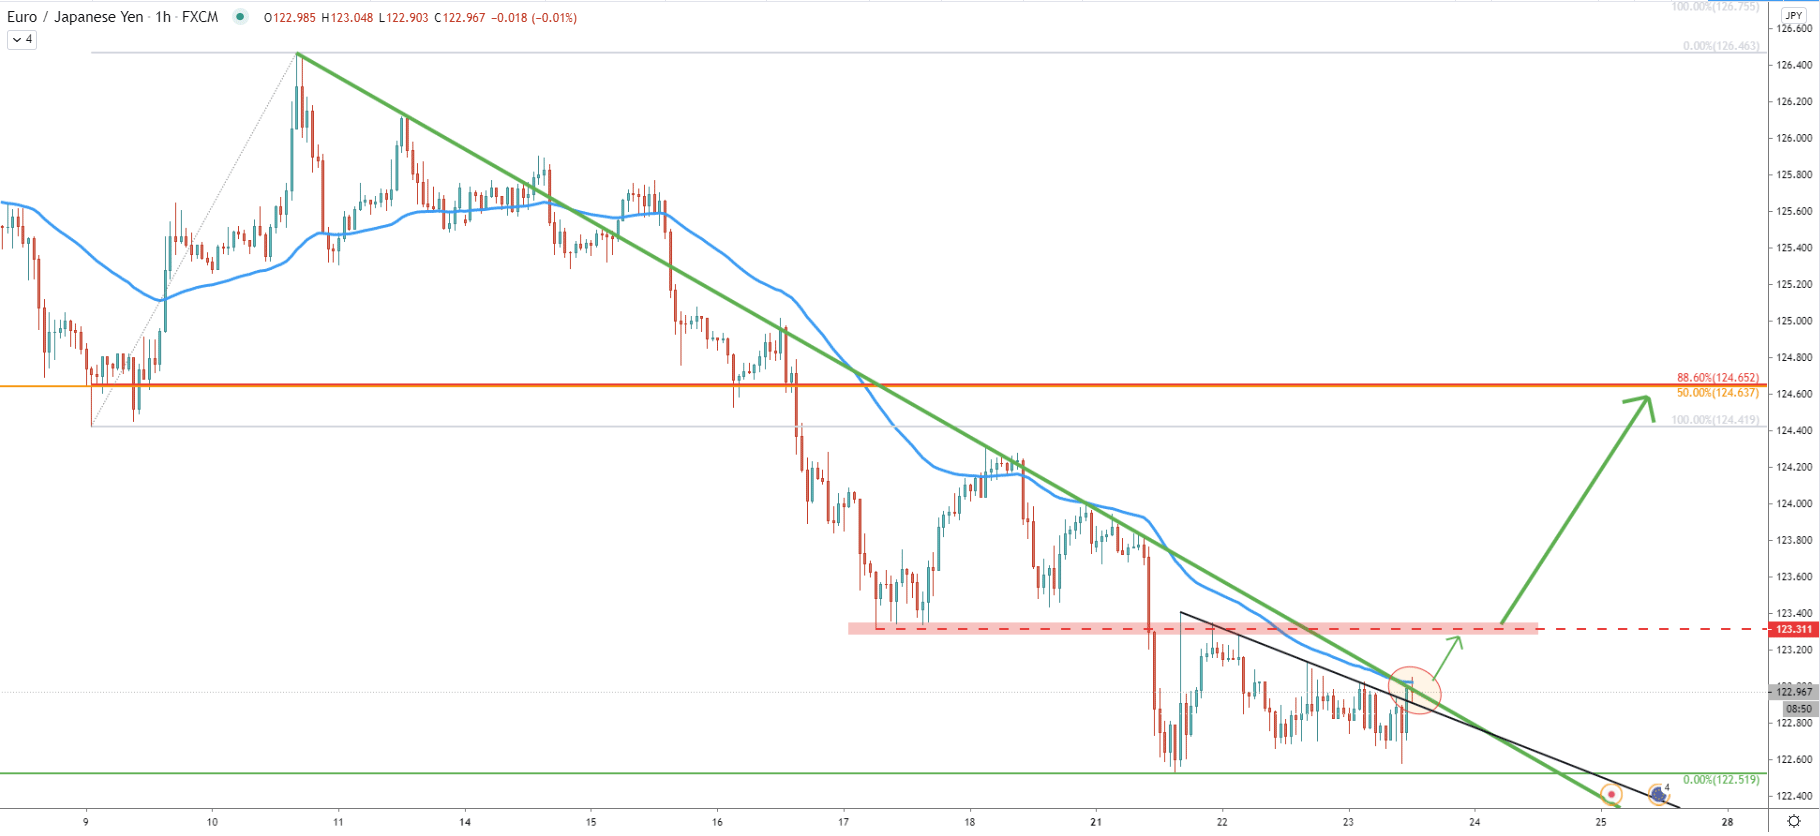
While the trend could be turning from bearish to bullish, there are few minor resistances that EUR/JPY is currently facing. The first is the downtrend trendline along with the 50 EMA, which up until this point were rejected. Perhaps buyers will be waiting for the break and close above 123.00 psychological level before/if considering buying EUR/JPY.
The next resistance is near 123.30, which is a previous demand zone. Upon break above this resistance, the upside correction could be confirmed, resulting in a stronger buying volume, expected this or next week.
EUR/JPY has bounced off two channels as well as the Fibonacci support level, implying that the bottom could have been formed. While further consolidation may take place, the pair certainly has great chances to move up by 160 pips up or even more.
As per the daily and 4-hour chart, there is one strong resistance area located near 124.60. Not only it is confirmed by multiple Moving Averages, but also by 4 different Fibonacci retracement levels.
As per the 16-hour chart, the only way EUR/JPY further downside pressure could increase is if the daily close will be produced below the 122.49 support. Then, and only then bullish outlook might get invalidated and EUR/JPY downtrend might send the price as low as 119.37.
Support: 122.49
Resistance: 123.00, 123.30, 124.60